One of the things I sometimes get asked to do is review someone's postgresql.conf settings. From time to time, I run across a configuration where the value of autovacuum_naptime has been increased, often by a large multiple. The default value of autovacuum_naptime is 1 minute, and I have seen users increase this value to 1 hour, or in one case, 1 day. This is not a good idea. In this blog post, I will attempt to explain why it's not a good idea, and also something about the limited circumstances under which you might want to change autovacuum_naptime.
Read more »
↧
Robert Haas: Tuning autovacuum_naptime
↧
Bruce Momjian: Order of SELECT Clause Execution
SQL is a declaritive language, meaning you specify what you want, rather than how to generate what you want. This leads to a natural language syntax, like the SELECT command. However, once you dig into the behavior of SELECT, it becomes clear that it is necessary to understand the order in which SELECT clauses are executed to take full advantage of the command.
I was going to write up a list of the clause execution ordering, but found this webpage that does a better job of describing it than I could. The ordering bounces from the middle clause (FROM) to the bottom to the top, and then the bottom again. It is hard to remember the ordering, but memorizing it does help in constructing complex SELECT queries.
↧
↧
Gabriele Bartolini: Geo-redundancy of PostgreSQL database backups with Barman
Barman 2.6 introduces support for geo-redundancy, meaning that Barman can now copy from another Barman instance, not just a PostgreSQL database.
Geographic redundancy (or simply geo-redundancy) is a property of a system that replicates data from one site (primary) to a geographically distant location as redundancy, in case the primary system becomes inaccessible or is lost. From version 2.6, it is possible to configure Barman so that the primary source of backups for a server can also be another Barman instance, not just a PostgreSQL database server as before.
![]()
Briefly, you can define a server in your Barman instance (passive, according to the new Barman lingo), and map it to a server defined in another Barman instance (primary).
All you need is an SSH connection between the Barman user in the primary server and the passive one. Barman will then use the rsync copy method to synchronise itself with the origin server, copying both backups and related WAL files, in an asynchronous way. Because Barman shares the same rsync method, geo-redundancy can benefit from key features such as parallel copy and network compression. Incremental backup will be included in future releases.
Geo-redundancy is based on just one configuration option: primary_ssh_command.
Our existing scenario
To explain how geo-redundancy works, we will use the following example scenario. We keep it very simple for now.
We have two identical data centres, one in Europe and one in the US, each with a PostgreSQL database server and a Barman server:
- Europe:
- PostgreSQL server:
eric - Barman server:
jeff, backing up the database server hosted oneric
- PostgreSQL server:
- US:
- PostgreSQL server:
duane - Barman server:
gregg, backing up the database server hosted onduane
- PostgreSQL server:
Let’s have a look at how jeff is configured to backup eric, by reading the content of the /etc/barman.d/eric.conf file:
[eric]description = Main European PostgreSQL server 'Eric'conninfo = user=barman-jeff dbname=postgres host=ericssh_command = ssh postgres@ericbackup_method = rsyncparallel_jobs =4retention_policy = RECOVERY WINDOW OF 2 WEEKSlast_backup_maximum_age =8 DAYSarchiver =onstreaming_archiver =trueslot_name = barman_streaming_jeffFor the sake of simplicity, we skip the configuration of duane in gregg server as it is identical to eric’s in jeff.
Let’s assume that we have had this configuration in production for a few years (this goes beyond the scope of this article indeed).

Now Barman 2.6 is out, we have just updated our systems, and we can finally try and add geo-redundancy in the system.
Adding geo-redundancy
We now have the European Barman that backups up the European PostgreSQL server and the US Barman copying the US PostgreSQL server. Let’s now tell our Barman servers to relay their backups on the other, with a higher retention policy.
As a first step, we need to exchange SSH keys between the barman users (you can find more information about this process on Barman documentation).
We also need to make sure that compression method is the same between the two systems (this is typically set as a global option in the /etc/barman.conf file).
Let’s now proceed by defining duane as a passive server in Barman installed on jeff. Create a file called /etc/barman.d/duane.conf with the following content:
[duane]description = Relay of main US PostgreSQL server 'Duane'primary_ssh_command = ssh greggretention_policy = RECOVERY WINDOW OF 1 MONTHAs you may have noticed, we declare a longer retention policy in the redundant site (one month instead of two weeks).
If you type barman list-server, you will get something similar to:
duane - Relay of main US PostgreSQL server 'Duane' (Passive)
eric - Main European PostgreSQL server 'Eric'
The cron command is responsible for synchronising backups and WAL files. This happens by transparently invoking two commands: sync-backup and sync-wals, which both rely on another command called sync-info (used to poll information from the remote server). If you have installed Barman as a package from 2ndQuadrant public RPM/APT repositories, barman cron will be invoked every minute.
The Barman installation on jeff will now check its catalogue for the duane server with the Barman instance installed on gregg, first copying the backup files (from the most recent one) and then the related WAL files.
One peek at the logs should unveil that Barman has started to synchronise its content with the origin one. To verify that backups are being relayed, type:
When a passive Barman server is copying from the primary Barman, you will see an output like this:
When the synchronisation is completed, you will see the familiar output of the list-backup command:
You can now do the same for the eric server on the gregg Barman instance. Create a file called /etc/barman.d/eric.conf on gregg with the following content:
[eric]description = Relay of main European PostgreSQL server 'Eric'primary_ssh_command = ssh jeffretention_policy = RECOVERY WINDOW OF 1 MONTHThe diagram below depicts the architecture that we have been able to implement via Barman’s geo-redundancy feature:

What’s more
The above scenario can be enhanced by adding a standby server in the same data centre, and/or in the remote one, as well as by making use of the get-wal feature through barman-wal-restore.
The geo-redundancy feature increases the flexibility of Barman for disaster recovery of PostgreSQL databases, with better recovery point objectives and business continuity effectiveness at lower costs.
Should one of your Barman servers go down, you have another copy of your backup data that you can use for disaster recovery – of course with a slightly higher RPO (recovery point objective).
↧
Hubert 'depesz' Lubaczewski: Waiting for PostgreSQL 12 – Allow user control of CTE materialization, and change the default behavior.
On 16th of February 2019, Tom Lane committed patch: Allow user control of CTE materialization, and change the default behavior. Historically we've always materialized the full output of a CTE query, treating WITH as an optimization fence (so that, for example, restrictions from the outer query cannot be pushed into it). This is appropriate … Continue reading "Waiting for PostgreSQL 12 – Allow user control of CTE materialization, and change the default behavior."
↧
Hubert 'depesz' Lubaczewski: why-upgrade updates
Recent change in layout of PG Docs broke my spider for why-upgrade.depesz.com. Today got some time and decided to bite the bullet. Fixed spider code, used it to get new changelog, and while I was at it, did couple of slight modifications of the site: display count of all changes that are there in given … Continue reading "why-upgrade updates"
↧
↧
Kaarel Moppel: Looking at MySQL 8 with PostgreSQL goggles on
First off – not trying to kindle any flame wars here, just trying to broaden my (your) horizons a bit, gather some ideas (maybe I’m missing out on something cool, it’s the most used Open Source RDBMS after all) and to somewhat compare the two despite being a difficult thing to do correctly / objectively. Also I’m leaving aside here performance comparisons and looking at just the available features, general querying experience and documentation clarity as this is I guess most important for beginners. So just a list of points I made for myself, grouped in no particular order.
Disclaimer: last time I used MySQL for some personal project it was 10 years ago, so basically I’m starting from zero and only took one and a half days to get to know it – thus if you see that I’ve gotten something screamingly wrong then please do leave a comment and I’ll change it. Also, my bias in this article probably tends to favour Postgres…but I’m pretty sure a MySQL veteran with good knowledge of pros and cons can write up something similar also on Postgres, so my hope is that you can leave this aside and learn a thing or two about either system.
To run MySQL I used the official Docker image, 8.0.14. Under MySQL the default InnoDB engine is meant.
docker run --rm -p 3306:3306 -e MYSQL_ROOT_PASSWORD=root mysql:8
“mysql” CLI (“psql” equivalent) and general querying experience
* When the server requires a password why doesn’t it just ask for it?
mysql -h 0.0.0.0 -u root   # adding '-p' will fix the error
ERROR 1045 (28000): Access denied for user 'root'@'172.17.0.1' (using password: NO)
* Very poor tab-completion compared to “psql”. Using “mycli” instead makes much sense. I’m myself 99% of time on CLI-s, so it’s essential.
* Lot less shortcut helpers to list tables, views, functions, etc…
* Can’t set to “extended output” (columns as rows) permanently, only “auto” and “per query”.
* One does not need to specify a DB to connect to – I find it positive actually as it’s easy to forgot those database names and when once in, one can call “show databases”.
* No “generate_series” function…might seem like a small thing…but with quite a costly (in time sense) impact when trying to generate some test data. there seems to be an alternative function on github but first you’d need to create a table so not quite the same.
* CLI help has links to web e.g. “help select;” shows “URL: http://dev.mysql.com/doc/refman/8.0/en/select.html” at the end of syntax description. That is great.
* If some SQL script has errors “mysql” immediately stops, where as “psql” would continue unless a bit cryptic “-v ON_ERROR_STOP=1” flag set. I think “mysql” default behaviour is more correct here.
* No SQL standard “TABLE” syntax support. It’s a nice shortcut so I use it a lot for Postgres when testing out features / looking at config or “system stats” tables.
* MySQL has index / optimizer hints, which might be a good thing to direct some queries in your favour. Postgres has decided not to implement this feature as it can also cause problems when queries are not updated when data magnitudes changes or new/better indexes are added. There’s an extension though for Postgres (as usually).
* Some shorthand type casting (“::” in Postgres) seems to be missing. A small thing again sure, but a lot of small things will make out a big one.
* Some “pgbench” equivalent missing. A tiny and simple tool that I personally appreciate a lot in Postgres, really handy to quickly gauge server performance and OS behaviour under heavy load.
MySQL positive findings
* Much more configuration options (548 vs 282), allowing possibly to get better performance or specific behaviour. A double-edged sword though.
* Threaded implementation, should give better total performance for very large numbers (hundreds) of concurrent users.
* Good JSON handling features, like array range indexers for example: “$[1 to 10]” and JSON Path.
* More performance metrics views/tables in the “performance_schema”. Not sure how useful is the information in there though.
* There is an official clustering product option (commercial)
* Built-in support for tablespace and WAL encryption (needs 3rd party stuff for Postgres).
* MySQL workbench, a GUI tool for queries and DB design, is way more capable (and visually nicer) as “pgadmin3/4”. There’s also a commercial version with even more capabilities (backup automation, auditing).
MySQL downsides
* Seems generally more complex as Postgres for a beginner – quite some options and exceptions for different storage engines like MyISAM. Options are not bad, but remember looking as a beginner here.
* Documentation provides too many details at once, making it hard to follow – moving some corner-case stuff (exceptions about old versions etc) onto separate pages would do a lot of good there. Maybe on the plus side: there physically almost 2x more documentation, so chances are than in case of some weird problems you have higher chances for finding some explanations to it.
* From documentation it seems that besides bugfixes also features are added to minor MySQL versions quite often…which a Postgres user would find confusing.
* Less compliant with the SQL standard. At least based on sources I found googling: 1, 2, 3.
* Importing and exporting data. There’s something equivalent to COPY but more complex (some specific grant and config setting involved for loading files located on the DB server) so that a separate tool for importing data, called “mysqlimport”. Also found an interesting passage from the docus that points to some implicit change in transaction behaviour, depending in which way you load data:
With LOAD DATA LOCAL INFILE, data-interpretation and duplicate-key errors become warnings and the operation continues because the server has no way to stop transmission of the file in the middle of the operation.
* EXPLAIN provides less value on trying to understand why a query is slow. Also there is no EXPLAIN ANALYZE – that’s a bit of a bummer as workaround with “trace” is already a bit arcane. “EXPLAIN FORMAT=JSON” provides a bit more detail to estimate the costs though.
* Full-text search is a bit half-baked. Built-in configurations seems are tuned for english only and there is no stemming (Postgres has 15 biggest western languages covered out of the box).
* Some size limits seem arbitrary (64TB on tablespace size, 512GB on InnoDB log files [WAL I assume]). Postgres leaves those to the OS / FS (a single table/partition size is limited to 32TB though).
PostgreSQL architectural/conceptual/platform advantages
* 100% all ACID, no exceptions. MySQL has gotten a lot better with version 8 but not quite there yet with DDL for example.
* More advanced extensions system. MySQL has a plugins system also though, but not as generic to enable for example stored procedures in Python.
* More different index types available (6 vs 3) – for example it’s possible to index strings also for regex search and there are lossy indexes for Big-data. Also MySQL doesn’t seem to support partial indexes.
* Simpler standby replica building / management. From PG10+ it’s a single command on replication host side with no special config group setup.
* Synchronous replication support.
* More closer to Oracle in terms of features, SQL standard compatibility and stored procedure capabilities. Also there are some extensions that add some Oracle string/date processing functions etc.
* Couple of more authentication options available out of the box. MySQL has also LDAP and pluggable authentication though.
* More advanced parallel query execution. Postgres is a couple of years ahead in development here since version 10, MySQL just got the very basic (select count(*) from tbl) support out with the latest 8.0.14.
* JIT (Just-in-time) compilation, e.g. “tailored machine-code” for tuple extraction and filtering. Massive savings for Data Warehouse and other row-intensive type of queries.
MySQL architectural/conceptual/platform advantages
* Multiple storage engines. Something similar in works also for Postgres.
* Less bloat due to use of “UNDO”-based row versioning model. Work-in-progress for Postgres though.
* Threads vs processes should give a boost at high session numbers
* Built-in support for multi-master (Multi-Primary Mode) replication. There are caveats as always (CAP theorem still stands), and very few people needs something like that actually, but definitely reassuring that it’s in the “core” – for Postgres there’s a 3rd-party extension providing similar, but as I’ve understood the plan is to get it into the “core” also.
* Built-in “event scheduling”. Postgres again needs a 3rd party extension or custom C code to employ background workers.
* “REPEATABLE READ” is the default transaction model, providing consistent reads throughout a transaction out of the box, saving novice RDBMS developers possibly from quite some head-scratching.
Things I found weird in MySQL
* A table alias in an aggregate can break a query:
mysql> select count(d.*) from dept_emp de join departments d on d.dept_no = de.dept_no  where emp_no < 10011;
ERROR 1064 (42000): You have an error in your SQL syntax; check the manual that corresponds to your MySQL server version for the right syntax to use near '*) from dept_emp de join departments d on d.dept_no = de.dept_no  where emp_no <' at line 1
* Couldn’t find a list of built-in routines from the system catalog. After some googling found that:
For ease of maintenance, we prefer to document them in only one place: the MySQL manual. Well OK, kind of makes sense, but why not to create some catalog view where one could at least have the function names and do something like “\df *terminate*”. Very handy in Postgres.
* One needs to always specify an index name! I personally leave it to Postgres as life has shown that it’s super hard to enforce a naming policy, even when the team consists of a…single developer (yes, I’m looking at myself).
* TIMESTAMP min value is ‘1970-01-01 00:00:01.000000’ and the more generous DATETIME starts with ’1000-01-01 00:00:00′ but doesn’t know about time zones…
* The effective maximum length of a VARCHAR is subject to the maximum row size (65,535 bytes, which is shared among all VARCHAR columns).
* It is not possible to (easily, w/o CASE WHEN workaround) specify if you like your NULL-s first or last, which is very weird…as this is specified in SQL Standard 2003, 15 years ago :/ By the way, default “ASC(ENDING)” mode the behaviour is also contrary to Postgres, which has NULLS LAST. Has to do with that part not specified in the SQL standard.
* No FULL OUTER JOIN. Sure, they’re quite rarely used, but most of the “competitors” have them and shouldn’t be too hard to implement if having LEFT JOIN etc.
* Only “Nested Loop” joins and it’s variations. Postgres has additionally also “Hash” and “Merge” join which help a lot when joining millions of rows.
Things I found very weird in MySQL
* CAST() function does not support all data types :/. For example “int” is available when declaring tables but:
mysql> select cast('1' as int) x;   -- will work when cast to 'unsigned'
ERROR 1064 (42000): You have an error in your SQL syntax
* Some DDL (e.g. dropping a table) is not transactional! New tables are also immediately visible (empty though) to other transactions, when declared from a not-yet-commited transaction. Not ACID enough MySQL.
* CHECK constraints can be declared but they are silently ignored!
* FOREIGN KEY-s declared with the shorter REFERENCES syntax (at the end of column definitions) are not enforced and there are even no errors when the referenced table/column is missing! One needs to use the longer FOREIGN KEY + REFERENCES syntax.
* “Truncation of excess trailing spaces from values to be inserted into TEXT columns always generates a warning, regardless of the SQL mode.” i.e. data is silently chopped despite of the “STRICT MODE” which is the default. For indexes truncating data would be OK (Postgres does it also), but not for data.
MySQL cool features that I would welcome in Postgres
* Implicit session variables. In PG it’s also possible, but in a tedious way with “set”/set_config() + current_setting() functions. There’s a patch in circulation also for Postgres but not yet in core.
"select @a := 42; select @a;"
* Builtin “spatial” support. MySQL GIS functions fall short of Postgres equivalent PostGIS though, but having it in “contrib” and officially supported would make it a lot more visible and provide more guarantees for potential developers on lookout for a GIS platform, in result aiding the whole Postgres project.
* Generated columns. In Postgres you need views currently, but some work on that is luckily in progress already.
* Resource groups to prioritize/throttle some workloads (users) within an instance. Currently only CPU can be managed.
* “X Protocol” plugin. A relatively new thing that allows asynchronous calls from a single session!
* Auto-updated TIMESTAMP columns (ON UPDATE CURRENT_TIMESTAMP) when row is changed. In Postgres similar works only on initial INSERT and needs a trigger otherwise
* A single “SHOW STATUS” SQL command that gives a nice overview of global server status for both server events and normal query operations – Connections, Aborted_connects, Innodb_num_open_files, Bytes_received / sent, “admin commands” counter, object create/drop counters,pages_read/written, locks, etc. For Postgres it’s only possible with continuous pg_stat* monitoring and/or continuous log file parsing.
* RESTART (also SHUTDOWN) – a SQL command that stops and restarts the MySQL server. It requires the SHUTDOWN privilege.
* Real clustered (index-organized) tables (PRIMARY KEY implementation). In Postgres clustering is effective only for a short(ish) time.
* There’s a dead simple tool on board that auto-generates SSL certs both for server and clients.
* Fres 8.0.14 version permits accounts to have dual passwords, designated as primary and secondary passwords. This enables smooth password phaseouts.
My verdict on MySQL 8 vs PostgreSQL 11
First again, the idea of the article is not to bash MySQL – it has shown a lot of progress recently with the latest version 8. Judging by the release notes, a lot of issues got eliminated and cool features (e.g. CTE-s, Window functions) added, making it more enterprise-suitable. There’s also much more activity happening on the source code repository compared to Postgres (according to www.openhub.net), and even if it’s a bit hard to acknowledge for a PostgreSQL consultant – it has much more installations and has very good future prospects to develop further due to solid financial backing, which is a bit of a topic for Postgres as it’s not really owned by any company (which is a good thing in other aspects).
But to somehow sum it up – currently (having a lot-lot more PG knowledge, of course) I would still recommend Postgres for 99% of users needing a relational database for their project. The remaining 1% percent would be then for cases where some global start-up scaling would be required, due to native multi-master support. In other aspects PostgreSQL is bit more light-weight, comprehensible (yes, this means occasionally also less choices) and most importantly provides less surprises and doesn’t play with data integrity: it is simply not possible to lose/violate data if you have constraints (checks, foreign keys) set! With MySQL you need to keep your guards up at the developer end…but as we know, people forget and are busy and take shortcuts when under time pressure – something that could bite you hard years after the shortcut was taken. Also Postgres has more advanced extension possibilities, for example 100+ Foreign Data Wrappers for the weirdest data integration needs.
Hope you found something new and interesting for yourself, thanks for reading!
The post Looking at MySQL 8 with PostgreSQL goggles on appeared first on Cybertec.
↧
Stefan Fercot: Monitor pgBackRest backups with Nagios
pgBackRest is a well-known powerful backup and restore tool.
Relying on the status information given by the “info” command, we’ve build a specific plugin for Nagios : check_pgbackrest.
This post will help you discover this plugin and assume you already know pgBackRest and Nagios.
Let’s assume we have a PostgreSQL cluster with pgBackRest working correctly.
Given this simple configuration:
[global]repo1-path=/some_shared_space/repo1-retention-full=2[mystanza]pg1-path=/var/lib/pgsql/11/dataLet’s get the status of our backups with the pgbackrest info command:
stanza: mystanza
    status: ok
    cipher: none

    db (current)
        wal archive min/max (11-1): 00000001000000040000003C/000000010000000B0000004E

        full backup: 20190219-121527F
            timestamp start/stop: 2019-02-19 12:15:27 / 2019-02-19 12:18:15
            wal start/stop: 00000001000000040000003C / 000000010000000400000080
            database size: 3.0GB, backup size: 3.0GB
            repository size: 168.5MB, repository backup size: 168.5MB

        incr backup: 20190219-121527F_20190219-121815I
            timestamp start/stop: 2019-02-19 12:18:15 / 2019-02-19 12:20:38
            wal start/stop: 000000010000000400000082 / 0000000100000004000000B8
            database size: 3.0GB, backup size: 2.9GB
            repository size: 175.2MB, repository backup size: 171.6MB
            backup reference list: 20190219-121527F

        incr backup: 20190219-121527F_20190219-122039I
            timestamp start/stop: 2019-02-19 12:20:39 / 2019-02-19 12:22:55
            wal start/stop: 0000000100000004000000C1 / 0000000100000004000000F4
            database size: 3.0GB, backup size: 3.0GB
            repository size: 180.9MB, repository backup size: 177.3MB
            backup reference list: 20190219-121527F, 20190219-121527F_20190219-121815I

        full backup: 20190219-122255F
            timestamp start/stop: 2019-02-19 12:22:55 / 2019-02-19 12:25:47
            wal start/stop: 000000010000000500000000 / 00000001000000050000003D
            database size: 3.0GB, backup size: 3.0GB
            repository size: 186.5MB, repository backup size: 186.5MB

        incr backup: 20190219-122255F_20190219-122548I
            timestamp start/stop: 2019-02-19 12:25:48 / 2019-02-19 12:28:17
            wal start/stop: 000000010000000500000040 / 000000010000000500000077
            database size: 3GB, backup size: 3.0GB
            repository size: 192.3MB, repository backup size: 188.7MB
            backup reference list: 20190219-122255F

        incr backup: 20190219-122255F_20190219-122817I
            timestamp start/stop: 2019-02-19 12:28:17 / 2019-02-19 12:30:36
            wal start/stop: 00000001000000050000007F / 0000000100000005000000B1
            database size: 3GB, backup size: 3.0GB
            repository size: 197.2MB, repository backup size: 193.5MB
            backup reference list: 20190219-122255F
We can now use the check_pgbackrest Nagios plugin. See the INSTALL.md file
for the complete list of prerequisites.
$ sudo yum install perl-JSON epel-release perl-Net-SFTP-Foreign
To display “human readable” output, we’ll use the --format=human argument.
Monitor the backup retention
The retention service will fail when the number of full backups is less than
the --retention-full argument.
Example:
$ ./check_pgbackrest --service=retention --stanza=mystanza --retention-full=2 --format=human
Service        : BACKUPS_RETENTION
Returns        : 0 (OK)
Message        : backups policy checks ok
Long message   : full=2
Long message   : diff=0
Long message   : incr=4
Long message   : latest=incr,20190219-122255F_20190219-122817I
Long message   : latest_age=1h18m50s
$ ./check_pgbackrest --service=retention --stanza=mystanza --retention-full=3 --format=human
Service        : BACKUPS_RETENTION
Returns        : 2 (CRITICAL)
Message        : not enough full backups, 3 required
Long message   : full=2
Long message   : diff=0
Long message   : incr=4
Long message   : latest=incr,20190219-122255F_20190219-122817I
Long message   : latest_age=1h19m25s
It can also fail when the newest backup is older than the --retention-age
argument.
The following units are accepted (not case sensitive):
s (second), m (minute), h (hour), d (day).
You can use more than one unit per given value.
$ ./check_pgbackrest --service=retention --stanza=mystanza --retention-age=1h --format=human
Service        : BACKUPS_RETENTION
Returns        : 2 (CRITICAL)
Message        : backups are too old
Long message   : full=2
Long message   : diff=0
Long message   : incr=4
Long message   : latest=incr,20190219-122255F_20190219-122817I
Long message   : latest_age=1h19m56s
$ ./check_pgbackrest --service=retention --stanza=mystanza --retention-age=2h --format=human
Service        : BACKUPS_RETENTION
Returns        : 0 (OK)
Message        : backups policy checks ok
Long message   : full=2
Long message   : diff=0
Long message   : incr=4
Long message   : latest=incr,20190219-122255F_20190219-122817I
Long message   : latest_age=1h19m59s
Those 2 options can be used simultaneously:
$ ./check_pgbackrest --service=retention --stanza=mystanza --retention-age=2h --retention-full=2
BACKUPS_RETENTION OK - backups policy checks ok |
full=2 diff=0 incr=4 latest=incr,20190219-122255F_20190219-122817I latest_age=1h20m36s
This service works fine for local or remote backups since it only relies on the info command.
Monitor local WAL segments archives
The archives service checks if all archived WALs exist between the oldest and
the latest WAL needed for the recovery.
This service requires the --repo-path argument to specify where the archived
WALs are stored locally.
Archives must be compressed (.gz). If needed, use “compress-level=0” instead of “compress=n”.
Use the --wal-segsize argument to set the WAL segment size if you don’t use
the default one.
The following units are accepted (not case sensitive):
b (Byte), k (KB), m (MB), g (GB), t (TB), p (PB), e (EB) or Z (ZB).
Only integers are accepted. Eg. 1.5MB will be refused, use 1500kB.
The factor between units is 1024 bytes. Eg. 1g = 1G = 1024*1024*1024.
Example:
$ ./check_pgbackrest --service=archives --stanza=mystanza --repo-path="/some_shared_space/archive"--format=human
Service        : WAL_ARCHIVES
Returns        : 0 (OK)
Message        : 1811 WAL archived, latest archived since 41m48s
Long message   : latest_wal_age=41m48s
Long message   : num_archives=1811
Long message   : archives_dir=/some_shared_space/archive/mystanza/11-1
Long message   : oldest_archive=00000001000000040000003C-1937e658f8693e3949583d909456ef84398abd03.gz
Long message   : latest_archive=000000010000000B0000004E-2b9cc85b487a8e7b297148169018d46e6b7f1ed2.gz
Monitor remote WAL segments archives
The archives service can also check remote archived WALs using SFTP with the
--repo-host and --repo-host-user arguments.
As reminder, you have to setup a trusted SSH communication between the hosts.
We’ll also here assume you have a working setup.
Here’s a simple configuration:
- On the database server
[global]repo1-host=remoterepo1-host-user=postgres[mystanza]pg1-path=/var/lib/pgsql/11/data- On the backup server
[global]repo1-path=/var/lib/pgbackrestrepo1-retention-full=2[mystanza]pg1-path=/var/lib/pgsql/11/datapg1-host=myserverpg1-host-user=postgresWhile the backups are taken from the remote server, the pgbackrest info
command can be executed on both servers:
stanza: mystanza
    status: ok
    cipher: none

    db (current)
        wal archive min/max (11-1): 000000010000000B0000006B/000000010000000D00000078

        full backup: 20190219-143643F
            timestamp start/stop: 2019-02-19 14:36:43 / 2019-02-19 14:40:34
            wal start/stop: 000000010000000B0000006B / 000000010000000B000000A9
            database size: 3GB, backup size: 3GB
            repository size: 242MB, repository backup size: 242MB

        incr backup: 20190219-143643F_20190219-144035I
            timestamp start/stop: 2019-02-19 14:40:35 / 2019-02-19 14:43:23
            wal start/stop: 000000010000000B000000AD / 000000010000000B000000E2
            database size: 3GB, backup size: 3.0GB
            repository size: 246.3MB, repository backup size: 242.7MB
            backup reference list: 20190219-143643F

        incr backup: 20190219-143643F_20190219-144325I
            timestamp start/stop: 2019-02-19 14:43:25 / 2019-02-19 14:46:32
            wal start/stop: 000000010000000B000000EC / 000000010000000C00000022
            database size: 3GB, backup size: 3GB
            repository size: 250.5MB, repository backup size: 246.9MB
            backup reference list: 20190219-143643F, 20190219-143643F_20190219-144035I

        full backup: 20190219-144634F
            timestamp start/stop: 2019-02-19 14:46:34 / 2019-02-19 14:50:27
            wal start/stop: 000000010000000C0000002B / 000000010000000C00000069
            database size: 3GB, backup size: 3GB
            repository size: 253.7MB, repository backup size: 253.7MB

        incr backup: 20190219-144634F_20190219-145028I
            timestamp start/stop: 2019-02-19 14:50:28 / 2019-02-19 14:53:10
            wal start/stop: 000000010000000C0000006C / 000000010000000C000000A5
            database size: 3GB, backup size: 3GB
            repository size: 258.1MB, repository backup size: 254.5MB
            backup reference list: 20190219-144634F

        incr backup: 20190219-144634F_20190219-145311I
            timestamp start/stop: 2019-02-19 14:53:11 / 2019-02-19 14:56:26
            wal start/stop: 000000010000000C000000AB / 000000010000000C000000E3
            database size: 3GB, backup size: 3GB
            repository size: 262MB, repository backup size: 258.4MB
            backup reference list: 20190219-144634F, 20190219-144634F_20190219-145028I
Example from the database server:
$ ./check_pgbackrest --service=archives --stanza=mystanza --repo-path="/var/lib/pgbackrest/archive"--repo-host=remote --format=human
Service        : WAL_ARCHIVES
Returns        : 0 (OK)
Message        : 526 WAL archived, latest archived since 41s
Long message   : latest_wal_age=41s
Long message   : num_archives=526
Long message   : archives_dir=/var/lib/pgbackrest/archive/mystanza/11-1
Long message   : min_wal=000000010000000B0000006B
Long message   : max_wal=000000010000000D00000078
Long message   : oldest_archive=000000010000000B0000006B-2609fef06d974e5918be051d8a409e7b8b50c818.gz
Long message   : latest_archive=000000010000000D00000078-f46f2ccdd176e4de9036d70fc51e1a7dd75aebbf.gz
From the backup server, use the “local” command:
$ ./check_pgbackrest --service=archives --stanza=mystanza --repo-path="/var/lib/pgbackrest/archive"In case of missing archived WAL segment, you’ll get an error:
$ ./check_pgbackrest --service=archives --stanza=mystanza --repo-path="/var/lib/pgbackrest/archive"--repo-host=remote
WAL_ARCHIVES CRITICAL - wrong sequence or missing file @ '000000010000000D00000037'
Remark
With pgBackRest 2.10, you might not get the min_wal and max_wal values:
Long message   : min_wal=000000010000000B0000006B
Long message   : max_wal=000000010000000D00000078
That behavior comes from the pgbackrest info command. Indeed, when specifying
--stanza=mystanza, that information is missing:
wal archive min/max (11-1): none present
Tips
The --command argument allows to specify which pgBackRest executable file to
use (default: “pgbackrest”).
The --config parameter allows to provide a specific configuration file to
pgBackRest.
If needed, some prefix command to execute the pgBackRest info command can be
specified with the --prefix option (eg: “sudo -iu postgres”).
Conclusion
check_pgbackrest is an open project, licensed under the PostgreSQL license.
Any contribution to improve it is welcome.
↧
Bruce Momjian: Trusted and Untrusted Languages
Postgres supports two types of server-side languages, trusted and untrusted. Trusted languages are available for all users because they have safe sandboxes that limit user access. Untrusted languages are only available to superusers because they lack sandboxes.
Some languages have only trusted versions, e.g., PL/pgSQL. Others have only untrusted ones, e.g., PL/Python. Other languages like Perl have both.
Why would you want to have both trusted and untrusted languages available? Well, trusted languages like PL/Perl limit access to only safe resources, while untrusted languages like PL/PerlU allow access to files system and network resources that would be unsafe for non-superusers, i.e., it would effectively give them the same power as superusers. This is why only superusers can use untrusted languages.
↧
Paul Ramsey: Upgrading PostGIS on Centos 7

New features and better performance get a lot of attention, but one of the relatively unsung improvements in PostGIS over the past ten years has been inclusion in standard software repositories, making installation of this fairly complex extension a "one click" affair.
Once you've got PostgreSQL/PostGIS installed though, how are upgrades handled? The key is having the right versions in place, at the right time, for the right scenario and knowing a little bit about how PostGIS works.

↧
↧
Nickolay Ihalainen: Parallel queries in PostgreSQL

![]() Modern CPU models have a huge number of cores. For many years, applications have been sending queries in parallel to databases. Where there are reporting queries that deal with many table rows, the ability for a query to use multiple CPUs helps us with a faster execution. Parallel queries in PostgreSQL allow us to utilize many CPUs to finish report queries faster. The parallel queries feature was implemented in 9.6 and helps. Starting from PostgreSQL 9.6 a report query is able to use many CPUs and finish faster.
Modern CPU models have a huge number of cores. For many years, applications have been sending queries in parallel to databases. Where there are reporting queries that deal with many table rows, the ability for a query to use multiple CPUs helps us with a faster execution. Parallel queries in PostgreSQL allow us to utilize many CPUs to finish report queries faster. The parallel queries feature was implemented in 9.6 and helps. Starting from PostgreSQL 9.6 a report query is able to use many CPUs and finish faster.
The initial implementation of the parallel queries execution took three years. Parallel support requires code changes in many query execution stages. PostgreSQL 9.6 created an infrastructure for further code improvements. Later versions extended parallel execution support for other query types.
Limitations
- Do not enable parallel executions if all CPU cores are already saturated. Parallel execution steals CPU time from other queries, and increases response time.
- Most importantly, parallel processing significantly increases memory usage with high WORK_MEM values, as each hash join or sort operation takes a work_mem amount of memory.
- Next, low latency OLTP queries can’t be made any faster with parallel execution. In particular, queries that returns a single row can perform badly when parallel execution is enabled.
- The Pierian spring for developers is a TPC-H benchmark. Check if you have similar queries for the best parallel execution.
- Parallel execution supports only SELECT queries without lock predicates.
- Proper indexing might be a better alternative to a parallel sequential table scan.
- There is no support for cursors or suspended queries.
- Windowed functions and ordered-set aggregate functions are non-parallel.
- There is no benefit for an IO-bound workload.
- There are no parallel sort algorithms. However, queries with sorts still can be parallel in some aspects.
- Replace CTE (WITH …) with a sub-select to support parallel execution.
- Foreign data wrappers do not currently support parallel execution (but they could!)
- There is no support for FULL OUTER JOIN.
- Clients setting max_rows disable parallel execution.
- If a query uses a function that is not marked as PARALLEL SAFE, it will be single-threaded.
- SERIALIZABLE transaction isolation level disables parallel execution.
Test environment
The PostgreSQL development team have tried to improve TPC-H benchmark queries’ response time. You can download the benchmark and adapt it to PostgreSQL by using these instructions. It’s not an official way to use the TPC-H benchmark, so you shouldn’t use it to compare different databases or hardware.
- Download TPC-H_Tools_v2.17.3.zip (or newer version) from official TPC site.
- Rename makefile.suite to Makefile and modify it as requested at https://github.com/tvondra/pg_tpch . Compile the code with make command
- Generate data: ./dbgen -s 10 generates 23GB database which is enough to see the difference in performance for parallel and non-parallel queries.
- Convert tbl files to csv with for + sed
- Clone pg_tpch repository and copy csv files to pg_tpch/dss/data
- Generate queries with qgen command
- Load data to the database with ./tpch.sh command.
Parallel sequential scan
This might be faster not because of parallel reads, but due to scattering of data across many CPU cores. Modern OS provides good caching for PostgreSQL data files. Read-ahead allows getting a block from storage more than just the block requested by PG daemon. As a result, query performance is not limited due to disk IO. It consumes CPU cycles for:
- reading rows one by one from table data pages
- comparing row values and WHERE conditions
Let’s try to execute simple select query:
tpch=# explain analyze select l_quantity as sum_qty from lineitem where l_shipdate <= date '1998-12-01' - interval '105' day;
QUERY PLAN
--------------------------------------------------------------------------------------------------------------------------
Seq Scan on lineitem (cost=0.00..1964772.00 rows=58856235 width=5) (actual time=0.014..16951.669 rows=58839715 loops=1)
Filter: (l_shipdate <= '1998-08-18 00:00:00'::timestamp without time zone)
Rows Removed by Filter: 1146337
Planning Time: 0.203 ms
Execution Time: 19035.100 ms
A sequential scan produces too many rows without aggregation. So, the query is executed by a single CPU core.
After adding SUM(), it’s clear to see that two workers will help us to make the query faster:
explain analyze select sum(l_quantity) as sum_qty from lineitem where l_shipdate <= date '1998-12-01' - interval '105' day;
QUERY PLAN
----------------------------------------------------------------------------------------------------------------------------------------------------
Finalize Aggregate (cost=1589702.14..1589702.15 rows=1 width=32) (actual time=8553.365..8553.365 rows=1 loops=1)
-> Gather (cost=1589701.91..1589702.12 rows=2 width=32) (actual time=8553.241..8555.067 rows=3 loops=1)
Workers Planned: 2
Workers Launched: 2
-> Partial Aggregate (cost=1588701.91..1588701.92 rows=1 width=32) (actual time=8547.546..8547.546 rows=1 loops=3)
-> Parallel Seq Scan on lineitem (cost=0.00..1527393.33 rows=24523431 width=5) (actual time=0.038..5998.417 rows=19613238 loops=3)
Filter: (l_shipdate <= '1998-08-18 00:00:00'::timestamp without time zone)
Rows Removed by Filter: 382112
Planning Time: 0.241 ms
Execution Time: 8555.131 ms
The more complex query is 2.2X faster compared to the plain, single-threaded select.
Parallel Aggregation
A “Parallel Seq Scan” node produces rows for partial aggregation. A “Partial Aggregate” node reduces these rows with SUM(). At the end, the SUM counter from each worker collected by “Gather” node.
The final result is calculated by the “Finalize Aggregate” node. If you have your own aggregation functions, do not forget to mark them as “parallel safe”.
Number of workers
We can increase the number of workers without server restart:
alter system set max_parallel_workers_per_gather=4;
select * from pg_reload_conf();
Now, there are 4 workers in explain output:
tpch=# explain analyze select sum(l_quantity) as sum_qty from lineitem where l_shipdate <= date '1998-12-01' - interval '105' day;
QUERY PLAN
----------------------------------------------------------------------------------------------------------------------------------------------------
Finalize Aggregate (cost=1440213.58..1440213.59 rows=1 width=32) (actual time=5152.072..5152.072 rows=1 loops=1)
-> Gather (cost=1440213.15..1440213.56 rows=4 width=32) (actual time=5151.807..5153.900 rows=5 loops=1)
Workers Planned: 4
Workers Launched: 4
-> Partial Aggregate (cost=1439213.15..1439213.16 rows=1 width=32) (actual time=5147.238..5147.239 rows=1 loops=5)
-> Parallel Seq Scan on lineitem (cost=0.00..1402428.00 rows=14714059 width=5) (actual time=0.037..3601.882 rows=11767943 loops=5)
Filter: (l_shipdate <= '1998-08-18 00:00:00'::timestamp without time zone)
Rows Removed by Filter: 229267
Planning Time: 0.218 ms
Execution Time: 5153.967 ms
What’s happening here? We have changed the number of workers from 2 to 4, but the query became only 1.6599 times faster. Actually, scaling is amazing. We had two workers plus one leader. After a configuration change, it becomes 4+1.
The biggest improvement from parallel execution that we can achieve is: 5/3 = 1.66(6)X faster.
How does it work?
Processes
Query execution always starts in the “leader” process. A leader executes all non-parallel activity and its own contribution to parallel processing. Other processes executing the same queries are called “worker” processes. Parallel execution utilizes the Dynamic Background Workers infrastructure (added in 9.4). As other parts of PostgreSQL uses processes, but not threads, the query creating three worker processes could be 4X faster than the traditional execution.
Communication
Workers communicate with the leader using a message queue (based on shared memory). Each process has two queues: one for errors and the second one for tuples.
How many workers to use?
Firstly, the max_parallel_workers_per_gather parameter is the smallest limit on the number of workers. Secondly, the query executor takes workers from the pool limited by max_parallel_workers size. Finally, the top-level limit is max_worker_processes: the total number of background processes.
Failed worker allocation leads to single-process execution.
The query planner could consider decreasing the number of workers based on a table or index size. min_parallel_table_scan_size and min_parallel_index_scan_size control this behavior.
set min_parallel_table_scan_size='8MB'
8MB table => 1 worker
24MB table => 2 workers
72MB table => 3 workers
x => log(x / min_parallel_table_scan_size) / log(3) + 1 worker
Each time the table is 3X bigger than min_parallel_(index|table)_scan_size, postgres adds a worker. The number of workers is not cost-based! A circular dependency makes a complex implementation hard. Instead, the planner uses simple rules.
In practice, these rules are not always acceptable in production and you can override the number of workers for the specific table with ALTER TABLE … SET (parallel_workers = N).
Why parallel execution is not used?
Besides to the long list of parallel execution limitations, PostgreSQL checks costs:
parallel_setup_cost to avoid parallel execution for short queries. It models the time spent for memory setup, process start, and initial communication
parallel_tuple_cost : The communication between leader and workers could take a long time. The time is proportional to the number of tuples sent by workers. The parameter models the communication cost.
Nested loop joins
PostgreSQL 9.6+ could execute a “Nested loop” in parallel due to the simplicity of the operation.
explain (costs off) select c_custkey, count(o_orderkey)
                from    customer left outer join orders on
                                c_custkey = o_custkey and o_comment not like '%special%deposits%'
                group by c_custkey;
                                      QUERY PLAN
--------------------------------------------------------------------------------------
 Finalize GroupAggregate
   Group Key: customer.c_custkey
   ->  Gather Merge
         Workers Planned: 4
         ->  Partial GroupAggregate
               Group Key: customer.c_custkey
               ->  Nested Loop Left Join
                     ->  Parallel Index Only Scan using customer_pkey on customer
                     ->  Index Scan using idx_orders_custkey on orders
                           Index Cond: (customer.c_custkey = o_custkey)
                           Filter: ((o_comment)::text !~~ '%special%deposits%'::text)
Gather happens in the last stage, so “Nested Loop Left Join” is a parallel operation. “Parallel Index Only Scan” is available from version 10. It acts in a similar way to a parallel sequential scan. The
c_custkey = o_custkeycondition reads a single order for each customer row. Thus it’s not parallel.
Hash Join
Each worker builds its own hash table until PostgreSQL 11. As a result, 4+ workers weren’t able to improve performance. The new implementation uses a shared hash table. Each worker can utilize WORK_MEM to build the hash table.
select
        l_shipmode,
        sum(case
                when o_orderpriority = '1-URGENT'
                        or o_orderpriority = '2-HIGH'
                        then 1
                else 0
        end) as high_line_count,
        sum(case
                when o_orderpriority <> '1-URGENT'
                        and o_orderpriority <> '2-HIGH'
                        then 1
                else 0
        end) as low_line_count
from
        orders,
        lineitem
where
        o_orderkey = l_orderkey
        and l_shipmode in ('MAIL', 'AIR')
        and l_commitdate < l_receiptdate
        and l_shipdate < l_commitdate
        and l_receiptdate >= date '1996-01-01'
        and l_receiptdate < date '1996-01-01' + interval '1' year
group by
        l_shipmode
order by
        l_shipmode
LIMIT 1;
                                                                                                                                    QUERY PLAN
-----------------------------------------------------------------------------------------------------------------------------------------------------------------------------------------------------------------------------------------------------------------------------------
 Limit  (cost=1964755.66..1964961.44 rows=1 width=27) (actual time=7579.592..7922.997 rows=1 loops=1)
   ->  Finalize GroupAggregate  (cost=1964755.66..1966196.11 rows=7 width=27) (actual time=7579.590..7579.591 rows=1 loops=1)
         Group Key: lineitem.l_shipmode
         ->  Gather Merge  (cost=1964755.66..1966195.83 rows=28 width=27) (actual time=7559.593..7922.319 rows=6 loops=1)
               Workers Planned: 4
               Workers Launched: 4
               ->  Partial GroupAggregate  (cost=1963755.61..1965192.44 rows=7 width=27) (actual time=7548.103..7564.592 rows=2 loops=5)
                     Group Key: lineitem.l_shipmode
                     ->  Sort  (cost=1963755.61..1963935.20 rows=71838 width=27) (actual time=7530.280..7539.688 rows=62519 loops=5)
                           Sort Key: lineitem.l_shipmode
                           Sort Method: external merge  Disk: 2304kB
                           Worker 0:  Sort Method: external merge  Disk: 2064kB
                           Worker 1:  Sort Method: external merge  Disk: 2384kB
                           Worker 2:  Sort Method: external merge  Disk: 2264kB
                           Worker 3:  Sort Method: external merge  Disk: 2336kB
                           ->  Parallel Hash Join  (cost=382571.01..1957960.99 rows=71838 width=27) (actual time=7036.917..7499.692 rows=62519 loops=5)
                                 Hash Cond: (lineitem.l_orderkey = orders.o_orderkey)
                                 ->  Parallel Seq Scan on lineitem  (cost=0.00..1552386.40 rows=71838 width=19) (actual time=0.583..4901.063 rows=62519 loops=5)
                                       Filter: ((l_shipmode = ANY ('{MAIL,AIR}'::bpchar[])) AND (l_commitdate < l_receiptdate) AND (l_shipdate < l_commitdate) AND (l_receiptdate >= '1996-01-01'::date) AND (l_receiptdate < '1997-01-01 00:00:00'::timestamp without time zone))
                                       Rows Removed by Filter: 11934691
                                 ->  Parallel Hash  (cost=313722.45..313722.45 rows=3750045 width=20) (actual time=2011.518..2011.518 rows=3000000 loops=5)
                                       Buckets: 65536  Batches: 256  Memory Usage: 3840kB
                                       ->  Parallel Seq Scan on orders  (cost=0.00..313722.45 rows=3750045 width=20) (actual time=0.029..995.948 rows=3000000 loops=5)
 Planning Time: 0.977 ms
 Execution Time: 7923.770 ms
Query 12 from TPC-H is a good illustration for a parallel hash join. Each worker helps to build a shared hash table.
Merge Join
Due to the nature of merge join it’s not possible to make it parallel. Don’t worry if it’s the last stage of the query execution—you can still can see parallel execution for queries with a merge join.
-- Query 2 from TPC-H
explain (costs off) select s_acctbal, s_name, n_name, p_partkey, p_mfgr, s_address, s_phone, s_comment
from    part, supplier, partsupp, nation, region
where
        p_partkey = ps_partkey
        and s_suppkey = ps_suppkey
        and p_size = 36
        and p_type like '%BRASS'
        and s_nationkey = n_nationkey
        and n_regionkey = r_regionkey
        and r_name = 'AMERICA'
        and ps_supplycost = (
                select
                        min(ps_supplycost)
                from    partsupp, supplier, nation, region
                where
                        p_partkey = ps_partkey
                        and s_suppkey = ps_suppkey
                        and s_nationkey = n_nationkey
                        and n_regionkey = r_regionkey
                        and r_name = 'AMERICA'
        )
order by s_acctbal desc, n_name, s_name, p_partkey
LIMIT 100;
                                                QUERY PLAN
----------------------------------------------------------------------------------------------------------
 Limit
   ->  Sort
         Sort Key: supplier.s_acctbal DESC, nation.n_name, supplier.s_name, part.p_partkey
         ->  Merge Join
               Merge Cond: (part.p_partkey = partsupp.ps_partkey)
               Join Filter: (partsupp.ps_supplycost = (SubPlan 1))
               ->  Gather Merge
                     Workers Planned: 4
                     ->  Parallel Index Scan using part_pkey on part
                           Filter: (((p_type)::text ~~ '%BRASS'::text) AND (p_size = 36))
               ->  Materialize
                     ->  Sort
                           Sort Key: partsupp.ps_partkey
                           ->  Nested Loop
                                 ->  Nested Loop
                                       Join Filter: (nation.n_regionkey = region.r_regionkey)
                                       ->  Seq Scan on region
                                             Filter: (r_name = 'AMERICA'::bpchar)
                                       ->  Hash Join
                                             Hash Cond: (supplier.s_nationkey = nation.n_nationkey)
                                             ->  Seq Scan on supplier
                                             ->  Hash
                                                   ->  Seq Scan on nation
                                 ->  Index Scan using idx_partsupp_suppkey on partsupp
                                       Index Cond: (ps_suppkey = supplier.s_suppkey)
               SubPlan 1
                 ->  Aggregate
                       ->  Nested Loop
                             Join Filter: (nation_1.n_regionkey = region_1.r_regionkey)
                             ->  Seq Scan on region region_1
                                   Filter: (r_name = 'AMERICA'::bpchar)
                             ->  Nested Loop
                                   ->  Nested Loop
                                         ->  Index Scan using idx_partsupp_partkey on partsupp partsupp_1
                                               Index Cond: (part.p_partkey = ps_partkey)
                                         ->  Index Scan using supplier_pkey on supplier supplier_1
                                               Index Cond: (s_suppkey = partsupp_1.ps_suppkey)
                                   ->  Index Scan using nation_pkey on nation nation_1
                                         Index Cond: (n_nationkey = supplier_1.s_nationkey)
The “Merge Join” node is above “Gather Merge”. Thus merge is not using parallel execution. But the “Parallel Index Scan” node still helps with the part_pkey segment.
Partition-wise join
PostgreSQL 11 disables the partition-wise join feature by default. Partition-wise join has a high planning cost. Joins for similarly partitioned tables could be done partition-by-partition. This allows postgres to use smaller hash tables. Each per-partition join operation could be executed in parallel.
tpch=# set enable_partitionwise_join=t;
tpch=# explain (costs off) select * from prt1 t1, prt2 t2
where t1.a = t2.b and t1.b = 0 and t2.b between 0 and 10000;
                    QUERY PLAN
---------------------------------------------------
 Append
   ->  Hash Join
         Hash Cond: (t2.b = t1.a)
         ->  Seq Scan on prt2_p1 t2
               Filter: ((b >= 0) AND (b <= 10000))
         ->  Hash
               ->  Seq Scan on prt1_p1 t1
                     Filter: (b = 0)
   ->  Hash Join
         Hash Cond: (t2_1.b = t1_1.a)
         ->  Seq Scan on prt2_p2 t2_1
               Filter: ((b >= 0) AND (b <= 10000))
         ->  Hash
               ->  Seq Scan on prt1_p2 t1_1
                     Filter: (b = 0)
tpch=# set parallel_setup_cost = 1;
tpch=# set parallel_tuple_cost = 0.01;
tpch=# explain (costs off) select * from prt1 t1, prt2 t2
where t1.a = t2.b and t1.b = 0 and t2.b between 0 and 10000;
                        QUERY PLAN
-----------------------------------------------------------
 Gather
   Workers Planned: 4
   ->  Parallel Append
         ->  Parallel Hash Join
               Hash Cond: (t2_1.b = t1_1.a)
               ->  Parallel Seq Scan on prt2_p2 t2_1
                     Filter: ((b >= 0) AND (b <= 10000))
               ->  Parallel Hash
                     ->  Parallel Seq Scan on prt1_p2 t1_1
                           Filter: (b = 0)
         ->  Parallel Hash Join
               Hash Cond: (t2.b = t1.a)
               ->  Parallel Seq Scan on prt2_p1 t2
                     Filter: ((b >= 0) AND (b <= 10000))
               ->  Parallel Hash
                     ->  Parallel Seq Scan on prt1_p1 t1
                           Filter: (b = 0)
Above all, a partition-wise join can use parallel execution only if partitions are big enough.
Parallel Append
Parallel Append partitions work instead of using different blocks in different workers. Usually, you can see this with UNION ALL queries. The drawback – less parallelism, because every worker could ultimately work for a single query.
There are just two workers launched even with four workers enabled.
tpch=# explain (costs off) select sum(l_quantity) as sum_qty from lineitem where l_shipdate <= date '1998-12-01' - interval '105' day union all select sum(l_quantity) as sum_qty from lineitem where l_shipdate <= date '2000-12-01' - interval '105' day;
                                           QUERY PLAN
------------------------------------------------------------------------------------------------
 Gather
   Workers Planned: 2
   ->  Parallel Append
         ->  Aggregate
               ->  Seq Scan on lineitem
                     Filter: (l_shipdate <= '2000-08-18 00:00:00'::timestamp without time zone)
         ->  Aggregate
               ->  Seq Scan on lineitem lineitem_1
                     Filter: (l_shipdate <= '1998-08-18 00:00:00'::timestamp without time zone)
Most important variables
- WORK_MEM limits the memory usage of each process! Not just for queries: work_mem * processes * joins => could lead to significant memory usage.
- max_parallel_workers_per_gather – how many workers an executor will use for the parallel execution of a planner node
- max_worker_processes – adapt the total number of workers to the number of CPU cores installed on a server
- max_parallel_workers – same for the number of parallel workers
Summary
Starting from 9.6 parallel queries execution could significantly improve performance for complex queries scanning many rows or index records. In PostgreSQL 10, parallel execution was enabled by default. Do not forget to disable parallel execution on servers with a heavy OLTP workload. Sequential scans or index scans still consume a significant amount of resources. If you are not running a report against the whole dataset, you may improve query performance just by adding missing indexes or by using proper partitioning.
References
- https://www.postgresql.org/docs/11/how-parallel-query-works.html
- https://www.postgresql.org/docs/11/parallel-plans.html
- http://ashutoshpg.blogspot.com/2017/12/partition-wise-joins-divide-and-conquer.html
- http://rhaas.blogspot.com/2016/04/postgresql-96-with-parallel-query-vs.html
- http://amitkapila16.blogspot.com/2015/11/parallel-sequential-scans-in-play.html
- https://write-skew.blogspot.com/2018/01/parallel-hash-for-postgresql.html
- http://rhaas.blogspot.com/2017/03/parallel-query-v2.html
- https://blog.2ndquadrant.com/parallel-monster-benchmark/
- https://blog.2ndquadrant.com/parallel-aggregate/
- https://www.depesz.com/2018/02/12/waiting-for-postgresql-11-support-parallel-btree-index-builds/
- Parallelism in PostgreSQL 11
—
Image compiled from photos by Nathan Gonthier and Pavel Nekoranec on Unsplash
↧
Andrew Staller: If PostgreSQL is the fastest growing database, then why is the community so small?

The database king continues its reign. For the second year in a row, PostgreSQL is still the fastest growing DBMS.
By comparison, in 2018 MongoDB was the second fastest growing, while Oracle, MySQL, and SQL Server all shrank in popularity.

For those who stay on top of news from database land, this should come as no surprise, given the number of PostgreSQL success stories that have been published recently:
- Red Hat Satellite standardizes on PostgreSQL backend
- Lessons learned scaling PostgreSQL database to 1.2bn records per month
- The Guardian migrates entire content management cluster to PostgreSQL
- Why the European Space Agency uses PostgreSQL
- Opinions on storing application logs in Postgres
Let’s all pat ourselves on the back, shall we? Not quite yet.
The PostgreSQL community by the numbers
As the popularity of PostgreSQL grows, attendance at community events remains small. This is the case even as more and more organizations and developers embrace PostgreSQL, so from our perspective, there seems to be a discrepancy between the size of the Postgres user base and that of the Postgres community.
The two main PostgreSQL community conferences are Postgres Conference (US) and PGConf EU. Below is a graph of Postgres Conference attendance for the last 5 years, with a projection for the Postgres Conference 2019 event occurring in March.

Last year, PGConf EU had around 500 attendees, a 100% increase since 4 years ago.
Combined, that’s about 1,100 attendees for the two largest conferences within the PostgreSQL community. By comparison, Oracle OpenWorld has about 60,000 attendees. Even MongoDB World had over 2,000 attendees in 2018.
We fully recognize that attendance at Postgres community events will be a portion of the user base. We also really enjoy these events and applaud the organizers for the effort they invest in running them. And in-person events may indeed be a lagging indicator of a systems growth in popularity. Let’s just grow faster!
One relatively new gathering point for the Postgres community is the Postgres Slack channel, which already has ~4,000 members from the time it was created a couple years ago. But even our TimescaleDB Slack channel has more than half of that. (And while our community is growing quickly, even we wouldn’t claim to have over half the adoption of Postgres!)
So, how can you help grow the PostgreSQL community?
Postgres user? Get involved with the community
Wherever you are in your Postgres journey, we strongly encourage you to get involved with the Postgres community. As a start you can:
- Join the Postgres Slack channel.
- Follow and engage on Twitter @amplifypostgres and @PostgreSQL
- Find or start a Postgres User Group (PUG) or Meetup
You might also consider helping to organize a local Postgres event, which is something TimescaleDB did earlier this year for the 2019 Postgres NYC Holiday Party.
We’re engaging with PostgreSQL to help foster a more inclusive community that aims to bring together PostgreSQL developers, users, and ecosystem players new and old to grow the in-person gatherings that fuel collaboration, innovation, and help to form friendships.
So if you’re serious about your Postgres journey and want to get more involved too, come join us at PostgresConf US in New York City, which is just one month away on March 18-22, 2019.
Be sure to use TIMESCALE_ROCKS for25% off of your ticket.
[Disclaimer: We did not pick the code name. Special thanks to J.D. who did, and for helping with this post.]
If you do decide to attend, please come by and say hi, and check out the following tracks:
- TimescaleDB: Leveraging PostgreSQL for Reliability by Timescale Co-Founder and CTO Mike Freedman
- Monitoring PostgreSQL with Grafana and TimescaleDB by AWS ProServe Consultant Peter Celentano
- Gap Filling: Enabling New Analytic Capabilities in Postgres by Timescale Software Engineer Matvey Arye
- Compressing multidimensional data in PostgreSQL while providing full access via SQL by Two Six Labs Lead Research Engineer Karl Pietrzak

Interested in learning more? Follow us on Twitter or sign up below to receive more posts like this!
↧
Craig Kerstiens: Thinking in MapReduce, but with SQL
For those considering Citus, if your use case seems like a good fit, we often are willing to spend some time with you to help you get an understanding of the Citus database and what type of performance it can deliver. We commonly do this in a roughly two hour pairing session with one of our engineers. We’ll talk through the schema, load up some data, and run some queries. If we have time at the end it is always fun to load up the same data and queries into single node Postgres and see how we compare. After seeing this for years, I still enjoy seeing performance speed ups of 10 and 20x over a single node database, and in cases as high as 100x.
And the best part is it didn’t take heavy re-architecting of data pipelines. All it takes is just some data modeling, and parallelization with Citus.
The first step is sharding
We’ve talked about this before but the first key to these performance gains is that Citus splits up your data under the covers to smaller more manageable pieces. These are shards (which are standard Postgres tables) are spread across multiple physical nodes. This means that you have more collective horsepower within your system to pull from. When you’re targetting a single shard it is pretty simple: the query is re-routed to the underlying data and once it gets results it returns them.
Thinking in MapReduce
MapReduce has been around for a number of years now, and was popularized by Hadoop. The thing about large scale data is in order to get timely answers from it you need to divide up the problem and operate in parallel. Or you find an extremely fast system. The problem with getting a bigger and faster box is that data growth is outpacing hardware improvements.

MapReduce itself is a framework for splitting up data, shuffling the data to nodes as needed, and then performing the work on a subset of data before recombining for the result. Let’s take an example like counting up total pageviews. If we wanted leverage MapReduce on this we would split the pageviews into 4 separate buckets. We could do this like:
for i = 1 to 4:
  for page in pageview:
    bucket[i].append(page)
Now we would have 4 buckets each with a set of pageviews. From here we could perform a number of operations, such as searching to find the 10 most recent in each bucket, or counting up the pageviews in each bucket:
for i = 1 to 4:
  for page in bucket:
    bucket_count[i]++
Now by combining the results we have the total number of page views. If we were to farm out the work to four different nodes we could see a roughly 4x performance improvement over using all the compute of one node to perform the count.
MapReduce as a concept
MapReduce is well known within the Hadoop ecosystem, but you don’t have to jump into Java to leverage. Citus itself has multiple different executors for various workloads, our real-time executor is essentially synonomous with being a MapReduce executor.
If you have 32 shards within Citus and run SELECT count(*) we split it up and run multiple counts then aggregate the final result on the coordinator. But you can do a lot more than count (*), what about average. For average we get the sum from all the nodes and the counts. Then we add together the sums and counts and do the final math on the coordinator, or you could average together the average from each node. Effectively it is:
SELECTavg(page),dayFROMpageviews_shard_1GROUPBYday;average|date---------+----------2|1/1/20194|1/2/2019(2rows)SELECTavg(page),dayFROMpageviews_shard_2GROUPBYday;average|date---------+----------8|1/1/20192|1/2/2019(2rows)When we feed the above results into a table then average them we get:
average|date---------+----------5|1/1/20193|1/2/2019(2rows)Note within Citus you don’t actually have to run multiple queries. Under the covers our real-time executor just handles it, it really is as simple as running:
SELECTavg(page),dayFROMpageviewsGROUPBYday;average|date---------+----------5|1/1/20193|1/2/2019(2rows)For large datasets thinking in MapReduce gives you a path to get great performance without Herculean effort. And the best part may be that you don’t have to write 100s of lines to accomplish it, you can do it with the same SQL you’re used to writing. Under the covers we take care of the heavy lifting, but it is nice to know how it works under the covers.
↧
Avinash Kumar: PostgreSQL fsync Failure Fixed – Minor Versions Released Feb 14, 2019

![]() In case you didn’t already see this news, PostgreSQL has got its first minor version released for 2019. This includes minor version updates for all supported PostgreSQL versions. We have indicated in our previous blog post that PostgreSQL 9.3 had gone EOL, and it would not support any more updates. This release includes the following PostgreSQL major versions:
In case you didn’t already see this news, PostgreSQL has got its first minor version released for 2019. This includes minor version updates for all supported PostgreSQL versions. We have indicated in our previous blog post that PostgreSQL 9.3 had gone EOL, and it would not support any more updates. This release includes the following PostgreSQL major versions:
- PostgreSQL 11 (11.2)
- PostgreSQL 10 (10.7)
- PostgreSQL 9.6 (9.6.12)
- PostgreSQL 9.5 (9.5.16)
- PostgreSQL 9.4 (9.4.21)
What’s new in this release?
One of the common fixes applied to all the supported PostgreSQL versions is on – panic instead of retrying after fsync () failure. This fsync failure has been in discussion for a year or two now, so let’s take a look at the implications.
A fix to the Linux fsync issue for PostgreSQL Buffered IO in all supported versions
PostgreSQL performs two types of IO. Direct IO – though almost never – and the much more commonly performed Buffered IO.
PostgreSQL uses O_DIRECT when it is writing to WALs (Write-Ahead Logs aka Transaction Logs) only when
wal_sync_methodis set to :
open_datasyncor to
open_syncwith no archiving or streaming enabled. The default
wal_sync_methodmay be
fdatasyncthat does not use O_DIRECT. This means, almost all the time in your production database server, you’ll see PostgreSQL using O_SYNC / O_DSYNC while writing to WAL’s. Whereas, writing the modified/dirty buffers to datafiles from shared buffers is always through Buffered IO. Let’s understand this further.
Upon checkpoint, dirty buffers in shared buffers are written to the page cache managed by kernel. Through an fsync(), these modified blocks are applied to disk. If an fsync() call is successful, all dirty pages from the corresponding file are guaranteed to be persisted on the disk. When there is an fsync to flush the pages to disk, PostgreSQL cannot guarantee a copy of a modified/dirty page. The reason is that writes to storage from the page cache are completely managed by the kernel, and not by PostgreSQL.
This could still be fine if the next fsync retries flushing of the dirty page. But, in reality, the data is discarded from the page cache upon an error with fsync. And the next fsync would obviously succeed ignoring the previous errors, because it now includes the next set of dirty buffers that need to be written to disk and not the ones that failed earlier.
To understand it better, consider an example of Linux trying to write dirty pages from page cache to a USB stick that was removed during an fsync. Neither the ext4 file system nor the btrfs nor an xfs tries to retry the failed writes. A silently failing fsync may result in data loss, block corruption, table or index out of sync, foreign key or other data integrity issues… and deleted records may reappear.
Until a while ago, when we used local storage or storage using RAID Controllers with write cache, it might not have been a big problem. This issue goes back to the time when PostgreSQL was designed for buffered IO but not Direct IO. Should this now be considered an issue with PostgreSQL and the way it’s designed? Well, not exactly.
All this started with the error handling during a writeback in Linux. A writeback asynchronously performs dirty page writes from page cache to filesystem. In ext4 like filesystems, upon a writeback error, the page is marked clean and up to date, and the user space is unaware of the problem.
fsync errors are now detected
Starting from kernel 4.13, we can now reliably detect such errors during fsync. So, any open file descriptor to a file includes a pointer to the address_space structure, and a new 32-bit value (errseq_t) has been added that is visible to all the processes accessing that file. With the new minor version for all supported PostgreSQL versions, a PANIC is triggered upon such error. This performs a database crash and initiates recovery from the last CHECKPOINT. There is a patch expected to be released in PostgreSQL 12 that works for newer kernel versions and modifies the way PostgreSQL handles the file descriptors. A long term solution to this issue may be Direct IO, but you might see a different approach to this in PG 12.
A good amount of work on this issue was done by Jeff Layton on reporting writeback errors, and Matthew Wilcox. What this patch means is that a writeback error gets reported during an fsync, which can be seen by another process that opens that file. A new 32-bit value that stores an error code and a sequence number are added to a new
typedef: errseq_t. So, these errors are now in the
address_space. But, if the struct inode is gone due to a memory pressure, this patch has no value.
Can i enable or disable the PANIC on fsync failure in PostgreSQL newer releases ?
Yes. You can set this parameter :
data_sync_retryto false (default), where a PANIC-level error is raised to recover from WAL through a database crash. You must be sure to have a proper high-availability mechanism so that the impact is minimal for your application. You could let your application failover to a slave, which could minimize the impact.
You can always set
data_sync_retryto true, if you are sure about how your OS behaves during write-back failures. By setting this to true, PostgreSQL will just report an error and continue to run.
Some of the other possible issues now fixed and common to these minor releases
- A lot of features and fixes related to PARTITIONING have been applied in this minor release. (PostgreSQL 10 and 11 only).
- Autovacuum has been made more aggressive about removing leftover temporary tables.
- Deadlock when acquiring multiple buffer locks.
- Crashes in logical replication.
- Incorrect planning of queries in which a lateral reference must be evaluated at a foreign table scan.
- Fixed some issues reported with ANALYZE and TRUNCATE operations.
- Fix to contrib/hstore to calculate correct hash values for empty hstore values that were created in version 8.4 or before.
- A fix to pg_dump’s handling of materialized views with indirect dependencies on primary keys.
We always recommend that you keep your PostgreSQL databases updated to the latest minor versions. Applying a minor release might need a restart after updating the new binaries.
Here is the sequence of steps you should follow to upgrade to the latest minor versions after thorough testing :
- Shutdown the PostgreSQL database server
- Install the updated binaries
- Restart your PostgreSQL database server
Most of the time, you can choose to update the minor versions in a rolling fashion in a master-slave (replication) setup because it avoids downtime for both reads and writes simultaneously. For a rolling style update, you could perform the update on one server after another… but not all at once. However, the best method that we’d almost always recommend is – shutdown, update and restart all instances at once.
If you are currently running your databases on PostgreSQL 9.3.x or earlier, we recommend that you to prepare a plan to upgrade your PostgreSQL databases to the supported versions ASAP. Please subscribe to our blog posts so that you can hear about the various options for upgrading your PostgreSQL databases to a supported major version.
—
Photo by Andrew Rice on Unsplash
↧
↧
Bruce Momjian: The Maze of Postgres Options
I did a webcast earlier this week about the many options available to people choosing Postgres — many more options than are typically available for proprietary databases. I want to share the slides, which covers why open source has more options, how to choose a vendor that helps you be more productive, and specifically tool options for extensions, deployment, and monitoring.
↧
Paul Ramsey: Proj6 in PostGIS
Map projection is a core feature of any spatial database, taking coordinates from one coordinate system and converting them to another, and PostGIS has depended on the Proj library for coordinate reprojection support for many years.

For most of those years, the Proj library has been extremely slow moving. New projection systems might be added from time to time, and some bugs fixed, but in general it was easy to ignore. How slow was development? So slow that the version number migrated into the name, and everyone just called it “Proj4”.
No more.
Starting a couple years ago, new developers started migrating into the project, and the pace of development picked up. Proj 5 in 2018 dramatically improved the plumbing in the difficult area of geodetic transformation, and promised to begin changing the API. Only a year later, here is Proj 6, with yet more huge infrastructural improvements, and the new API.
Some of this new work was funded via the GDALBarn project, so thanks go out to those sponsors who invested in this incredibly foundational library and GDAL maintainer Even Roualt.
For PostGIS that means we have to accomodate ourselves to the new API. Doing so not only makes it easier to track future releases, but gains us access to the fancy new plumbing in Proj.

For example, Proj 6 provides:
Late-binding coordinate operation capabilities, that takes metadata such as area of use and accuracy into account… This can avoid in a number of situations the past requirement of using WGS84 as a pivot system, which could cause unneeded accuracy loss.
Or, put another way: more accurate results for reprojections that involve datum shifts.
Here’s a simple example, converting from an old NAD27/NGVD29 3D coordinate with height in feet, to a new NAD83/NAVD88 coordinate with height in metres.
SELECTST_Astext(ST_Transform(ST_SetSRID(geometry('POINT(-100 40 100)'),7406),5500));Note that the height in NGVD29 is 100 feet, if converted directly to meters, it would be 30.48 metres. The transformed point is:
POINT Z (-100.0004058 40.000005894 30.748549546)
Hey look! The elevation is slightly higher! That’s because in addition to being run through a horizontal NAD27/NAD83 grid shift, the point has also been run through a vertical shift grid as well. The result is a more correct interpretation of the old height measurement in the new vertical system.
Astute PostGIS users will have long noted that PostGIS contains three sources of truth for coordinate references systems (CRS).
Within the spatial_ref_sys table there are columns:
- The
authname,authsridthat can be used, if you have an authority database, to lookup anauthsridand get a CRS. Well, Proj 6 now ships with such a database. So there’s one source of truth. - The
srtext, a string representation of a CRS, in a standard ISO format. That’s two sources. - The
proj4text, the old Proj string for the CRS. Until Proj 6, this was the only form of definition that the Proj library could consume, and hence the only source of truth that mattered to PostGIS. Now, it’s a third source of truth.
Knowing this, when you ask PostGIS to transform to an SRID, what will it do?
- If there are non-NULL values in
authnameandauthsridask Proj to return a CRS based on those entries. - If Proj fails, and there is a non-NULL
srtextask Proj to build a CRS using that text. - If Proj still fails, and there is a non-NULL
proj4textask Proj to build a CRS using that text.
In general, the best transforms will come by having Proj look-up the CRS in its own database, because then it can apply all the power of “late binding” to ensure the best transformation for each geometry. Hence we bias in favour of Proj lookups, then the quite detailed WKT format, and finally the old Proj format.
↧
David Fetter: You don't need PL/pgsql!
You don't need PL/pgsql to create functions that do some pretty sophisticated things. Here's a function written entirely in SQL that returns the inverse cumulative distribution function known in Microsoft Excel™ circles as NORMSINV.
CREATE OR REPLACE FUNCTION normsinv(prob float8)
RETURNS float8
STRICT
LANGUAGE SQL
AS $$
WITH constants(a,b,c,d,p_low, p_high) AS (
    VALUES(
        ARRAY[-39.69683028665376::float8, 220.9460984245205, -275.9285104469687, 138.3577518672690, 30.66479806614716, 2.506628277459239],
        ARRAY[-54.47609879822406::float8, 161.5858368580409, -155.6989798598866, 66.80131188771972, -13.28068155288572],
        ARRAY[-0.007784894002430293::float8, -0.3223964580411365, -2.400758277161838, -2.549732539343734, 4.374664141464968, 2.938163982698783],
        ARRAY[0.007784695709041462::float8, 0.3224671290700398, 2.445134137142996, 3.754408661907416],
        0.02425::float8,
        1 - 0.02425::float8
    )
),
intermediate(p, q, r) AS (
    SELECT
        prob AS p,
        CASE
            WHEN prob < p_low AND prob > p_low THEN sqrt(-2*log(prob))
            WHEN prob >= p_low AND prob <= p_high THEN prob - 0.5
            WHEN prob > p_high AND prob < 1 THEN sqrt(-2*log(1-prob))
            ELSE NULL
        END AS q,
        CASE
            WHEN prob >= p_low OR prob <= p_high THEN (prob - 0.5)*(prob - 0.5)
            ELSE NULL
        END AS r
    FROM constants
)
SELECT
    CASE
        WHEN p  =  0 THEN '-Infinity'::float8
        WHEN p  =  1 THEN  'Infinity'::float8
        WHEN p  <  p_low AND p > 0 THEN
            (((((c[1]*q+c[2])*q+c[3])*q+c[4])*q+c[5])*q+c[6]) / ((((d[1]*q+d[2])*q+d[3])*q+d[4])*q+1)
        WHEN p  >= p_low AND p <= p_high THEN
            (((((a[1]*r+a[2])*r+a[3])*r+a[4])*r+a[5])*r+a[6])*q / (((((b[1]*r+b[2])*r+b[3])*r+b[4])*r+b[5])*r+1)
        WHEN p  >  p_high AND p < 1 THEN
            -1 * (((((c[1]*q+c[2])*q+c[3])*q+c[4])*q+c[5])*q+c[6]) / ((((d[1]*q+d[2])*q+d[3])*q+d[4])*q+1)
        ELSE /* p  <  0 OR p > 1 */
            (p*0)/0 /* This should cause the appropriate error */
        END
FROM
    intermediate
CROSS JOIN
    constants
$$;

COMMENT ON FUNCTION normsinv(prob float8) IS $$This implementation is taken from https://stackedboxes.org/2017/05/01/acklams-normal-quantile-function/$$;
↧
David Fetter: You don't need PL/pgsql!
You don't need PL/pgsql to create functions that do some pretty sophisticated things. Here's a function written entirely in SQL that returns the inverse cumulative distribution function known in Microsoft Excel™ circles as NORMSINV.
CREATE OR REPLACE FUNCTION normsinv(prob float8)[Edit: There were some typos and wrong functions in the previous version]
RETURNS float8
STRICT
LANGUAGE SQL
AS $$
WITH constants(a,b,c,d,p_low, p_high) AS (
VALUES(
ARRAY[-3.969683028665376e+01::float8 , 2.209460984245205e+02 , -2.759285104469687e+02 , 1.383577518672690e+02 , -3.066479806614716e+01 , 2.506628277459239e+00],
ARRAY[-5.447609879822406e+01::float8 , 1.615858368580409e+02 , -1.556989798598866e+02 , 6.680131188771972e+01 , -1.328068155288572e+01],
ARRAY[-7.784894002430293e-03::float8 , -3.223964580411365e-01 , -2.400758277161838e+00 , -2.549732539343734e+00 , 4.374664141464968e+00 , 2.938163982698783e+00],
ARRAY[7.784695709041462e-03::float8 , 3.224671290700398e-01 , 2.445134137142996e+00 , 3.754408661907416e+00],
0.02425::float8,
(1 - 0.02425)::float8
)
),
intermediate(p, q, r) AS (
SELECT
prob AS p,
CASE
WHEN prob < p_low AND prob > p_low THEN sqrt(-2*ln(prob))
WHEN prob >= p_low AND prob <= p_high THEN prob - 0.5
WHEN prob > p_high AND prob < 1 THEN sqrt(-2*ln(1-prob))
ELSE NULL
END AS q,
CASE
WHEN prob >= p_low OR prob <= p_high THEN (prob - 0.5)*(prob - 0.5)
ELSE NULL
END AS r
FROM constants
)
SELECT
CASE
WHEN p < 0 OR
p > 1 THEN 'NaN'::float8
WHEN p = 0 THEN '-Infinity'::float8
WHEN p = 1 THEN 'Infinity'::float8
WHEN p < p_low THEN
(((((c[1]*q+c[2])*q+c[3])*q+c[4])*q+c[5])*q+c[6]) /
((((d[1]*q+d[2])*q+d[3])*q+d[4])*q+1)
WHEN p >= p_low AND p <= p_high THEN
(((((a[1]*r+a[2])*r+a[3])*r+a[4])*r+a[5])*r+a[6])*q /
(((((b[1]*r+b[2])*r+b[3])*r+b[4])*r+b[5])*r+1)
WHEN p > p_high THEN
-(((((c[1]*q+c[2])*q+c[3])*q+c[4])*q+c[5])*q+c[6]) /
((((d[1]*q+d[2])*q+d[3])*q+d[4])*q+1)
ELSE /* This should never happen */
(p*0)/0 /* This should cause an error */
END
FROM
intermediate
CROSS JOIN
constants
$$;
COMMENT ON FUNCTION normsinv(prob float8) IS $$This implementation is taken from https://stackedboxes.org/2017/05/01/acklams-normal-quantile-function/$$;
↧
↧
Laurenz Albe: “Exclusive backup” method is deprecated – what now?

The “exclusive backup” method of calling pg_start_backup('label') before backup and pg_stop_backup() afterwards is scheduled for removal in the future.
This article describes the problems with the old method and discusses the options for those who still use this backup method.
The “exclusive” backup method
Before pg_basebackup was invented, there was only one online file-system level backup method:
- call “
SELECT pg_start_backup('label')”, where'label'is an arbitrary string - backup all the files in the PostgreSQL data directory with an arbitrary backup method
- call “
SELECT pg_stop_backup()”
This method is called exclusive because only one such backup can be performed simultaneously.
pg_start_backup creates the a file backup_label in the data directory that contains the location of the checkpoint starting the backup. This makes sure that during startup, PostgreSQL does not recover from the latest checkpoint registered in pg_control. Doing so would cause data corruption, since the backup may contain data files from before that checkpoint. Don’t forget that database activity, including checkpointing, continues normally in backup mode!
The problem with the exclusive backup method
This backup method can cause trouble if PostgreSQL or the operating system crash during backup mode.
When PostgreSQL starts up after such a crash, it will find the backup_label file and deduce that it is recovering a backup. There is no way to distinguish the data directory of a server crashed while in backup mode from a backup!
Consequently, PostgreSQL will try to recover from the checkpoint in backup_label. Lacking a recovery.conf file with a restore_command, it will resort to the transaction log (=WAL) files in pg_wal (pg_xlog on older versions).
But the database might have been in backup mode for a longer time before the crash. If there has been enough data modification activity in that time, the WAL segment with the starting checkpoint may already have been archived and removed.
The startup process will then fail with this error message:
ERROR:  could not find redo location referenced by checkpoint record
HINT:  If you are not restoring from a backup, try removing the file "backup_label".
You have to manually remove the backup_label file left behind from the failed backup to be able to restart PostgreSQL.
Today, in the age of automated provisioning, requiring manual intervention is even less tolerated than it used to be. So this behavior is not acceptable in many cases.
Overcoming the problem with pg_basebackup
In PostgreSQL 9.1, pg_basebackup was introduced, which provides a much simpler method to create an online file-system backup.
It introduced the “non-exclusive” backup method, meaning that several such backups can be performed at the same time. backup_label is not written to the data directory, but added only to the backup. Consequently, pg_basebackup is not vulnerable to the problem described above.
pg_basebackup makes backups simple, but since it copies all data files via a single database connection, it can take too long to backup a large database.
To deal with such databases, you still had to resort to the “low-level backup API” provided by pg_start_backup and pg_stop_backup with all its problems.
The improved “low-level backup API”
Version 9.6 brought the non-exclusive backup to pg_start_backup and pg_stop_backup.
Backups can now be performed like this:
- call “
SELECT pg_start_backup('label', FALSE, FALSE)” to start the backup and keep the database session open - backup all the files in the PostgreSQL data directory with an arbitrary backup method
- call “
SELECT * FROM pg_stop_backup(FALSE)” in in the same session where you started the backup to end backup mode
This will return the contents of thebackup_labelfile, which you have to add to the backup yourself.
Deprecation of the exclusive backup method
Since version 9.6, the documentation contains the following sentence:
The non-exclusive method is recommended and the exclusive one is deprecated and will eventually be removed.
If you are still using the exclusive backup method, DON’T PANIC.
PostgreSQL releases are supported for 5 years after their release date, and that is also the customary time for a feature to be deprecated before it is removed. So you probably have until 2021 to adjust your backup scripts if you are using the exclusive backup method.
Using a pre-backup and post-backup script
Your backup may be driven by a company-wide backup software, or maybe you use snapshots on the storage subsystem to backup a large database.
In both cases, it is not unusual that the backup software offers to run a “pre-backup” and a “post-backup” command on the target machine. The pre-backup script prepares the machine for being backed up, and the post-backup script resumes normal operation.
In such a situation it is difficult to switch from exclusive backup to non-exclusive backup: You cannot easily keep the database session where you ran pg_start_backup open, because the backup will only start once the pre-backup script has ended. But you need to keep that session open, so that you can run pg_stop_backup in the same session to complete the backup!
People with such a backup scenario will probably find it hardest to move away from the exclusive backup method.
Pre-backup and post-backup scripts for non-exclusive backups
To overcome this problem, I have written pre- and post-backup scripts that use non-exclusive backups. They are available here.
They work by creating a table in the database postgres and a “co-process” that stays around when the pre-backup script is done. The post-backup script notifies the co-process to complete the backup and write the contents of the backup_label file to the database table. You can get that information either from the standard output of the post-backup script or from the database table.
There is one last thing you have to do: you have to store the backup_label file with the checkpoint information along with the backup. The file must be present after the backup has been restored. Remember that if you start PostgreSQL on a restored data directory without the correct backup_label file, the result will be data corruption. This is because the pg_control file in the backup usually contains a later checkpoint than the one taken during pg_start_backup.
The post “Exclusive backup” method is deprecated – what now? appeared first on Cybertec.
↧
Jonathan Katz: PostgreSQL BRIN Indexes: Big Data Performance With Minimal Storage
Many applications today record data from sensors, devices, tracking information, and other things that share a common attribute: a timestamp that is always increasing. This timestamp is very valuable, as it serves as the basis for types of lookups, analytical queries, and more.

↧
Peter Bengtsson: Django ORM optimization story on selecting the least possible
This an optimization story that should not surprise anyone using the Django ORM. But I thought I'd share because I have numbers now! The origin of this came from a real requirement. For a given parent model, I'd like to extract the value of the name column of all its child models, and the turn all these name strings into 1 MD5 checksum string.
Variants
The first attempted looked like this:
artist=Artist.objects.get(name="Bad Religion")names=[]forsonginSong.objects.filter(artist=artist):names.append(song.name)returnhashlib.md5("".join(names).encode("utf-8")).hexdigest()The SQL used to generate this is as follows:
SELECT"main_song"."id","main_song"."artist_id","main_song"."name","main_song"."text","main_song"."language","main_song"."key_phrases","main_song"."popularity","main_song"."text_length","main_song"."metadata","main_song"."created","main_song"."modified","main_song"."has_lastfm_listeners","main_song"."has_spotify_popularity"FROM"main_song"WHERE"main_song"."artist_id"=22729;Clearly, I don't need anything but just the name column, version 2:
artist=Artist.objects.get(name="Bad Religion")names=[]forsonginSong.objects.filter(artist=artist).only("name"):names.append(song.name)returnhashlib.md5("".join(names).encode("utf-8")).hexdigest()Now, the SQL used is:
SELECT"main_song"."id","main_song"."name"FROM"main_song"WHERE"main_song"."artist_id"=22729;But still, since I don't really need instances of model class Song I can use the .values() method which gives back a list of dictionaries. This is version 3:
names=[]forsonginSong.objects.filter(artist=a).values("name"):names.append(song["name"])returnhashlib.md5("".join(names).encode("utf-8")).hexdigest()This time Django figures it doesn't even need the primary key value so it looks like this:
SELECT"main_song"."name"FROM"main_song"WHERE"main_song"."artist_id"=22729;Last but not least; there is an even faster one. values_list(). This time it doesn't even bother to map the column name to the value in a dictionary. And since I only need 1 column's value, I can set flat=True. Version 4 looks like this:
names=[]fornameinSong.objects.filter(artist=a).values_list("name",flat=True):names.append(name)returnhashlib.md5("".join(names).encode("utf-8")).hexdigest()Same SQL gets used this time as in version 3.
The benchmark
Hopefully this little benchmark script speaks for itself:
fromsongsearch.main.modelsimport*importhashlibdeff1(a):names=[]forsonginSong.objects.filter(artist=a):names.append(song.name)returnhashlib.md5("".join(names).encode("utf-8")).hexdigest()deff2(a):names=[]forsonginSong.objects.filter(artist=a).only("name"):names.append(song.name)returnhashlib.md5("".join(names).encode("utf-8")).hexdigest()deff3(a):names=[]forsonginSong.objects.filter(artist=a).values("name"):names.append(song["name"])returnhashlib.md5("".join(names).encode("utf-8")).hexdigest()deff4(a):names=[]fornameinSong.objects.filter(artist=a).values_list("name",flat=True):names.append(name)returnhashlib.md5("".join(names).encode("utf-8")).hexdigest()artist=Artist.objects.get(name="Bad Religion")print(Song.objects.filter(artist=artist).count())print(f1(artist)==f2(artist))print(f2(artist)==f3(artist))print(f3(artist)==f4(artist))# Reportingimporttimeimportrandomimportstatisticsfunctions=f1,f2,f3,f4times={f.__name__:[]forfinfunctions}foriinrange(500):func=random.choice(functions)t0=time.time()func(artist)t1=time.time()times[func.__name__].append((t1-t0)*1000)fornameinsorted(times):numbers=times[name]print("FUNCTION:",name,"Used",len(numbers),"times")print("\tBEST",min(numbers))print("\tMEDIAN",statistics.median(numbers))print("\tMEAN ",statistics.mean(numbers))print("\tSTDEV ",statistics.stdev(numbers))I ran this on my PostgreSQL 11.1 on my MacBook Pro with Django 2.1.7. So the database is on localhost.
The results
276
True
True
True
FUNCTION: f1 Used 135 times
    BEST 6.309986114501953
    MEDIAN 7.531881332397461
    MEAN   7.834429211086697
    STDEV  2.03779968066591
FUNCTION: f2 Used 135 times
    BEST 3.039121627807617
    MEDIAN 3.7298202514648438
    MEAN   4.012803678159361
    STDEV  1.8498943539073027
FUNCTION: f3 Used 110 times
    BEST 0.9920597076416016
    MEDIAN 1.4405250549316406
    MEAN   1.5053835782137783
    STDEV  0.3523240470133114
FUNCTION: f4 Used 120 times
    BEST 0.9369850158691406
    MEDIAN 1.3251304626464844
    MEAN   1.4017681280771892
    STDEV  0.3391019435930447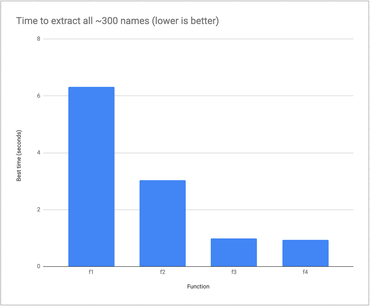
Discussion
I guess the hashlib.md5("".join(names).encode("utf-8")).hexdigest() stuff is a bit "off-topic" but I checked and it's roughly 300 times faster than building up the names list.
It's clearly better to ask less of Python and PostgreSQL to get a better total time. No surprise there. What was interesting was the proportion of these differences. Memorize that and you'll be better equipped if it's worth the hassle of not using the Django ORM in the most basic form.
Also, do take note that this is only relevant in when dealing with many records. The slowest variant (f1) takes, on average, 7 milliseconds.
Summarizing the difference with percentages compared to the fastest variant:
f1- 573% slowerf2- 225% slowerf3- 6% slowerf4- 0% slower
UPDATE Feb 25 2019
James suggested, although a bit "missing the point", that it could be even faster if all the aggregation is pushed into the PostgreSQL server and then the only thing that needs to transfer from PostgreSQL to Python is the final result.
By the way, name column in this particular benchmark, when concatenated into one big string, is ~4KB. So, with variant f5 it only needs to transfer 32 bytes which will/would make a bigger difference if the network latency is higher.
Here's the whole script: https://gist.github.com/peterbe/b2b7ed95d422ab25a65639cb8412e75e
And the results:
276
True
True
True
False
False
FUNCTION: f1 Used 92 times
    BEST 5.928993225097656
    MEDIAN 7.311463356018066
    MEAN   7.594626882801885
    STDEV  2.2027017044658423
FUNCTION: f2 Used 75 times
    BEST 2.878904342651367
    MEDIAN 3.3979415893554688
    MEAN   3.4774907430013022
    STDEV  0.5120246550765524
FUNCTION: f3 Used 88 times
    BEST 0.9310245513916016
    MEDIAN 1.1944770812988281
    MEAN   1.3105544176968662
    STDEV  0.35922655625999383
FUNCTION: f4 Used 71 times
    BEST 0.7879734039306641
    MEDIAN 1.1661052703857422
    MEAN   1.2262606284987758
    STDEV  0.3561764250427344
FUNCTION: f5 Used 90 times
    BEST 0.7929801940917969
    MEDIAN 1.0334253311157227
    MEAN   1.1836051940917969
    STDEV  0.4001442703048186
FUNCTION: f6 Used 84 times
    BEST 0.80108642578125
    MEDIAN 1.1119842529296875
    MEAN   1.2281338373819988
    STDEV  0.37146893005516973
Result: f5 is takes 0.793ms and (the previous "winner") f4 takes 0.788ms.
I'm not entirely sure why f5 isn't faster but I suspect it's because the dataset is too small for it all to matter.
Compare:
songsearch=# explain analyze SELECT "main_song"."name" FROM "main_song" WHERE "main_song"."artist_id" = 22729;
                                                             QUERY PLAN
------------------------------------------------------------------------------------------------------------------------------------
 Index Scan using main_song_ca949605 on main_song  (cost=0.43..229.33 rows=56 width=16) (actual time=0.014..0.208 rows=276 loops=1)
   Index Cond: (artist_id = 22729)
 Planning Time: 0.113 ms
 Execution Time: 0.242 ms
(4 rows)
with...
songsearch=# explain analyze SELECT md5(STRING_AGG("main_song"."name", '')) AS "names_hash" FROM "main_song" WHERE "main_song"."artist_id" = 22729;
                                                                QUERY PLAN
------------------------------------------------------------------------------------------------------------------------------------------
 Aggregate  (cost=229.47..229.48 rows=1 width=32) (actual time=0.278..0.278 rows=1 loops=1)
   ->  Index Scan using main_song_ca949605 on main_song  (cost=0.43..229.33 rows=56 width=16) (actual time=0.019..0.204 rows=276 loops=1)
         Index Cond: (artist_id = 22729)
 Planning Time: 0.115 ms
 Execution Time: 0.315 ms
(5 rows)
I ran these two SQL statements about 100 times each and recorded their best possible execution times:
1) The plain SELECT - 0.99ms
2) The STRING_AGG - 1.06ms
So that accounts from ~0.1ms difference only! Which kinda matches the results seen above. All in all, I think the dataset is too small to demonstrate this technique. But, considering the chance that the complexity might not be linear with the performance benefit, it's still interesting.
Even though this tangent is a big off-topic, it is often a great idea to push as much work into the database as you can if applicable. Especially if it means you can transfer a lot less data eventually.
↧


