
At the recent Percona Live, Agustín Gallego and I did a presentation “Optimizing and Troubleshooting PostgreSQL with PMM“. While preparing for this talk, I’ve ported some of the older PostgreSQL custom dashboards that we published over the years over at grafana.com. Initially made for Percona Monitoring and Management (PMM) 1, they are now capable of being added to PMM 2 easily. In this short blog post, I will show you how to set up two of these dashboards on PMM 2: “PostgreSQL Tuple Statistics” and “PostgreSQL DB/Table Size Details”. Technically, the DB/Table Size one is for PMM 2, but there’s an easier way to set it up in recent PMM versions.
You can also check out the original blog post covering the installation of the Tuple Statistics dashboard for PMM 1: “Adding PostgreSQL Tuple Statistics Dashboard to the PMM Plugin“.
Disclaimer About PMM Versions
PostgreSQL support is continuously improving in PMM, and the engineering team is busy with QAN and exporter improvements. In PMM release 2.16.0, postgres_exporter was updated to the community version 0.8.0, which among other things significantly improves the way custom queries are executed. In this post, I assume that you’re using PMM version 2.16.0 or above. If you’re using an older version of PMM 2, you will have to use the dblink approach proposed in the original blog post. Note that some parts of the new dashboards may not work properly with the older PMM versions.
PostgreSQL Custom Dashboards Overview
The two dashboards that were ported are “PostgreSQL Tuple Statistics” and “PostgreSQL DB/Table Size Details“, both adding important missing pieces of information to PMM. They were initially implemented by Vadim Yalovets.
“PostgreSQL Tuple Statistics”, in addition to the breakdown of tuple operations, provides an overview of the dead/live tuples ratio and details on the history of vacuum executions. New addition with this port to PMM2 is that the dashboard now gives some insight into database age and current progress towards the “vacuum to prevent wraparound.” Having a view of operations happening on a per-table basis can highlight the hottest objects in the databases, and the vacuum details are a welcome addition to any monitoring system that works with PostgreSQL.
The “PostgreSQL DB/Table Size Details” dashboard is somewhat simpler and narrower in its scope. This dashboard gives an overview of database and table sizes and their rate of growth. Helpful when you want to understand where all the disk space went.
Setting up Custom Queries
Once you have set up the PMM client to monitor your PostgreSQL instance, you will find three directories where you can put custom queries:
# cd /usr/local/percona/pmm2/collectors/custom-queries/postgresql/
# ls -l
drwxr-xr-x. 2 pmm-agent pmm-agent  69 Jul 12 21:16 high-resolution
drwxr-xr-x. 2 pmm-agent pmm-agent 126 Jul 12 21:24 low-resolution
drwxr-xr-x. 2 pmm-agent pmm-agent  34 Jul 12 21:16 medium-resolution
Technical details can be found in the “Running Custom MySQL Queries in Percona Monitoring and Management” blog post. However, all you need to do is to create two files. Download or otherwise copy the following files to the low-resolution directory:
- https://raw.githubusercontent.com/Percona-Lab/pmm-custom-queries/master/postgresql/pg_tuple_statistics.yaml
- https://raw.githubusercontent.com/Percona-Lab/pmm-custom-queries/master/postgresql/pg_table_size-details.yaml
Once that’s done, restart the pmm-agent or kill the postgres_exporter process:
# systemctl restart pmm-agent
I recommend using the low resolution for these particular queries as, frankly, it doesn’t make a lot of sense to be checking database size and number of updates every 1 or 5 seconds.
Importing the Dashboards
Once the custom queries are prepared and the exporter is restarted, you can go ahead and import new dashboards in Grafana! See the official documentation on how to do that: Dashboards/Export and import.
You can pick up the dashboards on grafana.com: “PostgreSQL Tuple Statistics (Designed for PMM2)“, “PostgreSQL DB/Table Size Details (Designed for PMM2)“, or find raw sources over at my GitHub.
If everything worked as expected, you should see your new dashboards showing the data:

PostgreSQL Tuple Details pt1
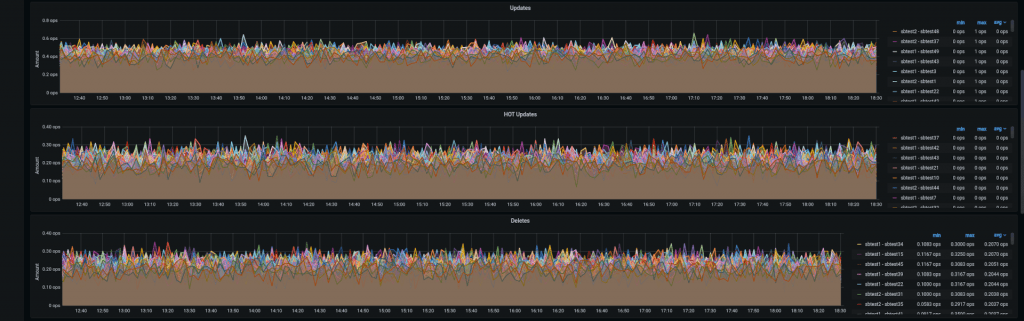
PostgreSQL Tuple Details pt2

PostgreSQL Tuple Details pt3

PostgreSQL DB/Table Size Details
Enjoy monitoring with these PostgreSQL custom dashboards!