Quantcast
Channel: Planet PostgreSQL
Viewing all articles
Browse latest Browse all 9977

Ryan Lambert: Find missing OpenStreetMap data with PostGIS

$
0
0

The #30DayMapChallenge is going on again this November. Each day of the month has a different theme for that day's map challenge. These challenges do not have a requirement for technology, so naturally I am using OpenStreetMap data stored in PostGIS with QGIS for the visualization component.

The challenge for Day 5 was an OpenStreetMap data challenge. 
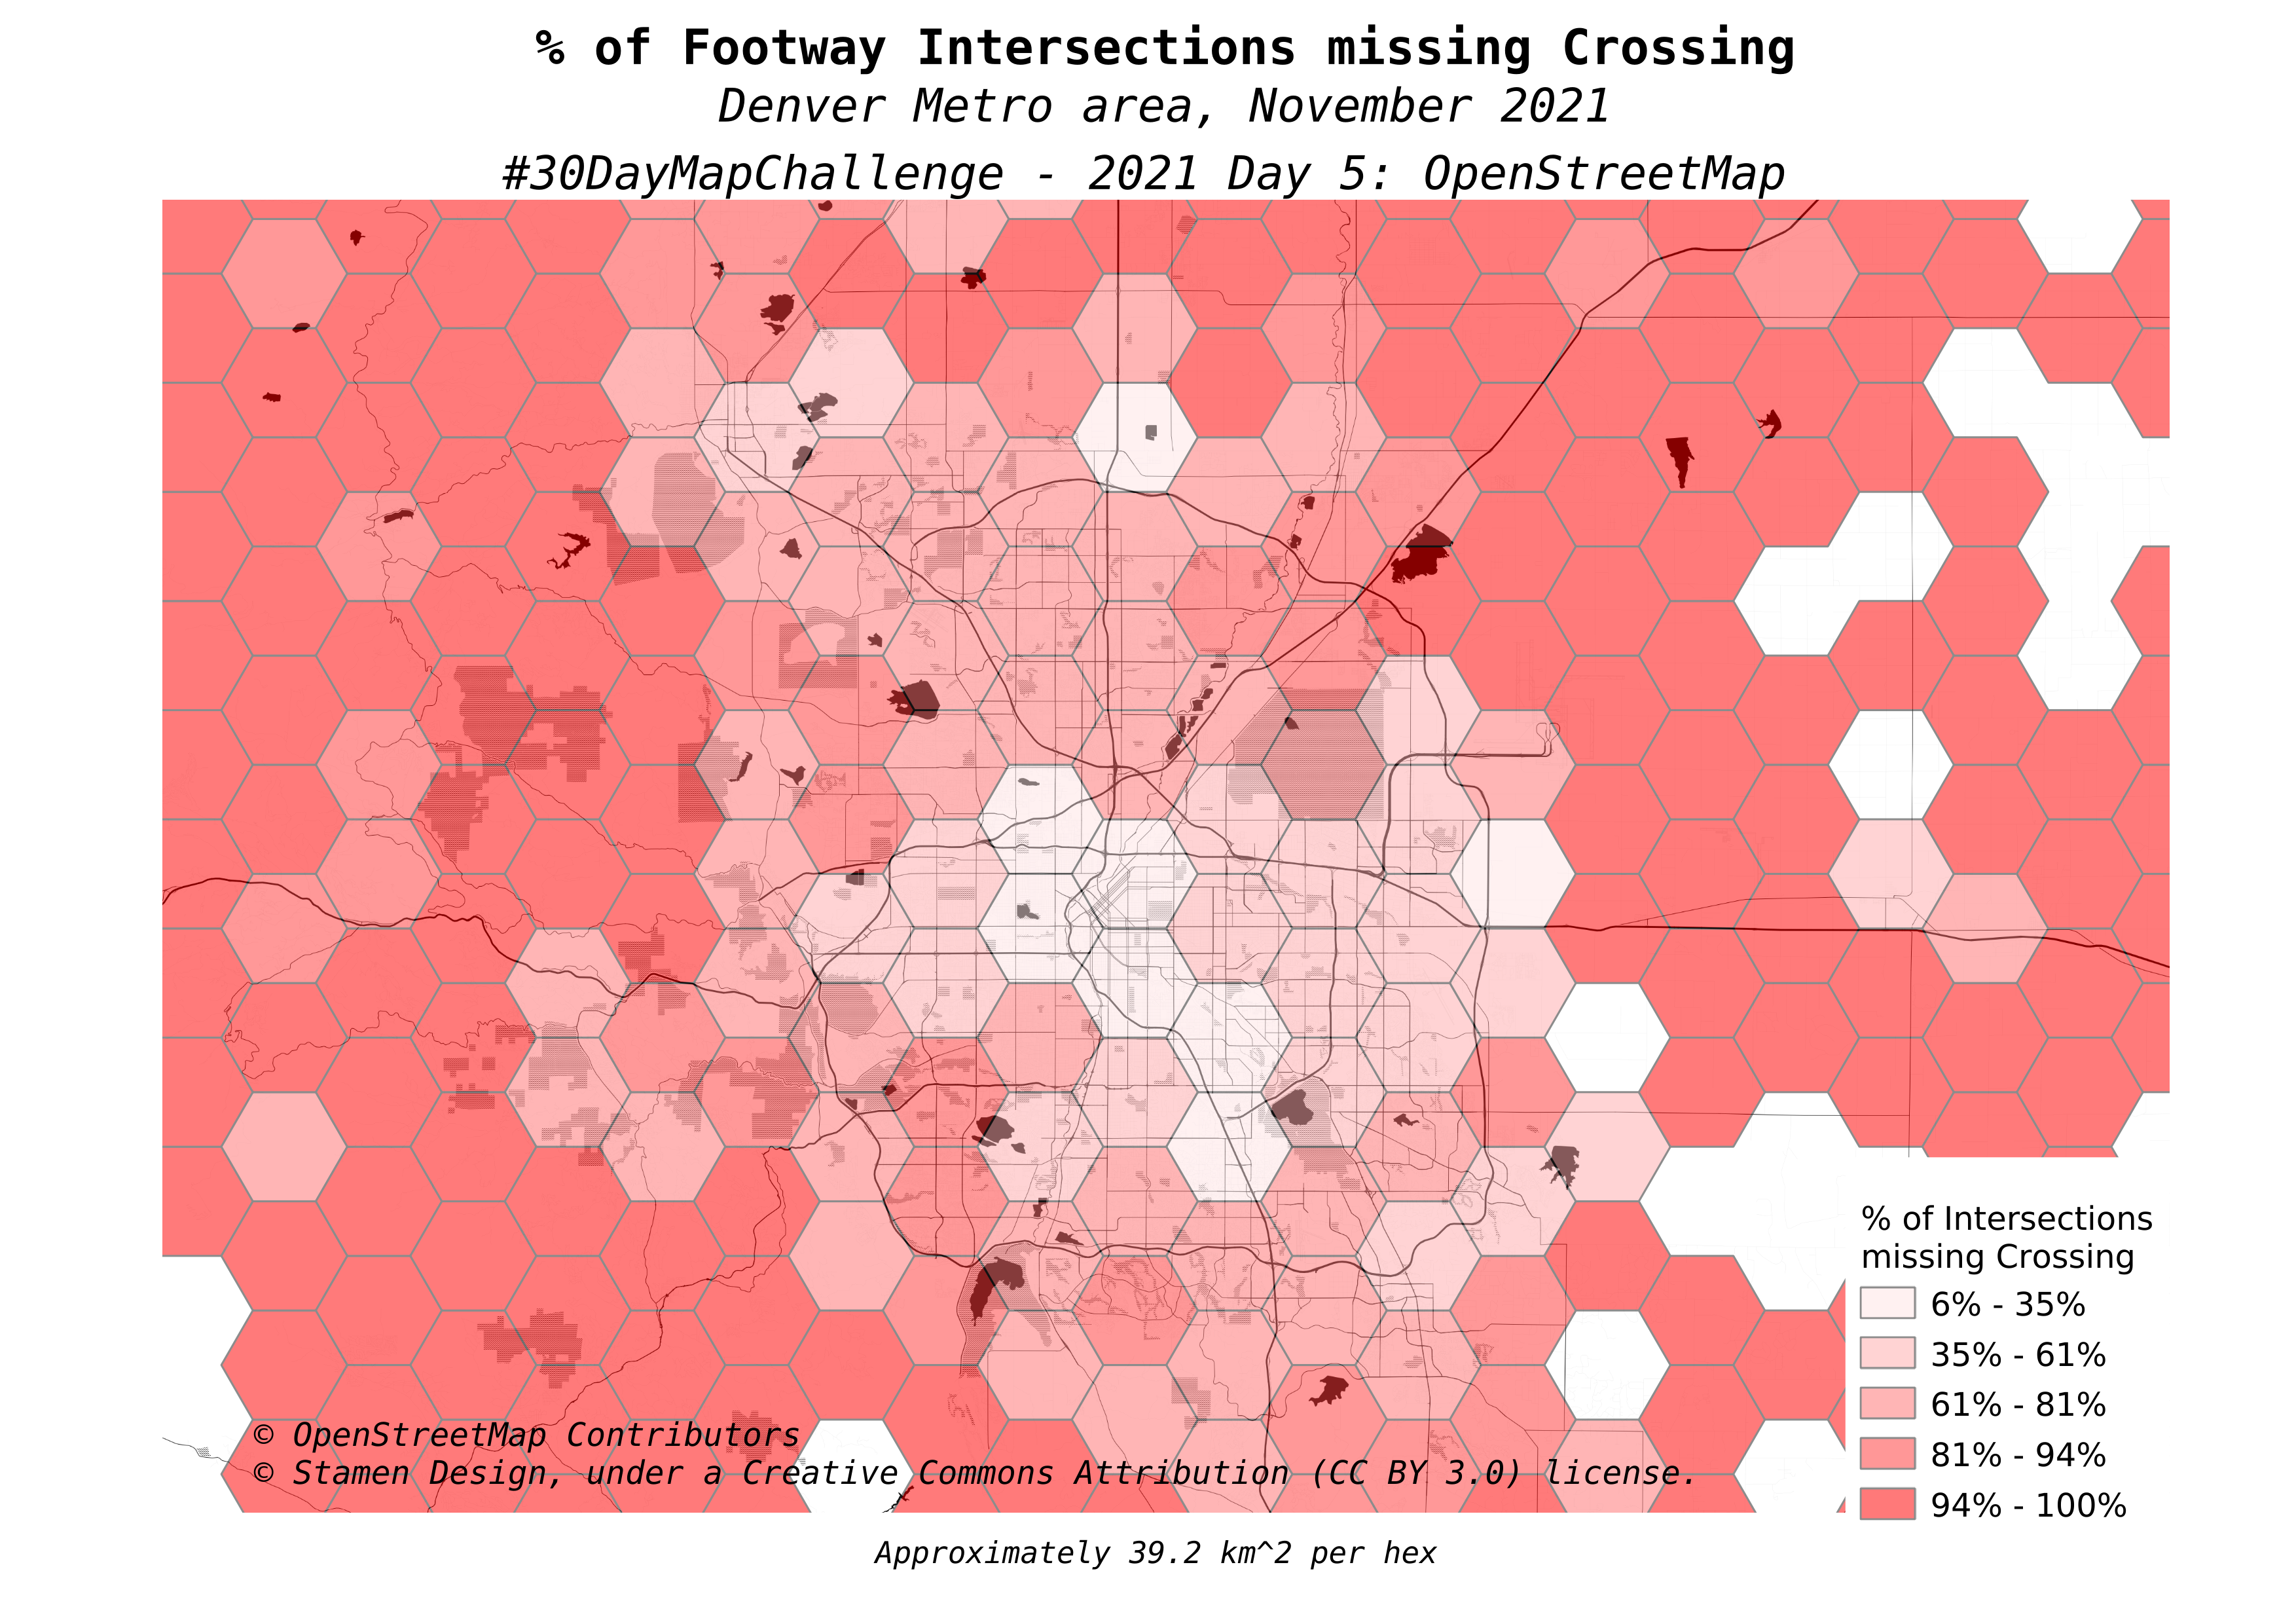
I decided to find and visualize missing crossing tags. Crossing tags are added to the node (point) where a pedestrian highway (e.g. highway=footway) intersects a motorized highway (e.g. highway=tertiary). This post explains how I used PostGIS and OpenStreetMap data to find intersections missing a dedicated crossing tag.

Without further ado, here was my submission for Day 5.

Map of the Denver, Colorado metro area with a shaded hex grid overlay. Title reads "% of Footway Intersections missing Crossing".  Subtitles read "Denver Metro area, November 2021" and "#30DayMapChallenge - 2021 Day 5: OpenStreetMap". The hex grid is shaded from light red to dark red (5 gradients), with only 4 of the lightest shaded areas around Denver proper.  Throughout the rest of the inner-metro area are shades 2-4 (35% through 94% missing) with most of the outer regions in the 100% or "no data" area.


Viewing all articles
Browse latest Browse all 9977

Trending Articles


<script src="https://jsc.adskeeper.com/r/s/rssing.com.1596347.js" async> </script>