Table of Contents Introduction SQL features TABLESAMPLE (9.5) GROUPING SETS (9.5) Foreign table inheritance (9.5) Parallelism Sequential Scan (9.6) Index Scan (10) Joins (9.6, 10, 11) Aggregation (9.6) Union of sets (11) Access methods BRIN Indexes (9.5) BLOOM filters (9.6) Partitioning Forms of partitioning (10, 11) Indexes (11) Partition exclusion (11) Joins and aggregates (11) Internal improvements Hashing functions (10) Executor improvements (10) Sorts improvements Abbreviated keys (9.
↧
Adrien Nayrat: PostgreSQL's developments for high volumes processing
↧
Dimitri Fontaine: PostgreSQL Data Types: Network Addresses
Continuing our series of PostgreSQL Data Types today we’re going to introduce network address types.
PostgreSQL includes support for both cidr, inet, and macaddr data types. Again, those types are bundled with indexing support and advanced functions and operator support.
↧
↧
Viorel Tabara: Top Backup Tools for PostgreSQL

PostgreSQL has the reputation of being rock solid from its beginnings, and over the years has accumulated a set of impressive features. However the peace of mind that your on-disk data is ACID compliant — if not complemented by an equivalent well thought backup strategy — can be easily shattered.
Backup Types
Before diving into the available tools, let’s look at the available PostgreSQL backup types and what their characteristics are:
SQL dumps (or logical)
- Does not block readers or writers.
- Geared towards small sets of data because of the negative impact on system load and the long time required for both backup and restore operations. The performance may be increased with the –no-sync flag, but refer to the man page for the risks associated with disabling the wait for writes.
- A post-restore ANALYZE is required in order to optimize the statistics.
- Global objects such as roles and tablespaces can only be backed up using pg_dumpall utility. Note that tablespace directories must be manually created prior to starting the restore.
- Supports parallelism at the expense of increased system load. Read man pg_dump for its caveats and special requirements e.g. synchronized snapshots.
- Dumps can be loaded in newer versions of PostgreSQL, or even another machine architecture, however they are not guaranteed to be backwards compatible between major versions so some manual editing of the dump file may be required.
Filesystem (or physical)
- Requires the database to be shut down.
- Faster than logical backups.
- Includes cluster data.
- Can only be restored on the same major version of PostgreSQL.
Continuous archiving (or Point In Time Recovery or PITR)
- Suitable for very large databases where logical or physical backups would take too long.
- Some directories inside the data directory can be excluded to speed up the process.
Snapshots
- Requires operating system support — for example LVM works quite well which is also confirmed by NetBackup for PostgreSQL Agent.
- Suitable for applications where both data directory and the database must be in sync e.g. LAMP applications, provided that the two snapshots are synchronized.
- Not recommended when the database files are stored across multiple filesystems (must snapshot all filesystems simultaneously).
Cloud
All cloud providers implement backups in their PostgreSQL offering. Logical backups can be performed as usual, while physical backups and PITR are available through the cloud service offerings since access to the data store is not available (see for example Amazon Aurora for PostgreSQL). Therefore, backing up PostgreSQL in the cloud will need to be a topic for another blog.
Agent base
- Requires an agent installed on targets.
- Can do block-level backups e.g. COMMVAULT (installation supported on Windows only).
Features
While PostgreSQL provides out of the box the tools required to perform logical, physical, and PITR backups, specialized backup applications rely on the native PostgreSQL and operating system tools to fill the need of implementing a backup strategy that addresses the following points:
- automation
- frequency
- retention period
- integrity
- ease of use
Additionally, PostgreSQL backup tools attempt to provide features common to generic backup tools such as:
- incremental backups for saving storage space
- backup catalogs
- ability to store backups on premise or in the cloud
- alerting and notification
- comprehensive reporting
- access control
- encryption
- graphical interface and dashboards
- backups of remote hosts
- adaptive throughput in order to minimize load on the targets
- handling multiple hosts in parallel
- backup orchestration e.g. jobs chaining
- REST APIs
Lab Setup
For this exercise I’ve setup a command-and-control host that where I’ll be installing the backup tools, that also runs two PostgreSQL instances — 9.6 and 10 — installed from PGDG repositories:
[root@cc ~]# ps -o user,pid,ppid,args --forest -U postgres
USER       PID  PPID COMMAND
postgres  4535     1 /usr/pgsql-10/bin/postmaster -D /var/lib/pgsql/10/data/
postgres  4538  4535  \_ postgres: logger process
postgres  4540  4535  \_ postgres: checkpointer process
postgres  4541  4535  \_ postgres: writer process
postgres  4542  4535  \_ postgres: wal writer process
postgres  4543  4535  \_ postgres: autovacuum launcher process
postgres  4544  4535  \_ postgres: stats collector process
postgres  4545  4535  \_ postgres: bgworker: logical replication launcher
postgres  4481     1 /usr/pgsql-9.6/bin/postmaster -D /var/lib/pgsql/9.6/data/
postgres  4483  4481  \_ postgres: logger process
postgres  4485  4481  \_ postgres: checkpointer process
postgres  4486  4481  \_ postgres: writer process
postgres  4487  4481  \_ postgres: wal writer process
postgres  4488  4481  \_ postgres: autovacuum launcher process
postgres  4489  4481  \_ postgres: stats collector process

[root@cc ~]# netstat -npeelt | grep :543
tcp   0  0  127.0.0.1:5432  0.0.0.0:*  LISTEN  26  79972  4481/postmaster
tcp   0  0  127.0.0.1:5433  0.0.0.0:*  LISTEN  26  81801  4535/postmaster
tcp6  0  0  ::1:5432        :::*       LISTEN  26  79971  4481/postmaster
tcp6  0  0  ::1:5433        :::*       LISTEN  26  81800  4535/postmaster
I’ve also setup two remote PostgreSQL instances running the same versions 9.6 and respectively 10:
[root@db-1 ~]# ps -o user,pid,ppid,args --forest -U postgres
USER       PID  PPID COMMAND
postgres 10972     1 /usr/pgsql-9.6/bin/postmaster -D /var/lib/pgsql/9.6/data/
postgres 10975 10972  \_ postgres: logger process
postgres 10977 10972  \_ postgres: checkpointer process
postgres 10978 10972  \_ postgres: writer process
postgres 10979 10972  \_ postgres: wal writer process
postgres 10980 10972  \_ postgres: autovacuum launcher process
postgres 10981 10972  \_ postgres: stats collector process

[root@db-1 ~]# netstat -npeelt | grep :5432
tcp   0  0  0.0.0.0:5432  0.0.0.0:*  LISTEN  26  34864  10972/postmaster
tcp6  0  0  :::5432       :::*       LISTEN  26  34865  10972/postmaster


[root@db-2 ~]# ps -o user,pid,ppid,args --forest -U postgres
USER       PID  PPID COMMAND
postgres 10829     1 /usr/pgsql-10/bin/postmaster -D /var/lib/pgsql/10/data/
postgres 10831 10829  \_ postgres: logger process
postgres 10833 10829  \_ postgres: checkpointer process
postgres 10834 10829  \_ postgres: writer process
postgres 10835 10829  \_ postgres: wal writer process
postgres 10836 10829  \_ postgres: autovacuum launcher process
postgres 10837 10829  \_ postgres: stats collector process
postgres 10838 10829  \_ postgres: bgworker: logical replication launcher

[root@db-2 ~]# netstat -npeelt | grep :5432
tcp   0  0  0.0.0.0:5432  0.0.0.0:*  LISTEN  26  34242  10829/postmaster
tcp6  0  0  :::5432       :::*       LISTEN  26  34243  10829/postmaster
Next, use pgbench to create a data set:
pgbench=# \dt+
                          List of relations
 Schema |       Name       | Type  |  Owner   |  Size   | Description
--------+------------------+-------+----------+---------+-------------
 public | pgbench_accounts | table | postgres | 128 MB  |
 public | pgbench_branches | table | postgres | 40 kB   |
 public | pgbench_history  | table | postgres | 0 bytes |
 public | pgbench_tellers  | table | postgres | 40 kB   |
(4 rows)
Tools
A list of common backup tools can be found in the PostgreSQL Wiki — Backup section. I’ve augmented the list with products I’ve come across over the years and from a recent Internet search.
Amanda
Amanda is agent based, open source, and supports PostgreSQL out of the box via the ampgsql API. As of this writing, the version 3.5.1 does not support tablespaces (see man ampgsql).
Zmanda provides an enterprise version which is also open source, however not directly available for download as a trial.
Amanda requires a dedicated backup host as the server and client packages exclude each other:
[root@cc ~]# rpm -qp --conflicts ./amanda-backup_client-3.5.1-1.rhel7.x86_64.rpm
amanda-backup_server
[root@cc ~]# rpm -qp --conflicts ./amanda-backup_server-3.5.1-1.rhel7.x86_64.rpm
amanda-backup_client
Follow the basic configuration guide to setup the server and client then configure the PostgreSQL API.
Here’s a git diff from my lab:
Server:
increase the server backup space:
--- a/etc/amanda/omiday/amanda.conf
				+++ b/etc/amanda/omiday/amanda.conf
				@@ -13,7 +13,7 @@ amrecover_changer "changer"

				tapetype "TEST-TAPE"
				define tapetype TEST-TAPE {
				1.  length 100 mbytes
				2.  length 500 mbytes
					filemark 4 kbytes
				}
define the PostgreSQL target (and disable sample backup):
--- a/etc/amanda/omiday/disklist
+++ b/etc/amanda/omiday/disklist
@@ -1,3 +1,2 @@
-localhost /etc simple-gnutar-local
+#localhost /etc simple-gnutar-local
+10.1.9.243 /var/lib/pgsql/9.6/data dt_ampgsql
Client:
config:
--- /dev/null
+++ b/etc/amanda/omiday/amanda-client.conf
@@ -0,0 +1,5 @@
+property "PG-DATADIR" "/var/lib/pgsql/9.6/data"
+property "PG-ARCHIVEDIR" "/var/lib/pgsql/9.6/archive"
+property "PG-HOST" "/tmp"
+property "PG-USER" "amandabackup"
+property "PG-PASSFILE" "/etc/amanda/pg_passfile"
authentication file:
--- /dev/null
+++ b/etc/amanda/pg_passfile
@@ -0,0 +1 @@
+/tmp:*:*:amandabackup:pass
authorize the server:
--- a/var/lib/amanda/.amandahosts
+++ b/var/lib/amanda/.amandahosts
@@ -1,2 +1,3 @@
localhost amandabackup amdump
localhost.localdomain amandabackup amdump
+10.1.9.231 amandabackup amdump
PostgreSQL authentication:
--- a/var/lib/pgsql/9.6/data/pg_hba.conf
+++ b/var/lib/pgsql/9.6/data/pg_hba.conf
@@ -79,7 +79,8 @@
# "local" is for Unix domain socket connections only
local   all             all                                     trust
# IPv4 local connections:
-host    all             all             127.0.0.1/32            ident
+host    all             all             127.0.0.1/32            trust
+host    all             amandabackup    10.1.9.243/32           trust
# IPv6 local connections:
host    all             all             ::1/128                 ident
# Allow replication connections from localhost, by a user with the
PostgreSQL config:
--- a/var/lib/pgsql/9.6/data/postgresql.conf
+++ b/var/lib/pgsql/9.6/data/postgresql.conf
@@ -178,6 +178,7 @@ dynamic_shared_memory_type = posix  # the default is the first option

#wal_level = minimal                   # minimal, replica, or logical
                                       # (change requires restart)
+wal_level = replica
#fsync = on                            # flush data to disk for crash safety
                                                # (turning this off can cause
                                                # unrecoverable data corruption)
@@ -215,10 +216,12 @@ dynamic_shared_memory_type = posix        # the default is the first option

#archive_mode = off            # enables archiving; off, on, or always
                              # (change requires restart)
+archive_mode = on
#archive_command = ''          # command to use to archive a logfile segment
                              # placeholders: %p = path of file to archive
                              #               %f = file name only
                              # e.g. 'test ! -f /mnt/server/archivedir/%f && cp %p /mnt/server/archivedir/%f'
+archive_command = 'test ! -f /var/lib/pgsql/9.6/archive/%f && cp %p /var/lib/pgsql/9.6/archive/%f'
#archive_timeout = 0           # force a logfile segment switch after this
                              # number of seconds; 0 disables
Once completed the above configuration, run the backup:
[amandabackup@cc ~]$ amdump omidayAnd verify:
[amandabackup@cc ~]$ amreport omiday
Hostname: cc
Org     : omiday
Config  : omiday
Date    : April 14, 2018

These dumps were to tape MyData01.
The next tape Amanda expects to use is: MyData02.


STATISTICS:
                        Total       Full      Incr.   Level:#
                        --------   --------   --------  --------
Estimate Time (hrs:min)     0:00
Run Time (hrs:min)          0:00
Dump Time (hrs:min)         0:00       0:00       0:00
Output Size (meg)            0.1        0.0        0.1
Original Size (meg)         16.0        0.0       16.0
Avg Compressed Size (%)      0.5        --         0.5
DLEs Dumped                    1          0          1  1:1
Avg Dump Rate (k/s)         33.7        --        33.7

Tape Time (hrs:min)         0:00       0:00       0:00
Tape Size (meg)              0.1        0.0        0.1
Tape Used (%)                0.0        0.0        0.0
DLEs Taped                     1          0          1  1:1
Parts Taped                    1          0          1  1:1
Avg Tp Write Rate (k/s)    830.0        --       830.0


USAGE BY TAPE:
Label                 Time         Size      %  DLEs Parts
MyData01              0:00          83K    0.0     1     1


NOTES:
planner: tapecycle (3) <= runspercycle (3)
planner: Last full dump of 10.1.9.243:/var/lib/pgsql/9.6/data on tape MyData04 overwritten in 3 runs.
taper: tape MyData01 kb 83 fm 1 [OK]


DUMP SUMMARY:
                                                               DUMPER STATS   TAPER STATS
HOSTNAME     DISK                    L ORIG-KB  OUT-KB  COMP%  MMM:SS   KB/s MMM:SS   KB/s
-------------------------------------- ---------------------- -------------- -------------
10.1.9.243   /var/lib/pgsql/9.6/data 1   16416      83    0.5    0:02   33.7   0:00  830.0

(brought to you by Amanda version 3.5.1)
Restoring from backup involves more manual steps as explained in the restore section.
According to the Amanda Enterprise FAQ the following enhancement would apply to our PostgreSQL example:
- management console for automation of backup, retention policies, and schedules
- backup to Amazon S3 cloud storage
Barman
Barman is a disaster recovery solution for PostgreSQL maintained by 2ndQuadrant. It is designed to manage backups for multiple databases and has the ability to restore to a previous point in time using the PITR feature of PostgreSQL.
Barman’s features at a glance:
- handles multiple targets
- support for different PostgreSQL versions
- zero data loss
- streaming and/or standard archiving of WALs
- local or remote recovery
- simplified point in time recovery
As noted in the Barman Manual, support for incremental backups, parallel jobs, data deduplication, and network compression is available only when using the rsync option. Also, streaming WALs from a standby using the archive_command isn’t currently supported.
After following the instructions in the manual for setting up the environment we can verify:
-bash-4.2$ barman list-server
db1 - master
db2 - replica

-bash-4.2$ barman check db1
Server db1:
      PostgreSQL: OK
      is_superuser: OK
      PostgreSQL streaming: OK
      wal_level: OK
      replication slot: OK
      directories: OK
      retention policy settings: OK
      backup maximum age: OK (no last_backup_maximum_age provided)
      compression settings: OK
      failed backups: OK (there are 0 failed backups)
      minimum redundancy requirements: OK (have 0 backups, expected at least 0)
      pg_basebackup: OK
      pg_basebackup compatible: OK
      pg_basebackup supports tablespaces mapping: OK
      archive_mode: OK
      archive_command: OK
      continuous archiving: OK
      pg_receivexlog: OK
      pg_receivexlog compatible: OK
      receive-wal running: OK
      archiver errors: OK

-bash-4.2$ barman check db2
Server db2:
      PostgreSQL: OK
      is_superuser: OK
      PostgreSQL streaming: OK
      wal_level: OK
      replication slot: OK
      directories: OK
      retention policy settings: OK
      backup maximum age: OK (no last_backup_maximum_age provided)
      compression settings: OK
      failed backups: OK (there are 0 failed backups)
      minimum redundancy requirements: OK (have 0 backups, expected at least 0)
      pg_basebackup: OK
      pg_basebackup compatible: OK
      pg_basebackup supports tablespaces mapping: OK
      archive_mode: OK
      archive_command: OK
      continuous archiving: OK
      pg_receivexlog: OK
      pg_receivexlog compatible: OK
      receive-wal running: OK
      archiver errors: OK
Everything checks OK, so we can test by backing up the two hosts:
-bash-4.2$ barman backup db1
Starting backup using postgres method for server db1 in /var/lib/barman/db1/base/20180414T091155
Backup start at LSN: 0/240001B0 (000000010000000000000024, 000001B0)
Starting backup copy via pg_basebackup for 20180414T091155
Copy done (time: 2 seconds)
Finalising the backup.
This is the first backup for server db1
WAL segments preceding the current backup have been found:
      000000010000000000000023 from server db1 has been removed
Backup size: 201.9 MiB
Backup end at LSN: 0/26000000 (000000010000000000000025, 00000000)
Backup completed (start time: 2018-04-14 09:11:55.783708, elapsed time: 2 seconds)
Processing xlog segments from file archival for db1
      000000010000000000000023
      000000010000000000000024
      000000010000000000000025.00000028.backup
Processing xlog segments from streaming for db1
      000000010000000000000024

-bash-4.2$ barman backup db2
Starting backup using postgres method for server db2 in /var/lib/barman/db2/base/20180414T091225
Backup start at LSN: 0/B0000D0 (00000001000000000000000B, 000000D0)
Starting backup copy via pg_basebackup for 20180414T091225
Copy done (time: 3 seconds)
Finalising the backup.
This is the first backup for server db2
WAL segments preceding the current backup have been found:
      000000010000000000000009 from server db2 has been removed
      00000001000000000000000A from server db2 has been removed
Backup size: 196.8 MiB
Backup end at LSN: 0/D000000 (00000001000000000000000C, 00000000)
Backup completed (start time: 2018-04-14 09:12:25.619005, elapsed time: 3 seconds)
Processing xlog segments from file archival for db2
      00000001000000000000000B
      00000001000000000000000C.00000028.backup
Processing xlog segments from streaming for db2
      00000001000000000000000B
List the backup catalog:
-bash-4.2$ barman list-backup all
db1 20180414T091155 - Sat Apr 14 09:11:58 2018 - Size: 217.9 MiB - WAL Size: 0 B
db2 20180414T091225 - Sat Apr 14 09:12:28 2018 - Size: 212.8 MiB - WAL Size: 0 B
Displaying the contents for a particular backup:
-bash-4.2$ barman list-files db1 20180414T091155 | head
/var/lib/barman/db1/base/20180414T091155/backup.info
/var/lib/barman/db1/base/20180414T091155/data/backup_label
/var/lib/barman/db1/base/20180414T091155/data/PG_VERSION
/var/lib/barman/db1/base/20180414T091155/data/postgresql.auto.conf
/var/lib/barman/db1/base/20180414T091155/data/pg_ident.conf
/var/lib/barman/db1/base/20180414T091155/data/postgresql.conf
/var/lib/barman/db1/base/20180414T091155/data/pg_hba.conf
When Barman was configured for synchronous WAL streaming we can verify the replication status:
-bash-4.2$ barman replication-status db1
Status of streaming clients for server 'db1':
Current LSN on master: 0/26000528
Number of streaming clients: 1

1. Async WAL streamer
   Application name: barman_receive_wal
   Sync stage      : 3/3 Remote write
   Communication   : TCP/IP
   IP Address      : 10.1.9.231 / Port: 37278 / Host: -
   User name       : streaming_barman
   Current state   : streaming (async)
   Replication slot: barman
   WAL sender PID  : 2046
   Started at      : 2018-04-14 09:04:03.019323+00:00
   Sent LSN   : 0/26000528 (diff: 0 B)
   Write LSN  : 0/26000528 (diff: 0 B)
   Flush LSN  : 0/26000000 (diff: -1.3 KiB)
Further enhancements can be added using the provided hook scripts.
Finally, for command line lovers, Barman comes with full TAB completion.
EDB Backup and Recovery Tool (BART)
EDB BART is a closed source proprietary application provided by EnterpriseDB. It combines the PostgreSQL native Filesystem Level Backup and PITR into an easy to use tool providing the following features:
- retention policies
- incremental backups
- complete, hot, physical backups of multiple Postgres Plus Advanced Server and PostgreSQL database servers
- backup and recovery management of the database servers on local or remote hosts
- centralized catalog for backup data
- store backup data in compressed format
- checksum verification
While the trial version for the latest version v2.1 is not freely available, the article Data Backup Made Easy and the product documentation guide offer some information for those curious to learn more.
ClusterControl
Single Console for Your Entire Database Infrastructure
Find out what else is new in ClusterControl
pgBackRest
pgBackRest implements a full system backup that doesn’t rely on the common tools tar and rsync. It is currently hosted and made available by CrunchyData under an MIT license. See Recognition for details on its origins.
It offers all the features one would expect from a PostgreSQL centric tool:
- high backup/restore throughput
- full, incremental, and differential backups
- retention policies
- backup and restore integrity verification through file checksums and integration with PostgreSQL page checksums.
- ability to resume backups
- streaming compression and checksums
- Amazon S3 cloud storage support
- Encryption
..and much more. Refer to the project page for details.
The installation requires a 64-bit Linux/Unix system and it is outlined in the user guide. The guide also introduces the reader to the main concepts, very useful to those new to PostgreSQL or storage technology.
Although the guide uses command examples for Debian/Ubuntu the pgBackRest is available in the PGDG yum repository, and the installer will pull in all the dependencies:
Installing:
pgbackrest       x86_64  2.01-1.rhel7     pgdg10  36k

Installing       for     dependencies:
perl-DBD-Pg      x86_64  2.19.3-4.el7     base    195k
perl-DBI         x86_64  1.627-4.el7      base    802k
perl-Digest-SHA  x86_64  1:5.85-4.el7     base    58k
perl-JSON-PP     noarch  2.27202-2.el7    base    55k
perl-Net-Daemon  noarch  0.48-5.el7       base    51k
perl-PlRPC       noarch  0.2020-14.el7    base    36k
perl-XML-LibXML  x86_64  1:2.0018-5.el7   base    373k
perl-version     x86_64  3:0.99.07-2.el7  base    84k
Let’s setup two clusters, pg96 and pg10, each having one node:
control node (“repository” in the guide):
[root@cc ~]# cat /etc/pgbackrest.conf
[global]
repo1-path=/var/lib/pgbackrest
repo1-retention-full=2
start-fast=y

[pg96]
pg1-path=/var/lib/pgsql/9.6/data
pg1-host=db1
pg1-host-user=postgres

[pg10]
pg1-path=/var/lib/pgsql/10/data
pg1-host=db2
pg1-host-user=postgres
cluster #1:
[root@db-1 ~]# cat /etc/pgbackrest.conf
[global]
log-level-file=detail
repo1-host=repository

[pg96]
pg1-path=/var/lib/pgsql/9.6/data
cluster #2:
[root@db-2 ~]# cat /etc/pgbackrest.conf
[global]
log-level-file=detail
repo1-host=repository

[pg10]
pg1-path=/var/lib/pgsql/10/data
Next, run backups and display the backup catalog:
-bash-4.2$ pgbackrest --stanza=pg96 info
stanza: pg96
   status: ok

   db (current)
      wal archive min/max (9.6-1): 00000001000000000000003D / 00000001000000000000003D

      full backup: 20180414-120727F
            timestamp start/stop: 2018-04-14 12:07:27 / 2018-04-14 12:08:01
            wal start/stop: 00000001000000000000003D / 00000001000000000000003D
            database size: 185.6MB, backup size: 185.6MB
            repository size: 12.1MB, repository backup size: 12.1MB
-bash-4.2$ pgbackrest --stanza=pg10 info
stanza: pg10
   status: ok

   db (current)
      wal archive min/max (10-1): 000000010000000000000012 / 000000010000000000000012

      full backup: 20180414-120810F
            timestamp start/stop: 2018-04-14 12:08:10 / 2018-04-14 12:08:38
            wal start/stop: 000000010000000000000012 / 000000010000000000000012
            database size: 180.5MB, backup size: 180.5MB
            repository size: 11.6MB, repository backup size: 11.6MB
pgBackRest supports parallelizing of backup and restore — following the example in the guide, we are backing with one CPU and then update the config to use 2 CPUs:
--- a/etc/pgbackrest.conf
+++ b/etc/pgbackrest.conf
@@ -2,6 +2,7 @@
repo1-path=/var/lib/pgbackrest
repo1-retention-full=2
start-fast=y
+process-max=2

[pg96]
pg1-host=db1
The result:
-bash-4.2$ pgbackrest --stanza=pg96 info
stanza: pg96
    status: ok

    db (current)
        wal archive min/max (9.6-1): 00000001000000000000003D / 000000010000000000000041

        full backup: 20180414-120727F
            timestamp start/stop: 2018-04-14 12:07:27 / 2018-04-14 12:08:01
            wal start/stop: 00000001000000000000003D / 00000001000000000000003D
            database size: 185.6MB, backup size: 185.6MB
            repository size: 12.1MB, repository backup size: 12.1MB

        incr backup: 20180414-120727F_20180414-121434I
            timestamp start/stop: 2018-04-14 12:14:34 / 2018-04-14 12:14:52
            wal start/stop: 00000001000000000000003F / 00000001000000000000003F
            database size: 185.6MB, backup size: 8.2KB
            repository size: 12.1MB, repository backup size: 431B
            backup reference list: 20180414-120727F

        incr backup: 20180414-120727F_20180414-121853I
            timestamp start/stop: 2018-04-14 12:18:53 / 2018-04-14 12:19:08
            wal start/stop: 000000010000000000000041 / 000000010000000000000041
            database size: 185.6MB, backup size: 8.2KB
            repository size: 12.1MB, repository backup size: 429B
backup reference list: 20180414-120727FWith 2 CPUs the backup ran almost 20% faster which can make a big difference when running against a large data set.
Conclusion
PostgreSQL centric backup tools offer, as expected, more options than general purpose tools. Most PostgreSQL backup tools offer the same core functionality, but their implementation introduces limitations that can only be discovered by carefully following the documentation to test drive the product.
In addition, ClusterControl offers an array of backup and restore features that you can use as part of your database management setup.
↧
Luca Ferrari: What happens when you add a column?
Adding a column with a default value requires a full table rewrite, and therefore it is often suggested to avoid the default value. However, it is possible to add the default value without having PostgreSQL perform the full table rewrite.
Adding a column via ALTER TABLE ADD COLUMN
In order to demonstrate what does PostgreSQL when a new column is added, consider the following simple table to begin with:
>CREATETABLEfoo(iint);>INSERTINTOfoo(i)SELECTvFROMgenerate_series(1,100000)v;Suppose it is required to add a column, with a default value, to the table. When an ALTER TABLE ADD COLUMN is issued, and a default value is provided, PostgreSQL performs a full update of the whole table, that is all the 100k tuples are updated immediatly:
>ALTERTABLEfooADDCOLUMNcchar(1)DEFAULT'A';ALTERTABLETime:180.997ms>SELECTdistinct(c)FROMfoo;c---A(1row)As readers can see, the c column has been added and all the tuples have been updated to the default value.
When the number of tuples is really high, performing such ADD COLUMN will result in a very huge database activity. Therefore, it is often suggested to perform the ADD COLUMN without a default value, so to get the...
↧
William Ivanski: OmniDB: Console Tab
Introduced in OmniDB 2.6.0, the new OmniDB Console Tab provides an easy and comfortable way to interact with your databases. Users familiar with the psql command line utility will find that Console Tab behaves very similarly. In fact, many of the backslash commands Console Tab provides are present in psql.

For example, \? shows a list with all commands available, its syntax and description. The command \h can be another friend of yours, because it shows a comprehensive help about any PostgreSQL SQL command.

The editor on the bottom of the tab area is full-featured just like the Query Tab editor (it provides syntax highlight and autocomplete with Ctrl-Space). To execute a command, just type it in this editor. If the command is a backslash (starts with \), just type Enter and it will be executed. If it is a regular SQL command, then it can be multi-lined, and you will need to type Ctrl-Q to execute it.
All commands and its output will be logged into the display area, which is textual and read-only, so you can copy and paste its contents somewhere else. You can clear the display area by clicking on the Clear Console button.
All commands also are logged in the global OmniDB query history, and also in a local console history, which you can by clicking in the Command History button.

By clicking in the green check, you can borrow the command and put it into the editor, so you can amend it and execute it. Another comfortable way to navigate through the history is using the shortcuts Ctrl-Up and Ctrl-Down, to quickly paste in the editor the previous and next commands, respectively.
Backslash commands such as \dt, \d+, \x and \timing are very useful when dealing with databases every day. The console tab will also show any errors and the results of any SQL command you type in a pretty way. Try it out!


In the near future we will add more commands such as \copy and also the ability for the user to create custom commands. Stay tuned!
↧
↧
Alexey Lesovsky: pg_wal is too big… what's going on?
What’s common between DBA and detective? They both solve murder and mystery while trying to make sense of the nonsense.
Recently, one of our clients had Postgres crash due to the lack of free space on the database server. Client's reaction was instantaneous - a hot standby was immediately promoted to master and the application continued working. Some details about the crash were saved and since it’s the age of clouds, devops and microservices, the failed host was recycled into a new hot standby.Once the dust has settled, the client gave us saved information about the failure asking: What was it? How can I avoid it in the future?
The first thing that we’ve done is what any good detective would do - started looking for clues. Client provided us with crash logs and said that pg_xlog directory was suspiciously big while there were only around 2 thousand files with 16MB size each. We looked into postgresql.log to see what were the last lines before crash:
PANIC: could not write to file "pg_xlog/xlogtemp.9023": No space left on device
LOG: WAL writer process (PID 9023) was terminated by signal 6: Aborted
LOG: terminating any other active server processes
Looking at other log messages we saw another FATAL record:
FATAL: archive command failed with exit code 131
DETAIL: The failed archive command was: /opt/utils/pgdb/wal-archiver pg_xlog/000000010000000000000003
That was the answer to the first question. From these two log messages, we concluded that free space was completely exhausted due to failed archive command - Postgres could not write its transaction log and ultimately crashed.
But how we can prevent that from happening again and what to do in case it does happen?
Let me take a little detour here, for those who are unfamiliar with pg_xlog. pg_xlog is a directory where Postgres keeps its transaction log (also known as XLOG or WAL) which is used for recovery purposes. For various reasons, people often delete files from this directory because its name contains word "log" and one inclined to think "This are just logs, nothing will happen if I delete them". In fact, pg_xlog plays a vital role in the database's life! Furthermore, to prevent situations when these files are accidently deleted pg_xlog has been renamed to pg_wal in Postgres 10. Note: in this article, I will use the newer term ‘pg_wal’ for both ‘pg_xlog’ and ‘pg_wal’.
Now, let's get back to our mystery, how can we avoid being left without space on our device?
The most obvious answer here is monitoring. The amount of free or used disk space always must be kept under control and there has to be a system that would alert you in case of reaching a threshold. It helps to begin to work on an issue before it becomes a real problem. If there is no monitoring systems, disk space can be checked with "df" utility.
Let's imagine that through the monitoring system or otherwise you get an alert that the free space is reaching dangerous threshold levels and this is an indication of sudden and uncontrollable consumption in pg_wal directory. The very first golden rule here is "Do NOT delete any files from pg_wal directory!" - otherwise your database might turn into a pumpkin.
Here are two ways to go about it: the first - is to take an emergency action, this is the last resort when there is only 2% or less of free disc space, lack of time to find the cause of the problem and the main goal of your actions is to avoid the risk of the database crash halt. The second - is set of actions directed to find out the cause of the space consumption - something you can only do when there is no risk of the database's emergency stop. Let's consider both ways.
In case, when there is no free disk space left and the time plays against us, the main goal is to avoid the complete halt of the database. Intuitively, the most obvious action here is to delete something, this is, however, not the best practice, especially if you are in a hurry and chances are you will make an irreversible damage by deleting essential database files. In fact, it is much better in this situation to add space - this is not an easy solution and might have some limitations, however, it’s much better than random deletion. So where can we get that extra space? There are two options, and both depend on your OS installation settings:
Reserved space on Ext filesystems.
By default Ext filesystems formatted with reserved space of about 5% for super-user files - this allows super-user or root-owned daemons, to continue functioning correctly after non-privileged processes are prevented from writing to the filesystem. Reserved space is invisible and by using 'tune2fs -m' it's possible to reduce this setting and return that space from root-only to shared usage. The larger is your filesystem, the more noticeable would be the effect of such action. When the main cause of the problem has been solved, the reserved space percentage can be then turned back on. Do keep in mind that an alternative filesystem - XFS has no reserved space options, so this trick wouldn’t work on it.
Free space in the pool or the volume group.
In case when the database is hosted on LVM or ZFS a different emergency action may be useful. If the pool or the volume group have free space, it's possible to add this space to the filesystem. Later on, when the problem will be finally solved, the added space can be returned back to the pool. This approach is a bit more tricky than the one above, to do than in first way, but is definitely an option. To do this, you need to shrink filesystem and than reduce the volume size. This is something that I would advise doing only if you are an experienced DBA, so if you want to take this route it’s highly advisable to test your skills in test environment first, so that you are prepared for doing it live when needed.
After emergency actions are complete and there is no risk of panic shutdown for the database, you can start investigating the source of your problems - why did pg_wal started bloating in the first place? There are two most popular scenarios here.
Failed archive_command.
WAL archiving assumes the usage of archive_mode and archive_command parameters, and the latter has one important detail - if archive_command fails with any error (non-zero exit code). Depending on the WAL traffic, pg_wal directory starts to bloat and the only way to stop it is to fix archive_command. To detect problems with archive_command, you can use pg_stat_archiver view which has information about the number of failed attempts to archive segments and an exact time of the last failed attempt. If you use WAL archiving with archive_command, it's highly recommended to monitor pg_stat_archiver stats.
Another way to shoot yourself in the foot is semi-configured WAL archiving on a standby host. For known reasons archive_command works on standby only when: 1) 'archive_mode = always'; or 2) standby promotes to master. Thus, standby hosts usually configured with 'archive_mode = on' and this is ok, but on one fine day when a standby is promoted to master, WAL archiving will become enabled. The experience shows that at this point, the most needed archiving scripts or packages on promoted master are absent and archive_command will fail. So when you use the same configuration files on all nodes of Postgres cluster please keep this in mind.
Forgotten replication slot.
Another cause for pg_wal bloat are forgotten replication slots. Slots have been introduced in Postgres 9.4 and are designed to keep WAL segments for safety purposes in cases when, the client that has been subscribed to a slot, unexpectedly goes down for a prolonged period of time. Before introduction of replication slots, wal_keep_segments have been used for this purpose. However, this parameter allowed to only keep a specified number of segments and there was a risk of segments being recycled (which led to inability of the standby to connect to the primary server). Replication slots don't have this limitations and can keep segments until there is available disk space. Thus, they also might cause pg_wal bloat.
There are also cases when software, that requires connection to Postgres is used through replication slots, and what happens is that users forget to remove the slot once they stopped using the software. This forgotten slot remains active in the system and silently continues to occupy the segments… and you can imagine the rest… There is pg_replication_slots view which helps to observe replication slots and their state, the view is very handy when using slots.
In cases above and similar, once you have fixed the problem you should (!) connect to Postgres and run CHECKPOINT command two-three times. This command starts the procedure of creating a recovery point and during it Postgres removes unneeded segments from pg_wal. But note, this procedure when running, might cause extra IO and drop queries' performance, especially in case of large shared buffers and high write traffic.
Of course, these are not the only issues that may cause pg_wal to bloat, but they are the most frequent ones, in my practice. If you would like to see more, check Postgres mailing lists where you can find some additional examples.
Do you have any interesting cases of pg_wal bloat? Share them in comments below!
↧
Hubert 'depesz' Lubaczewski: Waiting for PostgreSQL 11 – Transforms for jsonb to PL/Python and to PL/Perl
On 28th of March 2018, Peter Eisentraut committed patch: Transforms for jsonb to PL/Python Add a new contrib module jsonb_plpython that provide a transform between jsonb and PL/Python. jsonb values are converted to appropriate Python types such as dicts and lists, and vice versa. Author: Anthony Bykov and then, on 3rd of April 2018, he […]
↧
Vladimir Svedov: A Guide to Pgpool for PostgreSQL - Part One

Pgpool is less actual today, than it used to be 10 years ago, when it was the default part of a production PostgreSQL set up. Often when somebody was talking about PostgreSQL cluster, they were referring to postgreSQL behind pgpool and not to the PostgreSQL instance itself (which is the right term). Pgpool is recognised between most influential Postgres players: postgresql community, commandprompt, 2ndquadrant, EDB, citusdata, postgrespro (ordered by age, not influence). I realize the level of recognition in my links is very different - I just want to emphasize the overall impact of pgpool in the postgres world. Some of the most known current postgres “vendors” were found after the pgpool was already famous. So what makes it so famous?
Just the list of most in-demand offered features makes it look great:
- native replication
- connection pooling
- load balancing for read scalability
- high availability (watchdog with virtual IP, online recovery & failover)
Well, let’s make a sandbox and play. My sample setup is master slave mode. I would assume it is the most popular today, because you typically use streaming replication together with load balancing. Replication mode is barely used these days. Most DBAs skip it in favour to streaming replication and pglogical, and previously to slony.
The replication mode has many interesting settings and surely interesting functionality. But most DBAs have master/multi slave setup by the time they get to pgpool. So they are looking for automatic failover and load balancer, and pgpool offers it out of the box for existing master/multi slave environments. Not to mention that as from Postgres 9.4, streaming replication works with no major bugs and from 10 hash indexes replication is supported, so there are barely anything to stop you from using it. Also streaming replication is asynchronous by default (configurable to synchronous and even not “linear” synchronization complicated setups, while native pgpool replication is synchronous (which means slower data changes) with no choice option. Also additional limitations apply. Pgpool manual itself suggests to prefer when possible streaming replication over pgpool native one). And so this is my choice here.
Ah, but first we need to install it - right?
Installation (of higher version on ubuntu).
First checking the ubuntu version with lsb_release -a. For me repo is:
root@u:~# sudo add-apt-repository 'deb http://apt.postgresql.org/pub/repos/apt/ xenial-pgdg main'
wget --quiet -O - https://www.postgresql.org/media/keys/ACCC4CF8.asc | \
>   sudo apt-key add -
OK
root@u:~# sudo apt-get update
Lastly installation itself:
sudo apt-get install pgpool2=3.7.2-1.pgdg16.04+1Config:
I user default config from recommended mode:
zcat /usr/share/doc/pgpool2/examples/pgpool.conf.sample-stream.gz > /etc/pgpool2/pgpool.confStarting:
If you missed config, you see:
2018-03-22 13:52:53.284 GMT [13866] FATAL: role "nobody" does not existAh true - my bad, but easily fixable (doable blindly with one liner if you want the same user for all healthchecks and recovery):
root@u:~# sed -i s/'nobody'/'pgpool'/g /etc/pgpool2/pgpool.confAnd before we go any further, let’s create database pgpool and user pgpool in all clusters (In my sandbox they are master, failover and slave, so I need to run it on master only):
t=# create database pgpool;
CREATE DATABASE
t=# create user pgpool;
CREATE ROLE
At last - starting:
postgres@u:~$ /usr/sbin/service pgpool2 start
postgres@u:~$ /usr/sbin/service pgpool2 status
pgpool2.service - pgpool-II
   Loaded: loaded (/lib/systemd/system/pgpool2.service; enabled; vendor preset: enabled)
   Active: active (running) since Mon 2018-04-09 10:25:16 IST; 4h 14min ago
     Docs: man:pgpool(8)
  Process: 19231 ExecReload=/bin/kill -HUP $MAINPID (code=exited, status=0/SUCCESS)
 Main PID: 8770 (pgpool)
    Tasks: 10
   Memory: 5.5M
      CPU: 18.250s
   CGroup: /system.slice/pgpool2.service
           ├─ 7658 pgpool: wait for connection reques
           ├─ 7659 pgpool: wait for connection reques
           ├─ 7660 pgpool: wait for connection reques
           ├─ 8770 /usr/sbin/pgpool -n
           ├─ 8887 pgpool: PCP: wait for connection reques
           ├─ 8889 pgpool: health check process(0
           ├─ 8890 pgpool: health check process(1
           ├─ 8891 pgpool: health check process(2
           ├─19915 pgpool: postgres t ::1(58766) idl
           └─23730 pgpool: worker proces
Great - so we can proceed to the first feature - let’s check load balancing. It has some requirements to be used, supports hints (e.g. to balance in same session), has black-and-white-listed functions, has regular expressions based redirect preference list. It is sophisticated. Alas goingf thoroughly over all that functionality would be out of the scope of this blog, thus we will check the simplest demos:
First, something very simple will show which node is used for select (in my setup, master spins on 5400, slave on 5402 and failover on 5401, while pgpool itself is on 5433, as I have another cluster running and did not want to interfere with it):
vao@u:~$ psql -h localhost -p 5433 t -c "select current_setting('port') from ts limit 1"
 current_setting
-----------------
 5400
(1 row)
Then in loop:
vao@u:~$ (for i in $(seq 1 99); do psql -h localhost -p 5433 t -c "select current_setting('port') from ts limit 1" -XAt; done) | sort| uniq -c
      9 5400
     30 5401
     60 5402
Great. It definitely balances load between nodes, but seems to balance not equally - maybe it’s so smart it knows the weight of each statement? Let’s check the distribution with expected results:
t=# show pool_nodes;
 node_id | hostname  | port | status | lb_weight |  role   | select_cnt | load_balance_node | replication_delay
---------+-----------+------+--------+-----------+---------+------------+-------------------+-------------------
 0       | localhost | 5400 | up     | 0.125000  | primary | 122        | false             | 0
 1       | localhost | 5401 | up     | 0.312500  | standby | 169        | false             | 0
 2       | localhost | 5402 | up     | 0.562500  | standby | 299        | true              | 0
(3 rows)
No - pgpool does not analyze the weight of statements - it was a DBA with her settings again! The settings (see the lb_weight attribute) reconciles with actual query destination targets. You can easily change it (as we did here) by changing the corresponding setting, eg:
root@u:~$ grep weight /etc/pgpool2/pgpool.conf
backend_weight0 =0.2
backend_weight1 = 0.5
backend_weight2 = 0.9
root@u:~# sed -i s/'backend_weight2 = 0.9'/'backend_weight2 = 0.2'/ /etc/pgpool2/pgpool.conf
root@u:~# grep backend_weight2 /etc/pgpool2/pgpool.conf
backend_weight2 = 0.2
root@u:~# pgpool reload
root@u:~$ (for i in $(seq 1 9); do psql -h localhost -p 5433 t -c "select current_setting('port') from ts limit 1" -XAt; done) | sort| uniq -c
      6 5401
      3 5402
ClusterControl
Single Console for Your Entire Database Infrastructure
Find out what else is new in ClusterControl
Great! The next great feature offered is connection pooling. With 3.5 the “thundering herd problem” is solved by serializing accept() calls, greatly speeding up “client connection” time. And yet this feature is pretty straightforward. It does not offer several levels of pooling or several pools configured for the same database (pgpool lets you to choose where to run selects with database_redirect_preference_list of load balancing though), or other flexible features offered by pgBouncer.
So short demo:
t=# select pid,usename,backend_type, state, left(query,33) from pg_stat_activity where usename='vao' and pid <> pg_backend_pid();
 pid  | usename |  backend_type  | state |     left
------+---------+----------------+-------+--------------
 8911 | vao     | client backend | idle  |  DISCARD ALL
 8901 | vao     | client backend | idle  |  DISCARD ALL
 7828 | vao     | client backend | idle  |  DISCARD ALL
 8966 | vao     | client backend | idle  |  DISCARD ALL
(4 rows)
Hm - did I set up this little number of children?
t=# pgpool show num_init_children;
 num_init_children
-------------------
 4
(1 row)
Ah, true, I changed them lower than default 32, so the output would not take several pages. Well then, let’s try exceeding the number of sessions (below I open postgres sessions async in loop, so the 6 sessions would be requested at more or less the same time):
vao@u:~$ for i in $(seq 1 6); do (psql -h localhost -p 5433 t -U vao -c "select pg_backend_pid(), pg_sleep(1), current_setting('port'), clock_timestamp()" &);  done
vao@u:~$  pg_backend_pid | pg_sleep | current_setting |        clock_timestamp
----------------+----------+-----------------+-------------------------------
           8904 |          | 5402            | 2018-04-10 12:46:55.626206+01
(1 row)

 pg_backend_pid | pg_sleep | current_setting |        clock_timestamp
----------------+----------+-----------------+-------------------------------
           9391 |          | 5401            | 2018-04-10 12:46:55.630175+01
(1 row)

 pg_backend_pid | pg_sleep | current_setting |       clock_timestamp
----------------+----------+-----------------+------------------------------
           8911 |          | 5400            | 2018-04-10 12:46:55.64933+01
(1 row)

 pg_backend_pid | pg_sleep | current_setting |        clock_timestamp
----------------+----------+-----------------+-------------------------------
           8904 |          | 5402            | 2018-04-10 12:46:56.629555+01
(1 row)

 pg_backend_pid | pg_sleep | current_setting |        clock_timestamp
----------------+----------+-----------------+-------------------------------
           9392 |          | 5402            | 2018-04-10 12:46:56.633092+01
(1 row)

 pg_backend_pid | pg_sleep | current_setting |       clock_timestamp
----------------+----------+-----------------+------------------------------
           8910 |          | 5402            | 2018-04-10 12:46:56.65543+01
(1 row)
It lets sessions to come by three - expected, as one is taken by the above session (selecting from pg_stat_activity) so 4-1=3. As soon as pg_sleep finishes its one second nap and session is closed by postgres, the next one is let in. So after the first three ends, the next three step in. What happens to the rest? They are queued until the next connection slot frees up. Then the process described next to serialize_accept happens and client gets connected.
Huh? Just session pooling in session mode? Is it all?.. No, here the caching steps in! Look.:
postgres=# /*NO LOAD BALANCE*/ select 1;
 ?column?
----------
        1
(1 row)
Checking the pg_stat_activity:
postgres=# select pid, datname, state, left(query,33),state_change::time(0), now()::time(0) from pg_stat_activity where usename='vao' and query not like '%DISCARD%';
  pid  | datname  | state |               left                | state_change |   now
-------+----------+-------+-----------------------------------+--------------+----------
 15506 | postgres | idle  | /*NO LOAD BALANCE*/ select 1, now | 13:35:44     | 13:37:19
(1 row)
Then run the first statement again and observe state_change not changing, which means you don’t even get to the database to get a known result! Of course if you put some mutable function, results won’t be cached. Experiment with:
postgres=# /*NO LOAD BALANCE*/ select 1, now();
 ?column? |             now
----------+------------------------------
        1 | 2018-04-10 13:35:44.41823+01
(1 row)
You will find that state_change changes as does the result.
Last point here - why /*NO LOAD BALANCE*/ ?.. to be sure we check pg_stat_activity on master and run query on master as well. Same you can use /*NO QUERY CACHE*/ hint to avoid getting a cached result.
Already much for a short review? But we did not even touch the HA part! And many users look towards pgpool specifically for this feature. Well, this is not the end of the story, this is the end of part one. Part two is coming, where we will briefly cover HA and some other tips on using pgpool...
↧
Dimitri Fontaine: PostgreSQL Data Types: Ranges
Continuing our series of PostgreSQL Data Types today we’re going to introduce the PostgreSQL ranges data type.
Range types are a unique feature of PostgreSQL, managing two dimensions of data in a single column, and allowing advanced processing. The main example is the daterange data type, which stores as a single value a lower and an upper bound of the range as a single value. This allows PostgreSQL to implement a concurrent safe check against overlapping ranges, as we’re going to see in this article.
↧
↧
Tatsuo Ishii: Detecting "false" primary server of PostgreSQL
One of upcoming Pgpool-II 4.0's interesting features will be: "false" primary server detection in streaming replication environment.
Suppose we have 1 primary server and two standby servers connection the primary server.
test=# show pool_nodes;
node_id | hostname | port | status | lb_weight | role | select_cnt | load_balance_node | replication_delay
---------+----------+-------+--------+-----------+---------+------------+-------------------+-------------------
0 | /tmp | 11002 | up | 0.000000 | primary | 1 | false | 0
1 | /tmp | 11003 | up | 0.000000 | standby | 0 | false | 0
2 | /tmp | 11004 | up | 1.000000 | standby | 0 | true | 0
(3 rows)
What will happen if the node 2 standby server is promoted to primary?
test=# show pool_nodes;
node_id | hostname | port | status | lb_weight | role | select_cnt | load_balance_node | replication_delay
---------+----------+-------+--------+-----------+---------+------------+-------------------+-------------------
0 | /tmp | 11002 | up | 0.000000 | primary | 1 | false | 0
1 | /tmp | 11003 | up | 0.000000 | standby | 0 | false | 0
2 | /tmp | 11004 | up | 1.000000 | standby | 0 | true | 0
(3 rows)
As you can see nothing has been changed as far as show pool_nodes command goes.
But: actually node 2 is not the standby connected to the primary any more. So if large updates are sent to the primary, the node 2 is far behind the primary server since data is not replicated to the node any more.
t-ishii@localhost: pgbench -i -p 11000 test
NOTICE: table "pgbench_history" does not exist, skipping
NOTICE: table "pgbench_tellers" does not exist, skipping
NOTICE: table "pgbench_accounts" does not exist, skipping
NOTICE: table "pgbench_branches" does not exist, skipping
creating tables...
100000 of 100000 tuples (100%) done (elapsed 0.19 s, remaining 0.00 s)
vacuum...
set primary keys...
done.
test=# show pool_nodes;
node_id | hostname | port | status | lb_weight | role | select_cnt | load_balance_node | replication_delay
---------+----------+-------+--------+-----------+---------+------------+-------------------+-------------------
0 | /tmp | 11002 | up | 0.000000 | primary | 1 | false | 0
1 | /tmp | 11003 | up | 0.000000 | standby | 0 | false | 0
2 | /tmp | 11004 | up | 1.000000 | standby | 0 | true | 13100296
(3 rows)
How can we detect the situation and fix it?
Pgpool-II 4.0 will help you. It will have a new parameter called "detach_false_primary". If the parameter is enabled, Pgpool-II will automatically detect the situation and detach the node 2 because it's a"false" primary.
test=# show pool_nodes;
node_id | hostname | port | status | lb_weight | role | select_cnt | load_balance_node | replication_delay
---------+----------+-------+--------+-----------+---------+------------+-------------------+-------------------
0 | /tmp | 11002 | up | 0.000000 | primary | 1 | false | 0
1 | /tmp | 11003 | up | 0.000000 | standby | 0 | false | 0
2 | /tmp | 11004 | down | 1.000000 | standby | 0 | true | 13100296
(3 rows)
Note that there's a limitation in the feature. For example, if there are 4 nodes: primary 1 connects to standby 1, while primary 2 connect to standby 2. There's no reliable way which node is the "true" primary. In this case the false primary detection does not work.
In the figure bellow explains what Pgpool-II 4.0 can do and cannot.
You can read more details of the feature from the manual.
![]()
Suppose we have 1 primary server and two standby servers connection the primary server.
test=# show pool_nodes;
node_id | hostname | port | status | lb_weight | role | select_cnt | load_balance_node | replication_delay
---------+----------+-------+--------+-----------+---------+------------+-------------------+-------------------
0 | /tmp | 11002 | up | 0.000000 | primary | 1 | false | 0
1 | /tmp | 11003 | up | 0.000000 | standby | 0 | false | 0
2 | /tmp | 11004 | up | 1.000000 | standby | 0 | true | 0
(3 rows)
What will happen if the node 2 standby server is promoted to primary?
test=# show pool_nodes;
node_id | hostname | port | status | lb_weight | role | select_cnt | load_balance_node | replication_delay
---------+----------+-------+--------+-----------+---------+------------+-------------------+-------------------
0 | /tmp | 11002 | up | 0.000000 | primary | 1 | false | 0
1 | /tmp | 11003 | up | 0.000000 | standby | 0 | false | 0
2 | /tmp | 11004 | up | 1.000000 | standby | 0 | true | 0
(3 rows)
As you can see nothing has been changed as far as show pool_nodes command goes.
But: actually node 2 is not the standby connected to the primary any more. So if large updates are sent to the primary, the node 2 is far behind the primary server since data is not replicated to the node any more.
t-ishii@localhost: pgbench -i -p 11000 test
NOTICE: table "pgbench_history" does not exist, skipping
NOTICE: table "pgbench_tellers" does not exist, skipping
NOTICE: table "pgbench_accounts" does not exist, skipping
NOTICE: table "pgbench_branches" does not exist, skipping
creating tables...
100000 of 100000 tuples (100%) done (elapsed 0.19 s, remaining 0.00 s)
vacuum...
set primary keys...
done.
test=# show pool_nodes;
node_id | hostname | port | status | lb_weight | role | select_cnt | load_balance_node | replication_delay
---------+----------+-------+--------+-----------+---------+------------+-------------------+-------------------
0 | /tmp | 11002 | up | 0.000000 | primary | 1 | false | 0
1 | /tmp | 11003 | up | 0.000000 | standby | 0 | false | 0
2 | /tmp | 11004 | up | 1.000000 | standby | 0 | true | 13100296
(3 rows)
How can we detect the situation and fix it?
Pgpool-II 4.0 will help you. It will have a new parameter called "detach_false_primary". If the parameter is enabled, Pgpool-II will automatically detect the situation and detach the node 2 because it's a"false" primary.
test=# show pool_nodes;
node_id | hostname | port | status | lb_weight | role | select_cnt | load_balance_node | replication_delay
---------+----------+-------+--------+-----------+---------+------------+-------------------+-------------------
0 | /tmp | 11002 | up | 0.000000 | primary | 1 | false | 0
1 | /tmp | 11003 | up | 0.000000 | standby | 0 | false | 0
2 | /tmp | 11004 | down | 1.000000 | standby | 0 | true | 13100296
(3 rows)
Note that there's a limitation in the feature. For example, if there are 4 nodes: primary 1 connects to standby 1, while primary 2 connect to standby 2. There's no reliable way which node is the "true" primary. In this case the false primary detection does not work.
In the figure bellow explains what Pgpool-II 4.0 can do and cannot.
You can read more details of the feature from the manual.

↧
Brian Fehrle: An Expert’s Guide to Slony Replication for PostgreSQL

What is Slony?
Slony-I (referred to as just ‘Slony’ from here on out) is a third-party replication system for PostgreSQL that dates back to before version 8.0, making it one of the older options for replication available. It operates as a trigger-based replication method that is a ‘master to multiple slaves’ solution.
Slony operates by installing triggers on each table to be replicated, on both master and slaves, and every time the table gets an INSERT, UPDATE, or DELETE, it logs which record gets changed, and what the change is. Outside processes, called the ‘slon daemons’, connect to the databases as any other client and fetch the changes from the master, then replay them on all slave nodes subscribed to the master. In a well performing replication setup, this asynchronous replication can be expected to be anywhere 1 to 20 seconds lagged behind the master.
As of this writing, the latest version of Slony is at version 2.2.6, and supports PostgreSQL 8.3 and above. Support continues to this day with minor updates, however if a future version of PostgreSQL changes fundamental functionality of transactions, functions, triggers, or other core features, the Slony project may decide to discontinue large updates to support such drastic new approaches.
PostgreSQL’s mascot is an elephant known as ‘Slonik’, which is Russian for ‘little elephant’. Since this replication project is about many PostgreSQL databases replicating with each other, the Russian word for elephants (plural) is used: Slony.
Concepts
- Cluster: An instance of Slony replication.
- Node: A specific PostgreSQL database as Slony replication node, which operates as either a master or slave for a replication set.
- Replication Set: A group of tables and / or sequences to be replicated.
- Subscribers: A subscriber is a node that is subscribed to a replication set, and receives replication events for all tables and sequences within that set from the master node.
- Slony Daemons: The main workers that execute replication, a Slony daemon is kicked off for every node in the replication set and establishes various connections to the node it manages, as well as the master node.
How it is Used
Slony is installed either by source or through the PGDG (PostgreSQL Global Development Group) repositories which are available for Red Hat and Debian based linux distributions. These binaries should be installed on all hosts that will contain either a master or slave node in the replication system.
After installation, a Slony replication cluster is set up by issuing a few commands using the ‘slonik’ binary. ‘slonik’ is a command with a simple, yet unique syntax of its own to initialize and maintain a slony cluster. It is the main interface for issuing commands to the running Slony cluster that is in charge of replication.
Interfacing with Slony can be done by either writing custom slonik commands, or compiling slony with the --with-perltools flag, which provides the ‘altperl’ scripts that help generate these slonik scripts needed.
Creating a Slony Replication Cluster
A ‘Replication Cluster’ is a collection of databases that are part of replication. When creating a replication cluster, an init script needs to be written that defines the following:
- The name of the Slony cluster desired
- The connection information for each node part of replication, each with an immutable node number.
- Listing all tables and sequences to be replicated as part of a ‘replication set’.
An example script can be found in Slony’s official documentation.
When executed, slonik will connect to all nodes defined and create the Slony schema on each. When the Slony daemons are kicked off, they will then clear out all data in the replicated tables on the slave (if there is any), and copy over all data from the master to the slave(s). From that point on, the daemons will continually replicate changes recorded on the master to all subscribed slaves.
Clever configurations
While Slony is initially a Master-to-Multiple-Slave replication system, and has mainly been used in that way, there are several other features and clever usages that make Slony more useful than a simple replication solution. The highly customizable nature of Slony keeps it relevant for a variety of situations for administrators that can think outside of the box.
Cascading Replication
Slony nodes can be set up to cascade replication down a chain of different nodes. If the master node is known to take an extremely heavy load, each additional slave will increase that load slightly. With cascading replication, a single slave node connected to the master can be configured as a ‘forwarding node’, which will then be responsible to sending replication events to more slaves, keeping the load on the master node to a minimum.
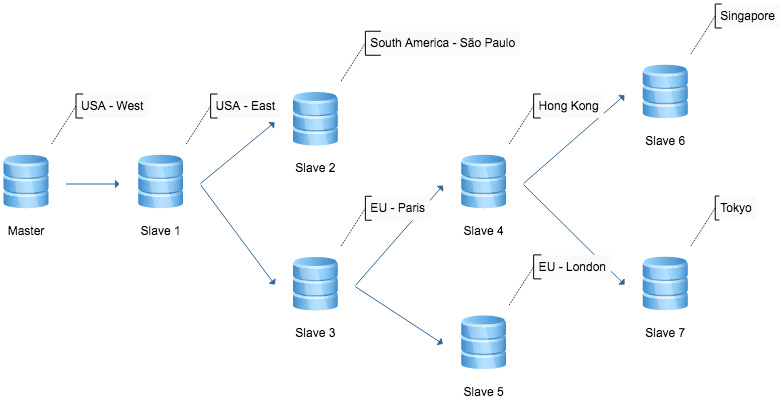
Cascading Replication with Slony
Data processing on a slave node
Unlike PostgreSQL’s built in replication, the slave nodes are not actually ‘read only’, only the tables that are being replicated are locked down as ‘read only’. This means on a slave node, data processing can take place by creating new tables not part of replication to house processed data. Tables part of replication can also have custom indexes created depending on the access patterns that may differ from the slave and the master.
Read only tables on the slaves can still have custom trigger based functions executed on data changes, allowing more customization with the data.
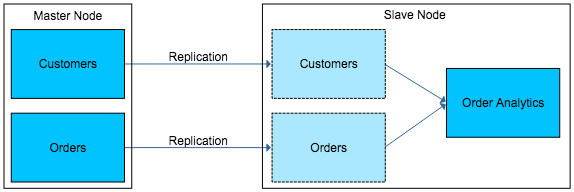
Data Processing on a Slony Slave Node
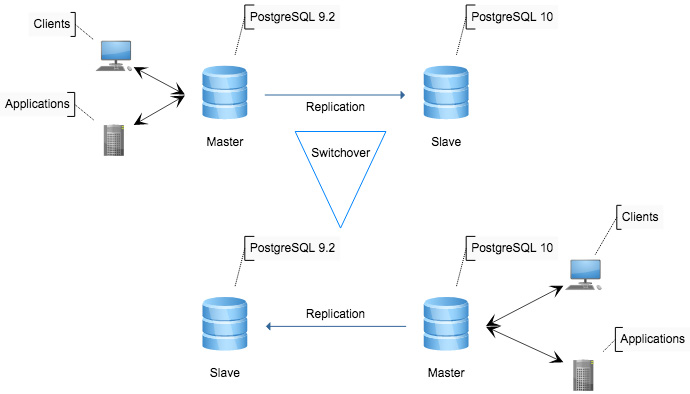
Minimal downtime Upgrades
Upgrading major versions of PostgreSQL can be extremely time consuming. Depending on data size and table count, an upgrade including the ‘analyze’ process post-upgrade could take several days even. Since Slony can replicate data between PostgreSQL clusters of different versions, it can be used to set up replication between an older version as the master and a newer version as the slave. When the upgrade is to happen, simply perform a ‘switchover’, making the slave the new master, and the old master becomes the slave. When the upgrade is marked a success, decommission the Slony replication cluster and shut down the old database.
Upgrade PostgreSQL with Minimal Downtime using Slony
High Availability with frequent server maintenance
Like the minimal downtime for upgrades, server maintenance can be done easily with no downtime by performing a ‘switchover’ between two or more nodes, allowing a slave to be rebooted with updates / other maintenance. When the slave comes back online, it will re-connect to the replication cluster and catch up on all the replicated data. End users connecting to the database may have long transactions disrupted, but downtime itself would be seconds as the switchover happens, rather than however long it takes to reboot / update the host.
Log Shipping
Though not likely to be popular solution, a Slony slave can be set up as a ‘log shipping’ node, where all data it receives through replication can be written to SQL files, and shipped. This can be used for a variety of reasons, such as writing to an external drive and transporting to a slave database manually, and not over a network, compressed and kept archived for future backups, or even have an external program parse the SQL files and modify the contents.
Multiple database data sharing
Since any number of tables can be replicated at will, Slony replication sets can be set up to share specific tables between databases. While similar access can be achieved through Foreign Data Wrappers (which have improved in recent PostgreSQL releases), it may be a better solution to use Slony depending on the usage. If a large amount of data is needed to be fetched from one host to another, having Slony replicate that data means the needed data will already exist on the requesting node, eliminating long transfer time.
ClusterControl
Single Console for Your Entire Database Infrastructure
Find out what else is new in ClusterControl
Delayed Replication
Usually replication is desired to be as quick as possible, but there can be some scenarios where a delay is desired. The slon daemon for a slave node can be configured with a lag_interval, meaning it won’t receive any replication data until the data is old as specified. This can be useful for quick access to lost data if something goes wrong, for example if a row is deleted, it will exist on the slave for 1 hour for quick retrieval.
Things to Know:
- Any DDL changes to tables that are part of replication must be executed using the slonik execute command.
- Any table to be replicated must have either a primary key, or a UNIQUE index without nullable columns.
- Data that is replicated from the master node is replicated after any data may have been functionally generated. Meaning if data was generated using something like ‘random()’, the resulting number is stored and replicated on the slaves, rather than ‘random()’ being run again on the slave returning a different result.
- Adding Slony replication will increase server load slightly. While efficiently written, each table will have a trigger that logs each INSERT, UPDATE, and DELETE to a Slony table, expect about 2-10% server load increase, depending on database size and workload.
Tips and Tricks:
- Slony daemons can run on any host that has access to all other hosts, however the highest performing configuration is to have the daemons run on the nodes they are managing. For example, the master daemon running on the master node, the slave daemon running on the slave node.
- If setting up a replication cluster with a very large amount of data, the initial copy can take quite a long time, meaning all changes that happen from kickoff till the copy is done could mean even longer to catch up and be in sync. This can be solved by either adding a few tables at a time to replication (very time consuming), or by creating a data directory copy of the master database to the slave, then doing a ‘subscribe set’ with the OMIT COPY option set to true. With this option, Slony will assume that the slave table is 100% identical to the master, and not clear it out and copy data over.
- The best scenario for this is to create a Hot Standby using the built in tools for PostgreSQL , and during a maintenance window with zero connections modifying data, bring the standby online as a master, validate data matches between the two, initiate the slony replication cluster with OMIT COPY = true, and finally re-enable client connections. This may take time to do the setup for the Hot Standby, but the process won’t cause huge negative impact to clients.
Community and Documentation
The community for Slony can found in the mailing lists, located at http://lists.slony.info/mailman/listinfo/slony1-general, which also includes archives.
Documentation is available on the official website, http://slony.info/documentation/, and provides help with log analysis, and syntax specification for interfacing with slony.
↧
Luca Ferrari: Generating an italian 'Codice Fiscale' via plpgsql or plperl
PostgreSQL built-in plpgsql can be used to build stored procedure and, with a few tricks, to consume data and translate it into other forms. It is also possible to generate a so known codice fiscale, the italian string that represents the tax payer number based on the person’s name, birth date and place. This posts will show some concepts about how to generate the single pieces of the codice fiscale via plpgsql. And why not? Let’s compare it to a plperl implementation.
Generating an italian codice fiscale
In order to provide a quite complet example of usage of plpgsql for a course of mine, I developed a few functions to build up an italian codice fiscale (tax payer number). The idea is not to have a fully working implementation, rather to demonstrate usage of different operators and functions in plpgsql. And to compare its implementation with a plperl one.
The full rules for building up a codice fiscale are available here in italian. The code shown below is freely available on my GitHub PostgreSQL-related repository, and in particular there are two scripts:
In order to generate a full “codice fiscale” you need to extract some letters from the surname and the name, build a string representing both the date of birth and gender, a code representing the birth place and last comes a character that works as a checksum of all the previous parts.
In order to obtain the full result the following function can be used:
CREATEORREPLACEFUNCTIONcf.cf(surnametext,nametext,birth_datedate ↧
Pavel Stehule: short notice - pspg has integrated readline library now
Today I integrated readline support to pspg. What it is mean? Better comfort when search string is entered and mainly, persistent history of searched strings.
↧
↧
Michael Paquier: Manipulating checksums of a cluster
PostgreSQL 11 is releasing a small binary called pg_verify_checksums which is able to check if page-level checksums are in a sane state for a cluster which has been cleanly shutdown (this is necessary so as not not face checksum inconsistencies because of torn pages).
Thinking about it, it is not actually complicated to extend the tool in such a way that it enables and disables checksum for an offline cluster, which has been resulted in a tool that I called pg_checksums available here. This can compile with PostgreSQL 11, as it is has been integrated with the new set of routines which can be used if a data folder allows read permissions for a group. Note that it is not complicated to make that work with past versions as well and requires a couple of minutes, but I keep any code in this tree simple of any cross-version checks.
So, pg_checksums gains a couple of options compared to its parent:
- Addition of an –action option, which can be set to “verify” to do what pg_verify_checksums does, “enable” to enable checksums on a cluster, and “disable” to do the reverse operation. “disable” costs nothing as it is just a matter of updating the control file of the cluster. “enable” costs a lot as it needs to update all the page’s checksums and then update the control file. For both things a sync of the data folder is done.
- Addition of a –no-sync option, which disables the final fsync calls in charge of making the switch durable. This can be useful for automated testing environments.
So imagine that you have a cluster with checkums disabled, and stopped cleanly, then here is how to enable checksums:
$ pg_controldata -D $PGDATA | grep checksum
Data page checksum version:           0
$ pg_checksums --action enable -D $PGDATA
Checksum operation completed
Data checksum version: 0
Files operated:  1224
Blocks operated: 3684
Enabling checksums in cluster
$ pg_controldata -D $PGDATA | grep checksum
Data page checksum version:           1
Then let’s look at the state of the page checksummed:
$ pg_checksums --action verify -D $PGDATA
Checksum operation completed
Data checksum version: 1
Files operated:  1224
Blocks operated: 3684
Bad checksums:  0
And all looks good. This is a tool I wanted for some time, which is kept in the box for some upgrade scenarios where an existing cluster was not initialized with checksums, or has been forgotten to be set so.
Note as well that Michael Banck has also released a similar version of this tool which can be found here, so the work has been done twice in parallel. Note that this version is compatible with past PostgreSQL versions, which is something I am too lazy to maintain within pg_plugins. Note that the option interface is also slightly different, but the basics are the same. And the name is funnily the same :)
And thanks to Magnus Hagander and Daniel Gustafsson who authored the parent utility now in upstream code.
↧
Dimitri Fontaine: PostgreSQL Data Types: Arrays
Continuing our series of PostgreSQL Data Types today we’re going to introduce the PostgreSQL array data types.
Arrays can be used to denormalize data and avoid lookup tables. A good rule of thumb for using them that way is that you mostly use the array as a whole, even if you might at times search for elements in the array. Heavier processing is going to be more complex than a lookup table.
↧
Baron Schwartz: How To Index Your Database
Do you know what database indexes are and how they work? Do they seem hard to understand? They don’t have to be. The basic principles you need to know are simple and easy to remember. And developers need to know the basics of indexing: your DBAs can’t save you, because discovering you need an index after you deploy a feature is often too little, too late.
↧
Shaun M. Thomas: PG Phriday: Securing PgBouncer
We all love PgBouncer. It’s a great way to multiplex tens, hundreds, or even thousands of client connections to a small handful of Postgres sessions. What isn’t necessarily so endearing, is that it can’t pass authentication from itself to Postgres, as each Postgres session may exist before the connection to PgBouncer is established. Or can it? Let’s explore how things have evolved, but the news never really got out.
Tell you what I got in mind
As a proxy, PgBouncer authenticates on a per user/database basis. Since Postgres authenticates sessions before they connect, PgBouncer used to have no way to re-auth its own connections. The old, and probably most prevalent way to circumvent this, was to build a userlist.txt file that contained every user and password hash that should be allowed to connect through PgBouncer.
But is that what we really want? This means there’s a static record of every username and password combination on disk. It also means any time a password in the list changes, we must regenerate that file. In a world of databases, this kind of denormalization isn’t ideal.
Luckily we can fix it, though there are several steps involved. We should also note that the default value of auth_query is a direct query to pg_shadow. This is generally bad practice, and the official documentation includes a more secure example using a callable function. We will be using a derived example for this demonstration.
What I have, I knew was true
To keep things simple, we’ll assume there’s a local pgbouncer running as the postgres OS user. One benefit to this, is that we can lock down Postgres itself to only allow local connections as well. This prevents users from connecting to Postgres directly, even if they had the full connection string to do so.
For a setup like this, we might find this line or something similar in the pgbouncer.ini file, under the [databases] heading:
[databases]

* = host=localhost auth_user=pgbouncer
This particular line means any PgBouncer session will connect to the Postgres server running on 127.0.0.1 or ::1 only. It also makes use of the new auth_user syntax that makes all of this magic work properly. With that enabled, there’s only one more change we need to make to PgBouncer itself.
Won’t you ever set me free?
In the [pgbouncer] section of the pgbouncer.ini file, we need to specify a query. In the documentation, they use an example that directly interrogates the pg_shadow view. This view, and the underlying pg_authid table where Postgres stores authentication, are only available to superusers by default.
Do we really want PgBouncer to operate as a superuser? Of course not! If we use a set-returning function instead, PgBouncer can obtain credentials for comparison without being a superuser. This is how we set it up in our configuration under the [pgbouncer] section of the config:
[pgbouncer]

auth_type = md5
auth_file = /etc/pgbouncer/userlist.txt
auth_query = SELECT * FROM pgbouncer.get_auth($1)
Once we’ve made these changes, we just need to supply two things:
- The
pgbouncerPostgres user. - The
get_authset-returning function.
But to me there’s no surprise
First, let’s start by creating the pgbouncer Postgres user. This allows PgBouncer to connect as itself and invoke the get_auth function.
CREATE USER pgbouncer WITH PASSWORD 'changeme';
Note how we did nothing but create the user and give it a password. It has no special privileges, and currently no extra grants. Now as the postgres OS user, we can export this information to the userlist.txt file that used to be required for all users.
cat <> ~/.pgpass
chmod 600 ~/.pgpass
The second step either creates, or appends our user to, a .pgpass file for the Postgres user. PgBouncer makes use of libpq, the global API library used for establishing and interacting with Postgres sessions. If such a file exists, specific passwords are automatically supplied if they match a corresponding entry. We chose to only allow pgbouncer to supply the password when connecting locally.
We also need to ensure this line is somewhere near the top of our pg_hba.conf file for Postgres itself:
host all pgbouncer 127.0.0.1/32 md5
This ensures PgBouncer can only connect locally, and only via the password we created.
This waitin’ ’round’s killin’ me
This still leaves the necessary authentication retrieval function. This is the tricky part that can easily go wrong. Let’s start with the function itself:
CREATE SCHEMA pgbouncer AUTHORIZATION pgbouncer;

CREATE OR REPLACE FUNCTION pgbouncer.get_auth(p_usename TEXT)
RETURNS TABLE(username TEXT, password TEXT) AS
$$
BEGIN
    RAISE WARNING 'PgBouncer auth request: %', p_usename;

    RETURN QUERY
    SELECT usename::TEXT, passwd::TEXT FROM pg_catalog.pg_shadow
     WHERE usename = p_usename;
END;
$$ LANGUAGE plpgsql SECURITY DEFINER;
To keep things organized, we placed the function in its own schema. This will need to exist in any database where PgBouncer will proxy clients. Note that we also specifically prepended the pg_shadow view with the pg_catalog schema. This is necessary to prevent an attacker from supplying a substitute search path and obtaining data from an arbitrary table. Even though the pgbouncer user is not a superuser, it’s good to be thorough.
We even raise a warning any time PgBouncer authenticates instead of Postgres. This will log the attempt to the Postgres logs in most cases for auditing purposes. We use WARNING here because that’s the default setting for log_min_messages. In systems that use a lower value like NOTICE, our function could follow suit.
Things go wrong, they always do
Despite these safeguards, eagle-eyed readers are probably already cringing. Why? Let’s connect as the pgbouncer user and call our function.
SELECT * FROM pgbouncer.get_auth('postgres');

 usename  |               passwd
----------+-------------------------------------
 postgres | md54aeec1a9950d60e0d3e98a5b136222f0
Isn’t that what we wanted? Yes and no. We created the function as the postgres superuser, and we never granted use of the function to anyone. Yet the pgbouncer user can invoke it. This is due primarily to how Postgres implements function security. While functions can execute SQL, they’re more commonly associated with calculations. Think set theory: f(x) = y. Thus functions are automatically granted access to PUBLIC, an alias for all users.
So the function that circumvents the security of pg_shadow is now callable by every user in the database. Oops!
To really lock this down, we need to explicitly revoke permissions, and then grant them only to the pgbouncer user.
REVOKE ALL ON FUNCTION pgbouncer.get_auth(p_usename TEXT) FROM PUBLIC;
GRANT EXECUTE ON FUNCTION pgbouncer.get_auth(p_usename TEXT) TO pgbouncer;
Once we’ve done that, this is what we should see if we use any user other than pgbouncer:
SELECT * FROM pgbouncer.get_auth('postgres');

ERROR:  permission denied for function get_auth
That was a close one!
Everything that’s serious lasts
Once we reload Postgres and PgBouncer, all of these changes should activate. Now we never have to update userlist.txt unless we change the pgbouncer password itself. We also log any password auth attempt to Postgres in case the pgbouncer user is compromised and someone invokes a dictionary attack against our function. Can we go even further? Sure:
- Exclude superusers from being returned in the auth function at all. Elevated privilege users or roles should not connect through the proxy. This prevents accidentally or maliciously exposing superuser password hashes to PgBouncer.
- Add a
WHEREclause so the function can only auth against specific users. This ensures only front-end connections can operate through the proxy and are thus compatible with the auth function. - Join against
pg_auth_membersand only allow users within certain groups. This is the same as the previous point, but more generally useful. Users within ause_proxygroup for example, would allow us to control authentication with a simple GRANT statement, rather than modifying the function.
With all of those in mind, a more secure version of our query might look like this:
SELECT u.rolname::TEXT, u.rolpassword::TEXT
  FROM pg_authid g
  JOIN pg_auth_members m ON (m.roleid = g.oid)
  JOIN pg_authid u ON (u.oid = m.member)
 WHERE NOT u.rolsuper
   AND g.rolname = 'use_proxy'
   AND u.rolname = p_username;
There really is no limit to how we can secure or otherwise enhance this function. However, if we truly had our preferences, PgBouncer would call a function and pass in the username and password values as parameters. This would allow the function to return merely a True or False answer if authentication is allowed, and not directly expose password hashes to a tertiary layer.
Unfortunately that by itself would be a security flaw. In many production systems full query logging is enabled, which writes a query and its parameters to the Postgres log. Giving an in-memory binary access to hashes is much different than directly exposing unsalted passwords in a plain-text log. Even if the function accepted a salted and hashed password, having these in the log would still be unnecessarily permissive.
But beyond that, we still have access to a far more versatile approach than before. Hopefully it starts to catch on instead of languishing in relative obscurity. PgBouncer is too good of a tool to allow one of its best features to go unused. If you’re not already using auth_user and auth_query, why not give it a try?
↧
↧
Devrim GÜNDÜZ: Installing pgAdmin4 3.X on RHEL / CentOS 7 and Fedora 27
pgAdmin4 3.0 was recently released, and I made significant changes on the RPMS for better usability and better upgrade path. In this blog post, I'll mention about the details of what has changed from packaging point of view.
Continue reading "Installing pgAdmin4 3.X on RHEL / CentOS 7 and Fedora 27"
Continue reading "Installing pgAdmin4 3.X on RHEL / CentOS 7 and Fedora 27"
↧
Adrian Klaver: Building dynamic SQL using psycopg2
It has been awhile since I posted anything. Thought I would start back with a software package I use in many different situations, psycopg2 . Psycopg2 is a Python database adapter for Postgres that follows the Python DB API. It … Continue reading
↧
Laurenz Albe: What’s in an xmax?

xmax is a PostgreSQL system column that is used to implement Multiversion Concurrency Control (MVCC). The documentation is somewhat terse:
The identity (transaction ID) of the deleting transaction, or zero for an undeleted row version. It is possible for this column to be nonzero in a visible row version. That usually indicates that the deleting transaction hasn’t committed yet, or that an attempted deletion was rolled back.
While this is true, the presence of “weasel words” like “usually” indicates that there is more to the picture. This is what I want to explore in this article.
The two meanings of xmax
I’ll follow the PostgreSQL convention to use the word “tuple” for “row version” (remember that PostgreSQL implements MVCC by holding several versions of a row in the table).
xmax is actually used for two purposes in PostgreSQL:
- It stores the transaction ID (“
xid”) of the transaction that deleted the tuple, like the documentation says. Remember thatUPDATEalso deletes a tuple in PostgreSQL! - It stores row locks on the tuple.
This is possible, because a tuple cannot be locked and deleted at the same time: normal locks are only held for the duration of the transaction, and a tuple is deleted only after the deleting transaction has committed.
Storing row locks on the tuple itself has one vast advantage: it avoids overflows of the “lock table”. The lock table is a fixed-size area that is allocated in shared memory during server startup and could easily be too small to hold all the row locks from a bigger transaction. To cope with this, you’d need techniques like “lock escalation” that are difficult to implement, impact concurrency and lead to all kinds of nasty problems.
There is also a down side to storing row locks in the tuple: each row lock modifies the table, and the modified blocks have to be written back to persistent storage. This means that row locks lead to increased I/O load.
But a number of questions remain:
- How can you tell which of the two meanings
xmaxhas in a tuple? - How can I tell if
xmaxis valid or not? - How exactly are row locks stored?
We will dive deeper in the rest of this article to answer these questions.
An example
In the following, I’ll use a simple schema for demonstration. I am using PostgreSQL v10, but this hasn’t changed in the last couple of releases.
CREATE TABLE parent(
   p_id integer PRIMARY KEY,
   p_val text
);

CREATE TABLE child(
   c_id integer PRIMARY KEY,
   p_id integer REFERENCES parent(p_id),
   c_val text
);

INSERT INTO parent (p_id, p_val)
   VALUES (42, 'parent');
Now let’s look at the relevant system columns:
session1=# SELECT ctid, xmin, xmax, p_id, p_val FROM parent;

 ctid  | xmin  | xmax | p_id | p_val
-------+-------+------+------+--------
 (0,1) | 53163 |    0 |   42 | parent
(1 row)
This is the simple view we expect to see: ctid is the physical location of the tuple (Block 0, item 1), xmin contains the ID of the inserting transaction, and xmax is zero because the row is alive.
Now let’s start a transaction in session 1 and delete the row:
session1=# BEGIN;
session1=# DELETE FROM parent WHERE p_id = 42;
Then session 2 can see that xmax has changed:
session2=# SELECT ctid, xmin, xmax, p_id, p_val FROM parent;

 ctid  | xmin  | xmax  | p_id | p_val
-------+-------+-------+------+--------
 (0,1) | 53163 | 53165 |   42 | parent
(1 row)
But wait, we change our mind in session 1 and undo the change:
session1=# ROLLBACK;
To find out what xmax means in this case, let’s call in the cavalry.
pageinspect comes to the rescue
PostgreSQL comes with a “contrib” module called pageinspect that can be used to examine the actual contents of table blocks. It is installed with
CREATE EXTENSION pageinspect;
We’ll use two of its functions:
get_raw_page: reads one 8kB block from the table’s data fileheap_page_item_attrs: for each tuple in a data block, this returns the tuple metadata and data
Needless to say, these functions are superuser only.
heap_page_item_attrs returns an integer field named t_infomask that contains several flags, some of which tell us the meaning of xmax. To get the full story, you’ll have to read the code in src/include/access/htup_details.h.
Let’s have a look at table block 0, which contains our tuple:
session2=# SELECT lp,
       t_ctid AS ctid,
       t_xmin AS xmin,
       t_xmax AS xmax,
       (t_infomask & 128)::boolean AS xmax_is_lock,
       (t_infomask & 1024)::boolean AS xmax_committed,
       (t_infomask & 2048)::boolean AS xmax_rolled_back,
       (t_infomask & 4096)::boolean AS xmax_multixact,
       t_attrs[1] AS p_id,
       t_attrs[2] AS p_val
FROM heap_page_item_attrs(
        get_raw_page('parent', 0),
        'parent'
     );

-[ RECORD 1 ]----+-----------------
lp               | 1
ctid             | (0,1)
xmin             | 53163
xmax             | 53165
xmax_is_lock     | f
xmax_committed   | f
xmax_rolled_back | f
xmax_multixact   | f
p_id             | \x2a000000
p_val            | \x0f706172656e74
The attributes p_id and p_val are displayed in binary form.
The information in the tuple doesn’t tell us whether the transaction that set xmax has been committed or rolled back, so we (and PostgreSQL when it inspects the tuple) still don’t know what to make of xmax. That is because PostgreSQL does not update the tuple when a transaction ends.
To resolve that uncertainty, we’d have to look at the commit log that stores the state of each transaction. The commit log is persisted in the pg_xact subdirectory of the PostgreSQL data directory (pg_clog in older versions).
A SELECT that modifies data
We cannot examine the commit log from SQL, but when any database transaction reads the tuple and looks up the commit log, it will persist the result in the tuple so that the next reader does not have to do it again (this is called “setting the hint bits”).
So all we have to do is to read the tuple:
session2=# SELECT ctid, xmin, xmax, p_id, p_val FROM parent;

 ctid  | xmin  | xmax  | p_id | p_val
-------+-------+-------+------+--------
 (0,1) | 53163 | 53165 |   42 | parent
(1 row)
This changes the information stored in the tuple. Let’s have another look with pageinspect:
-[ RECORD 1 ]----+-----------------
lp               | 1
ctid             | (0,1)
xmin             | 53163
xmax             | 53165
xmax_is_lock     | f
xmax_committed   | f
xmax_rolled_back | t
xmax_multixact   | f
p_id             | \x2a000000
p_val            | \x0f706172656e74
The SELECT statement has set the flags on the tuple, and now we can see that xmax is from a transaction that was rolled back and should be ignored.
As an aside, that means that the first reader of a tuple modifies the tuple, causing surprising write I/O. This is annoying, but it is the price we pay for instant COMMIT and ROLLBACK. It is also the reason why it is a good idea to either use COPY … (FREEZE) to bulk load data or to VACUUM the data after loading.
Now we know how to determine if xmax is from a valid transaction or not, but what about row locks?
Row locks and xmax
Rows are locked by data modifying statements, but there is a simple way to lock a row without inserting or deleting tuples:
session1=# BEGIN;
session1=# SELECT * FROM parent WHERE p_id = 42 FOR UPDATE;

 p_id | p_val
------+--------
   42 | parent
(1 row)
Now what does pageinspect tell us?
-[ RECORD 1 ]----+-----------------
lp               | 1
ctid             | (0,1)
xmin             | 53163
xmax             | 53166
xmax_is_lock     | t
xmax_committed   | f
xmax_rolled_back | f
xmax_multixact   | f
p_id             | \x2a000000
p_val            | \x0f706172656e74
We see that the row is locked. In this case, it is a FOR UPDATE lock, but the query does not distinguish between the lock modes for simplicity’s sake. You’ll notice that xmax again is neither committed nor rolled back, but we don’t care because we know it is a row lock.
xmax is set to 53166, which is the transaction ID of the locking transaction. Let’s close that transaction to continue:
session1=# COMMIT;
PostgreSQL does not have to set hint bits here — if xmax contains a row lock, the row is active, no matter what the state of the locking transaction is.
If you think you have seen it all, you are in for a surprise.
Multiple locks on a single row
In the previous example we have seen that PostgreSQL stores the transaction ID of the locking transaction in xmax. This works fine as long as only a single transaction holds a lock on that tuple. With exclusive locks like the one that SELECT … FOR UPDATE takes, this is always the case.
But PostgreSQL also knows other row locks, for example the FOR KEY SHARE lock that is taken on the destination of a foreign key constraint to prevent concurrent modification of the keys in that row. Let’s insert some rows in the child table:
session1=# BEGIN;
session1=# INSERT INTO child (c_id, p_id, c_val)
   VALUES (1, 42, 'first');

session2=# BEGIN;
session2=# INSERT INTO child (c_id, p_id, c_val)
   VALUES (2, 42, 'second');
Now let’s look at our parent row again:
-[ RECORD 1 ]----+-----------------
lp               | 1
ctid             | (0,1)
xmin             | 53163
xmax             | 3
xmax_is_lock     | t
xmax_committed   | f
xmax_rolled_back | f
xmax_multixact   | t
p_id             | \x2a000000
p_val            | \x0f706172656e74
That “3” in xmax cannot be a transaction ID (they keep counting up), and the xmax_multixact flag is set.
This is the ID of a “multiple transaction object”, called “mulitxact” in PostgreSQL jargon for lack of a better word. Such objects are created whenever more than one transaction locks a row, and their IDs are also counted up (you can tell that this database needs few of them). Multixacts are persisted in the pg_multixact subdirectory of the data directory.
You can get information about the members of a multixact with the undocumented pg_get_multixact_members function:
session2=# SELECT * FROM pg_get_multixact_members('3');
  xid  | mode
-------+-------
 53167 | keysh
 53168 | keysh
(2 rows)
Now you really know what is in an xmax!
The post What’s in an xmax? appeared first on Cybertec.
↧


