Quantcast
Channel: Planet PostgreSQL
Viewing all 9767 articles
Browse latest View live

Niksa Jakovljevic: How to manage Prometheus high-availability with PostgreSQL + TimescaleDB

$
0
0

Prometheus has become one of the most commonly used open-source monitoring and alerting systems. What makes Prometheus so great is that it solves monitoring problems in a simple and effective way. Yet there are still challenges with operating Prometheus, including long-term storage and managing high-availability.

In a previous post, we describe how and why to use PostgreSQL + TimescaleDB for enabling long-term storage (as well as for simplifying operations, and adding query power/flexibility) to Prometheus.

Uniting SQL and NoSQL for Monitoring: Why PostgreSQL is the ultimate data store for Prometheus

In this post, we describe how PostgreSQL + TimescaleDB can also help with managing high-availability.

There are several reasons why to add high-availability (HA) to Prometheus deployments:

  • Avoiding data loss and a single point of failure
  • Avoiding missing any critical alerts generated by an Alertmanager
  • Replicating Prometheus data (although the data will not be fully consistent between replicas — more on this later)

Setting up HA for Prometheus requires running two of more identically configured Prometheus servers in parallel. Yet this simple setup does come with limitations.

One problem is that it can be hard to keep data in sync. Often parallel Prometheus instances do not have identical data. There are few reasons for this. One reason is that scrape intervals may differ, since each instance has its own clock. Another reason is that, in case of instance failures, either of the Prometheus nodes may miss some data, which would mean that in the long run none of the Prometheus instances would have a complete data set. In other words, there would be no single source of truth.

Another problem is with remote storage. When running HA Prometheus with remote storage, one can decide to just have a separate remote storage for each Prometheus instance. But this approach, while valid, does introduce other weaknesses: again, no ground truth; the complexity of operating multiple remote storage instances; and hardware costs.

Given these limitations, it would seem that having shared remote storage across Prometheus nodes would be beneficial: it would establish a single ground truth while minimizing operational overhead.

This is the problem that version 0.4 of our prometheus-postgresql-adapter aims to address. In this latest version, we add support for leader election to allow one to use a single PostgreSQL/TimescaleDB instance as a shared remote storage and the single source of ground truth for an HA Prometheus deployment. And, in particular, we do this using some of the concurrency control features native to PostgreSQL.

Running our new adapter is as simple as adding few configuration parameters. Let’s look at an example to see how it works.

How it works

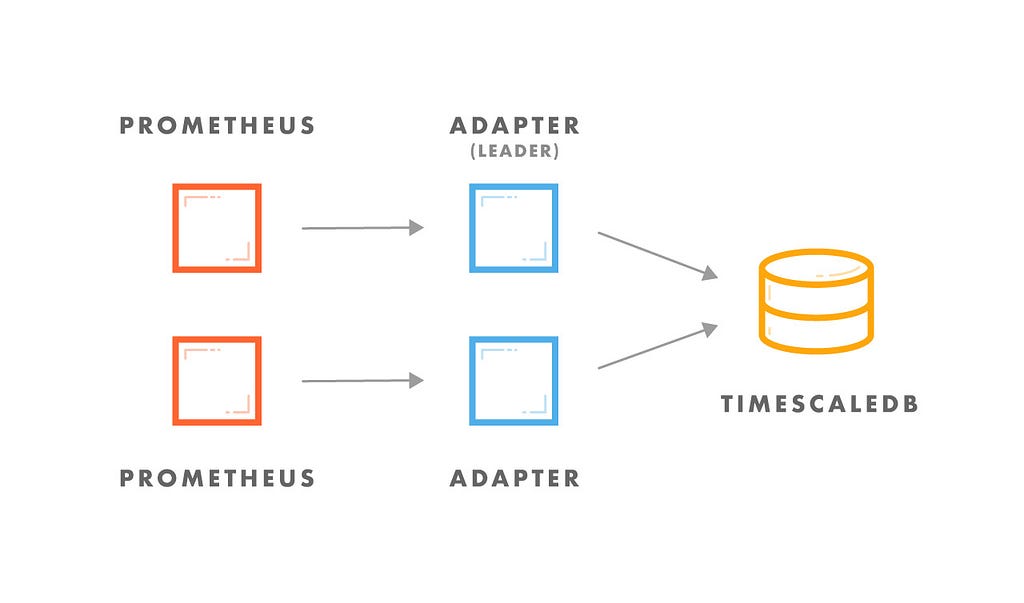
On a high level our HA setup looks like this: each Prometheus instance talks to one adapter which writes data to TimescaleDB. To prevent duplicate writes, one adapter is elected as a leader, and only the leader is allowed to write to the database. The leader election happens in the background between adapters within the same HA group (more about leader election after the example).

Let’s see it in action. Here is an example `prometheus.yml` for the first Prometheus instance:

global:
scrape_interval: 5s
evaluation_interval: 10s
scrape_configs:
- job_name: prometheus
static_configs:
- targets: ['localhost:9091']
remote_write:
- url: "http://localhost:9201/write"
remote_read
:
- url: "http://localhost:9201/read"
read_recent
: true

And here is prometheus.yml for the second Prometheus instance:

global:
scrape_interval: 5s
evaluation_interval: 10s
scrape_configs:
- job_name: prometheus
static_configs:
- targets: ['localhost:9092']
remote_write:
- url: "http://localhost:9202/write"
remote_read
:
- url: "http://localhost:9202/read"
read_recent
: true

Nothing fancy here, as this is pretty basic Prometheus configuration. The main difference between these two configs is the remote write/read url (each instance sends data to its own adapter thus different port numbers for each).

Now let’s start two Prometheus instances (make sure that prometheus.yml is in the same path as the binary):

./prometheus --storage.tsdb.path=data1/
./prometheus --web.listen-address=:9092 --storage.tsdb.path=data2/

And let’s start two Prometheus adapters:

./prometheus-postgresql-adapter -log.level=debug -leader-election.pg-advisory-lock-id=1 -leader-election.pg-advisory-lock.prometheus-timeout=6s
./prometheus-postgresql-adapter -web.listen-address=:9202 -leader-election.pg-advisory-lock-id=1 --log.level=debug -leader-election.pg-advisory-lock-id=1 -leader-election.pg-advisory-lock.prometheus-timeout=6s

Since both adapters belong to the same Prometheus HA group, they run with the same value for -leader-election.pg-advisory-lock-id=1.

We set leader-election.pg-advisory-lock.prometheus-timeout to 6s because our Prometheus scrape interval is 5s, which means that each adapter should get a request from Prometheus every 5 seconds. If a request doesn’t come within 6 seconds, the adapter will assume that its Prometheus instance died, and the adapter will resign from being a leader.

If we look into the log of the first adapter, we should see something like:

level=debug caller=log.go:21 msg="Lock obtained for group id 1"
level=info caller=log.go:25 msg="Initialized leader election based on PostgreSQL advisory lock"
level=info caller=log.go:25 msg="Starting up..."
level=info caller=log.go:25 msg=Listening addr=:9201
level=debug caller=log.go:21 msg="Wrote samples" count=51 duration=0.061607509
level=debug caller=log.go:21 msg="Wrote samples" count=81 duration=0.020131404
level=info caller=log.go:25 msg="Samples write throughput" samples/sec=51
level=debug caller=log.go:21 msg="Wrote samples" count=81 duration=0.014755038
level=info caller=log.go:25 msg="Samples write throughput" samples/sec=81

Log output from the second adapter:

level=info caller=log.go:25 msg="Initialized leader election based on PostgreSQL advisory lock"
level=info caller=log.go:25 msg="Starting up..."
level=info caller=log.go:25 msg=Listening addr=:9202
level=debug caller=log.go:21 msg="Election id 1: Instance is not a leader. Can't write data"
level=info caller=log.go:25 msg="Samples write throughput" samples/sec=0
level=debug caller=log.go:21 msg="Election id 1: Instance is not a leader. Can't write data"
level=info caller=log.go:25 msg="Samples write throughput" samples/sec=0

In other words, we can see that the first adapter has obtained the lock and became a leader (i.e., only the first adapter can write to the database).

Now let’s stop the first Prometheus instance and see what happens. Log output from the first adapter:

level=warn caller=log.go:29 msg="Prometheus timeout exceeded" timeout=6s
level=warn caller=log.go:29 msg="Scheduled election is paused. Instance is removed from election pool"
level=info caller=log.go:25 msg="Instance is no longer a leader"
level=debug caller=log.go:21 msg="Scheduled election is paused. Instance can't become a leader until scheduled election is resumed (until Prometheus comes up again)"

Log output from the second adapter:

level=debug caller=log.go:21 msg="Lock obtained for group id 1"
level=debug caller=log.go:21 msg="Wrote samples" count=100 duration=0.035791517
level=info caller=log.go:25 msg="Samples write throughput" samples/sec=0
level=debug caller=log.go:21 msg="Wrote samples" count=100 duration=0.013215907
level=info caller=log.go:25 msg="Samples write throughput" samples/sec=100
level=debug caller=log.go:21 msg="Wrote samples" count=100 duration=0.010737419

As we can see from the above log, the first adapter hasn’t received a request within 6 seconds, and so decided to resign from leader role. The built-in adaptive failover mechanism has taken care of re-electing the leader. The second adapter was automatically elected as a leader and started writing metrics into the database.

Let’s dig a bit deeper and see how adapter leader election works.

How adapter leader election works

Since each Prometheus instance has its own adapter, we need to find a way to coordinate between the adapters and allow only one to write into PostgreSQL/TimescaleDB. This is actually a common problem in distributed systems where one needs to select one node as a leader and allow writes only from that node. In other words, we need a mechanism for leader election.

There are several ways for electing a leader in distributed systems: using a consensus algorithm like Raft, or perhaps simply racing to acquire a shared mutex (lock). If we want stronger semantics, we might choose an approach like the former and have a cluster of adapters. But given the weaker semantic needs here, we instead adopted something simpler with far less operational complexity.

Before jumping into details, let’s try to understand what semantics you get when running HA Prometheus.

Prometheus is a sampling-based metrics system which means it doesn’t care about individual events, but more about trends.

“In general a metrics-based monitoring system [like Prometheus] is not suitable for anything that cares about individual increments” — Prometheus developer Brian Brazil

As we mentioned earlier, there are no guarantees that multiple Prometheus instances (even within the same high-availability group) will have the same data. Due to the fact each Prometheus instance adds timestamp information to the sample, and that this timestamp is based on its local clock rather than the clock of the server or infrastructure it is monitoring, it is even more likely that the data will not be consistent. Because of this, simply eliminating identical, repeated values (e.g., using UPSERTS and UNIQUE constraints) will not solve the problem.

In this context, we’ve decided to implement leader election based on a shared lock. ZooKeeper and Consul are commonly used for coordinating between nodes, but there are also other options more easily available.

In fact, PostgreSQL supports an application meaningful lock, called an advisory lock. Since we store metrics data in PostgreSQL/TimescaleDB, it would also make sense to use PostgreSQL for coordination among our adapters.

Here’s how it works. Once started, each adapter instance tries to obtain a lock and become a leader. The first one to succeed becomes the leader. If an instance (either adapter or Prometheus) goes down, it will automatically drop the lock so another instance is able to take over and become a leader. The lock is exclusive and only one instance can hold the lock at a time. The advantage with the PostgreSQL advisory lock is that no additional metadata needs to be maintained since PostgreSQL manages lock lifecycle.

Adapters are not persisting any data so there are no strong guarantees during the failover (i.e., some data loss/duplication is possible during the election window of few hundred milliseconds). This seems like a reasonable trade off if you take into account the semantics of Prometheus data explained above.

Alternatives

There are also other options for adapter coordination.

If you are running your services in Kubernetes then you can use the etcd key-value store that already backs all the cluster data. There is an existing Docker image that implements leader election based on etcd that can run as a sidecar with an adapter and provide leader information through HTTP endpoint. The main drawback with this solution is that it requires an etcd cluster.

To support additional leader election mechanisms (e.g. based on etcd, ZooKeeper, etc.) we’ve provided a REST interface that allows to easily plug-in an external leader election mechanism if needed.

Read and write performance

The latest version of our adapter can be configured to run in read-only mode. This is useful if you’re using PostgreSQL/TimescaleDB replication: you can point the adapter to read replicas to get better read performance.

Recently we’ve improved adapter write performance. Our latest adapter also includes optimizations that yield 6x higher write throughput than before (introduced in version 0.3).

Next steps

To get started with the adapter have a look at the tutorial, or visit our Github and grab the latest binaries.

If you are new to TimescaleDB, you can learn more here, and follow our installation instructions to get started.

Like this post and interested in learning more?

Follow us here on Medium, check out our GitHub, join our Slack community, and sign up for the community mailing list below.

https://medium.com/media/33dd73ea2367bc6df20f5bace9ed9b27/href

How to manage Prometheus high-availability with PostgreSQL + TimescaleDB was originally published in Timescale on Medium, where people are continuing the conversation by highlighting and responding to this story.


Sebastian Insausti: A New Way to Personalize Your PostgreSQL Monitoring with Prometheus

$
0
0

Monitoring is one of the fundamental tasks in any system. It can help us to detect problems and take action, or simply to know the current state of our systems. Using visual displays can make us more effective as we can easier detect performance problems.

In this blog, we will see how to use SCUMM to monitor our PostgreSQL databases and what metrics we can use for this task. We’ll also go through the dashboards available, so you can easily figure out what’s really happening with your PostgreSQL instances.

What is SCUMM?

First of all, let’s see what is SCUMM (Severalnines CMON Unified Monitoring and Management ).

It’s a new agent-based solution with agents installed on the database nodes.

The SCUMM Agents are Prometheus exporters which export metrics from services like PostgreSQL as Prometheus metrics.

A Prometheus server is used to scrape and store time series data from the SCUMM Agents.

Prometheus is an open-source system monitoring and alerting toolkit originally built at SoundCloud. It is now a standalone open source project and maintained independently.

Prometheus is designed for reliability, to be the system you go to during an outage to allow you to quickly diagnose problems.

How to use SCUMM?

When using ClusterControl, when we select a cluster, we can see an overview of our databases, as well as some basic metrics that can be used to identify a problem. In the below dashboard, we can see a master-slave setup with one master and 2 slaves, with HAProxy and Keepalived.

ClusterControl Overview

If we go to the “Dashboards” option, we can see a message like the following.

ClusterControl Dashboards Disabled

To use this feature, we must enable the agent mentioned above. For this, we only have to press on the "Enable Agent Based Monitoring" button in this section.

ClusterControl Enable Agent Based Monitoring

To enable our agent, we must specify the host where we will install our Prometheus server, which, as we can see in the example, can be our ClusterControl server.

We must also specify:

  • Scrape Interval (seconds): Set how often the nodes are scraped for metrics. Default is 10 seconds.
  • Data Retention (days): Set how long the metrics are kept before being removed. Default is 15 days.
ClusterControl Activity Section

We can monitor the installation of our server and agents from the Activity section in ClusterControl and, once it is finished, we can see our cluster with the agents enabled from the main ClusterControl screen.

ClusterControl Agents Enabled

Dashboards

Having our agents enabled, if we go to the Dashboards section, we would see something like this:

ClusterControl Dashboards Enabled

We have three different kinds of dashboards available, System Overview, Cross Server Graphs, and PostgreSQL Overview. The last one is what we see by default when entering this section.

ClusterControl Dashboards Selection

Here we can also specify which node to monitor, the time range and the refresh rate.

ClusterControl Dashboard Options

In the configuration section, we can enable or disable our agents (Exporters), check the agents status and verify the version of our Prometheus server.

ClusterControl Dashboard Configuration

PostgreSQL Overview Metrics

Let's see now what metrics we have available for each of our PostgreSQL databases (all of them for the selected node).

  • SELECT (fetched): Amount of rows selected (fetched) for each database. The fetched rows refer to live rows fetched from the table.
  • SELECT (returned): Amount of rows selected (returned) for each database. The returned rows refer to all rows read from the table, which includes dead rows and not--yet committed rows (in contrast with the fetched rows that counts only the live tuples).
  • INSERT: Amount of rows inserted for each database.
  • UPDATE: Amount of rows updated for each database.
  • DELETE: Amount of rows deleted for each database.
  • Active Sessions: Amount of active sessions (min, max, and average) for each database.
  • Idle Sessions: Amount of idle sessions (min, max, and average) for each database.
  • Lock Tables: Amount of locks (min, max, and average) separated by type for each database.
  • Disk IO Utilization: Server disk IO utilization.
  • Disk Usage: Percentage server disk usage (min, max and average).
  • Disk Latency: Server disk latency.
ClusterControl PostgreSQL Overview Metrics

System Overview Metrics

To monitor our system, we have available for each server the following metrics (all of them for the selected node):

  • System Uptime: Time since the server is up.
  • CPUs: Amount of CPUs.
  • RAM: Amount of RAM memory.
  • Memory Available: Percentage of RAM memory available.
  • Load Average: Min, max and average server load.
  • Memory: Available, total and used server memory.
  • CPU Usage: Min, max and average server CPU usage information.
  • Memory Distribution: Memory distribution (buffer, cache, free and used) on the selected node.
  • Saturation Metrics: Min, max, and average of IO load and CPU load on the selected node.
  • Memory Advanced Details: Memory usage details like pages, buffer and more, on the selected node.
  • Forks: Amount of forks processes. Fork is an operation whereby a process creates a copy of itself. It is usually a system call, implemented in the kernel.
  • Processes: Amount of processes running or waiting on the Operating System.
  • Context Switches: A context switch is the action of storing the state of a process or of a thread.
  • Interrupts: Amount of interrupts. An interrupt is an event that alters the normal execution flow of a program and can be generated by hardware devices or even by the CPU itself.
  • Network Traffic: Inbound and outbound network traffic in KBytes per second on the selected node.
  • Network Utilization Hourly: Traffic sent and received in the last day.
  • Swap: Swap usage (free and used) on the selected node.
  • Swap Activity: Reads and writes data on swap.
  • I/O Activity: Page in and page out on IO.
  • File Descriptors: Allocated and limit file descriptors.
ClusterControl System Overview Metrics

Cross Server Graphs Metrics

If we want to see the general state of all our servers we can use this dashboard with the following metrics:

  • Load Average: Servers load average for each server.
  • Memory Usage: Percentage of memory usage for each server.
  • Network Traffic: Min, max and average kBytes of network traffic per second.
ClusterControl Cross Server Graphs Metrics

Conclusion

There are multiple ways to monitor PostgreSQL. ClusterControl provides both agentless and now agent-based monitoring through Prometheus. It provides higher resolution monitoring data, as well as different dashboards to understand database performance. ClusterControl can also integrate with external tools like Slack or PagerDuty for alerting.

Pavel Stehule: Pager for data

$
0
0
Any Unix like systems has great feature - a pager. The history of pagers is pretty old. Originally was used manually. The result of some programs can be redirected to any program with pipe operator.

ls -la | more

One, most simple pager is more. It can scroll only in one direction. Usually this is default pager in Unix systems.

Much more powerful pager is less. Has lot of advantages and functionality - mainly possibility to scroll in two direction, strong navigation inside result. It can display long lines, and allow horizontal scrolling. This pager is necessary for comfortable usage of psql console.

export PAGER="less -S"
psql postgres
postgres=>select * from pg_class;

It is good to know some less commands:
  • g - move to document begin,
  • G - move to document end,
  • / - search string,
  • n - next occurrence of string,
  • N - previous occurrence of string,
  • q - quit.
less is very rich pager has special support for displaying man pages. But this feature we cannot to use for database data. For tabular data, there are special pager pspg. This pager can freeze n first columns, and m first rows. It knows almost all keyboard commands of less pager, and append some new (based on mcedit keywords).
  • Alt k - new bookmark
  • Alt i - previous bookmark
  • Alt j - next bookmark
  • Alt n - show row numbers
  • Alt l - go to line
  • Ctrl Home - move to document begin
  • Ctrl End - move to document end
  • F9 - menu
  • F10 - quit
The usage of pspg is same:
export PAGER=pspg
psql postgres
...
This pager is available from PostgreSQL community repository or from git https://github.com/okbob/pspg.

Brian Fehrle: Dynamic Monitoring of PostgreSQL Instances Using pg_top

$
0
0

Monitoring PostgreSQL can, at times, be like trying to wrangle cattle in a thunderstorm. Applications connect and issue queries so quickly, it’s hard to see what’s going on or even get a good overview of the performance of the system other than the typical developer complaining ‘things are slow, help!’ kind of requests.

In previous articles, we’ve discussed how to Get to the Source when PostgreSQL is acting slow, but when the source is specifically queries, basic level monitoring may not be enough for assessing what’s going on in an active live environment.

Enter pg_top, a PostgreSQL specific program to monitor real time activity in a database, as well as view basic information for the database host itself. Much like the linux command ‘top’, running it brings the user into a live interactive display of database activity on the host, refreshing automatically in intervals.

Installation

Installing pg_top can be done in the generally expected ways: package managers and source install. The most recent version as of this article is 3.7.0.

Package Managers

Based on the distribution of linux in question, search for pgtop or pg_top in the package manager, it’s likely available in some aspect for the installed version of PostgreSQL on the system.

Red Hat based distros:

# sudo yum install pg_top

Gentoo based distros:

# sudo apt-get install pgtop

Source

If desired, pg_top can be installed via source from the PostgreSQL git repository. This will provide any version desired, even newer builds that are not yet in the official releases.

Features

Once installed, pg_top works as a very accurate real time view into the database it is monitoring and using the command line to run ‘pg_top’ will launch the interactive PostgreSQL monitoring tool.

The tool itself can help shed light on all processes currently connected to the database.

Running pg_top

Launching pg_top is the same as the unix / linux style ‘top’ command itself, along with connection information to the database.

To run pg_top on a local database host:

pg_top -h localhost -p 5432 -d severalnines -U postgres

To run pg_top on a remote host, the flag -r or --remote-mode is required, and the pg_proctab extension installed on the host itself:

pg_top -r -h 192.168.1.20 -p 5432 -d severalnines -U postgres

What’s on the screen

When launching pg_top, we see a display with quite a bit of information.

Standard output from pg_top on linux

Load Average:
Like the standard top command, this load average for 1, 5, and 15 minutes intervals.

Uptime:
The total amount of time the system has been online since the latest reboot.

Processes:
The total number of database processes connected, with a number of how many are running and how many are sleeping.

CPU Stats:
The statistics of the CPU, showing the percentage load for user, system, and idle, nice information as well as iowait percentages.

Memory:
The total amount of memory used, free, in buffers and cached.

DB Activity:
The stats for database activity such as the transactions per second, number of rollbacks per second, buffers read per second, buffers hit per second, number of rows read per second, and rows written per second.

DB I/O Activity:
The activity for Input Output on the system, showing how many reads and writes per second, as well as the amount read and written per second.

DB Disk Stats:
The total size of the database disk, as well as how much free space.

Swap:
The information about swap space used, if any.

Processes:
A list of processes connected to the database, including any autovacuum type of internal processes. The list includes the pid, priority, the nice amount, resident memory used, the state of the connection, the number of cpu seconds used, cpu percentage, and the current command the process is running.

Useful Interactive Features

There are a handful of interactive features in pg_top that can be accessed while it is running. A full list can be found by entering a ?, which will bring up a help screen with all the different options available.

Planner Information

E - Execution Plan
Entering E will provide a prompt for a process ID for which to show an explain plan. This is equivalent to running “EXPLAIN <QUERY>;” in the database manually.

A - EXPLAIN ANALYZE (UPDATE/DELETE safe)
Entering A will provide a prompt for a process ID for which to show an EXPLAIN ANALYZE plan. This is equivalent to running “EXPLAIN ANALYZE <QUERY>;” in the database manually.

Download the Whitepaper Today
 
PostgreSQL Management & Automation with ClusterControl
Learn about what you need to know to deploy, monitor, manage and scale PostgreSQL

Process Information

Q - Show current query of a process
Entering Q will provide a prompt for a process ID for which to show the full query.

I - Shows I/O statistics per process (Linux only)
Entering I switches the process list to an I/O display, showing each process reads, writes, etc to disk.

L - Shows locks held by a process
Entering L will provide a prompt for a process ID for which to show held locks. This will include the database, the table, the type of lock, and whether or not the lock has been granted. Useful for when exploring long running or waiting processes.

Relation Information

R - Show user table statistics.
Entering R shows table stats including sequential scans, index scans, INSERTs, UPDATEs, and DELETEs, all relevant to the recent activity.

X - Show user index statistics
Entering X shows index stats including index scans, index reads, and index fetches, all relevant to the recent activity.

Sorting

Sorting the display can be done through any of the following characters.
M - Sort by memory usage
N - Sort by pid
P - Sort by CPU usage
T - Sort by time

The following are entries specified after pressing o, allowing sorting of the index, table, and i/o stat pages as well.
o - Specify sort order (cpu, size, res, time, command)
         index stats (idx_scan, idx_tup_fetch, idx_tup_read)
         table stats (seq_scan, seq_tup_read, idx_scan, idx_tup_fetch, n_tup_ins, n_tup_upd, n_tup_del)
         i/o stats (pid, rchar, wchar, syscr, syscw, reads, writes, cwrites, command)

Connection / Query Manipulation

k - kill processes specified
Entering k will provide a prompt for a process, or list of database processes to kill.

r - renice a process (local database only, root only)
Entering r will provide a prompt for a nice value, followed by a list of processes to set to that new nice value. This changes the priority of important processes in the system.

Example: “renice 1 7004”

Different Uses of pg_top

Reactive Usage of pg_top

The general use for pg_top is the interactive mode, allowing us to see what queries are running on a system that’s experiencing slowness issues, run explain plans on those queries, renice important queries to get them to complete quicker, or kill any queries causing major slowdowns. Generally, it allows the database administrator to do much of the same things that can be done manually on the system, but in a quicker and all in one option.

Proactive Usage of pg_top

While it’s not too common, pg_top can be run in ‘batch mode’, which will display the main information discussed to standard out, then exit. This can be scripted up to run at certain intervals, then sent to any custom process desired, parsed, and alerts generated based on what the administrator may want to be alerted on. For example, if the load of the system gets too high, if there is a higher than expected transactions per second value, anything a creative program can figure out.

Generally, there are other tools to gather and report on this information, but having more options is always a good thing, and with having more tools available, the best options can be found.

Historical Usage of pg_top

Much like the previous usage, proactive usage, we can script up pg_top in a batch mode to log snapshots of what the database looks like over time. This can be as simple as writing it to a text file with a timestamp, or parsing it and storing the date in a relational database to generate reports. This would allow for more information to be found after a major incident, such as a database crash at 4 AM. The more data available, the more likely issues can be found.

More Information

Documentation for the project is fairly limited, and most information is available in the linux man page, found by running ‘man pg_top’. The PostgreSQL community can help with questions or issues through the PostgreSQL Mailing Lists, or the official IRC Chatroom found on freenode, channel name #postgresql.

Fernando Laudares Camargos: Detailed Logging for Enterprise-Grade PostreSQL

$
0
0
detailed logging PostgreSQL

PostgreSQL® logoIn this penultimate post from our series on building an enterprise-grade PostgreSQL environment we cover the parameters we have enabled to configure detailed logging in the demo setup we will showcase in our upcoming webinar.

Detailed logging in PostgreSQL and log analyzer

Like other RDBMS, PostgreSQL allows you to maintain a log of activities and error messages. Until PostgreSQL 9.6, PostgreSQL log files were generated in pg_log directory (inside the data directory) by default. Since PostgreSQL 10, pg_log has been renamed to simply log. However, this directory can be modified to a different location by modifying the parameter log_directory.

Unlike MySQL, PostgreSQL writes the error and activity log to the same log file thus it may grow to several GBs when detailed logging is enabled. In these cases, logging becomes IO-intensive thus it is recommended to store log files in a different storage to the one hosting the data directory.

Parameters to enable detailed logging

Here’s a list of parameters used to customize logging in PostgreSQL. All of them need to be modified in the postgresql.conf or postgresql.auto.conf files.

logging_collector: in order to log any activity in PostgreSQL this parameter must be enabled. The backend process responsible for logging database activity is called logger, it gets started when logging_collector is set to ON. Changing this parameter requires a PostgreSQL restart.

log_min_duration_statement: this parameter is used primarily to set a time threshold: queries running longer than such should be logged (as “slow queries”). Setting it to -1 disables logging of statements. Setting it to 0 enables the logging of every statement running in the database, regardless of its duration. The time unit should follow the actual value, for example: 250ms,  250s, 250min, 1h. Changing this parameter does not require a PostgreSQL restart – a simple reload of the configuration is enough.reload but not a restart. For example:

log_min_duration_statement = 5s
  logs every statement running for 5 seconds or longer.

log_line_prefix: helps you customize every log line being printed in the PostgreSQL log file. You can log the process id, application name, database name and other details for every statement as required. The following log_line_prefix may be helpful in most scenarios:

log_line_prefix = '%t [%p]: [%l-1] user=%u,db=%d,app=%a,client=%h'

The above setting records the following for every statement being logged:

%t : Time stamp without milliseconds
%p : Process id
%l-1 : Number of the log line for each session or process, starting at 1
%u : User name
%d : Database name
%a : Application name
%h : Remote host name or IP address

With the above settings employed for log_line_prefix, the log appears as follows:

2018-06-08 12:36:26 EDT [21315]: [1-1] user=postgres,db=percona,app=psql,client=192.168.0.12 LOG: duration: 2.611 ms statement: select * from departments where id = 26;
2018-06-08 12:36:49 EDT [21323]: [1-1] user=postgres,db=percona,app=psql,client=192.168.0.12 LOG: duration: 2.251 ms statement: select count(*) from departments;

To see more on log_line_prefix, You can refer to the PostgreSQL documentation for further details on this feature.

log_duration: the enabling of this parameter records the duration of every completed statement in PostgreSQL log, and this irrespective of log_min_duration_statement. Have in mind that, as it happens with log_min_duration_statement, the enabling of log_duration may increase log file usage and add affect the server’s general performance. For this reason, if you already have log_min_duration_statement enabled it is often suggested to disable log_duration, unless there’s a specific need to keep track of both.

log_lock_waits: when log_lock_waits is enabled a log message is recorded when a session waits longer than deadlock_timeout to acquire a lock.

log_checkpoints: logs all checkpoints and restart points to the PostgreSQL log file.

log_rotation_size: defines the size limit for each log file; once it reaches this threshold the log file is rotated.
Example: 

log_rotation_size = '500MB'
  – every log file is limited to a size of 500 MB.

log_rotation_age: determines the maximum life span for a log file, forcing its rotation once this threshold is reached. This parameter is usually set in terms of hours, or maybe days, however the minimum granularity is a minute. However, if log_rotation_size is reached first, the log gets rotated anyway, irrespective of this setting.
Example: 

log_rotation_age = 1d

log_statement: controls what type of SQLs are logged. The recommended setting is DDL, which logs all DDLs that are executed. Tracking those allow you to later audit when a given DDL was executed, and by who. By monitoring and understanding the amount of information it may write to the log file you may consider modifying this setting. Other possible values are none, mod (includes DDLs plus DMLs) and all.

log_temp_files: logs information related to a temporary table file whose size is greater than this value (in KBs).

log_directory: defines the directory in which log files are created. Once more, please note that if you have enabled detailed logging it is recommended to have a separate disk—different from the data directory disk—allocated for log_directory.
Example: 

log_directory = /this_is_a_new_disk/pg_log

Log Analyzer – pgBadger

You cannot have a separate error log and a slow query log. Everything is written to one log file, which may be periodically rotated based on time and size. Over a period of time, this log file size may increase to several MB’s or even GB’s depending on the amount of logging that has been enabled. It could get difficult for a DBA/developer to parse the log files and get a better view about what is running slowly and how many times a query has run. To help with this taks you may use pgBadger, a log analyzer for PostgreSQL, to parse log files and generate a rich HTML-based report that you can access from a browser. An example report can be seen in the screenshots below:

We’ll be showing detailed logging and pgBadger in action in a couple of days so, if there’s still time, sign up for our October webinar !

The post Detailed Logging for Enterprise-Grade PostreSQL appeared first on Percona Database Performance Blog.

Andrew Dunstan: SSL in PostgreSQL – Introduction – (Part 1)

$
0
0

This is going to be the first in a series of blog posts about SSL in PostgreSQL. This is an area where I often find misconceptions and misunderstandings, even among people well versed in using PostgreSQL, so I’m going to try to take this slowly and in fairly small steps.

SSL (Secure Sockets Layer) is actually the predecessor of TLS (Transport Layer Security), and when we refer to using SSL these days we really mean we’re using TLS. The older SSL protocols are now deprecated, as they are insecure, and all modern implementations now use some version of TLS, even if the software name still refers to SSL. The same certificates can work with both sets of protocols.

These protocols have two main functions. First, they provide for encryption of traffic between the endpoints. That’s actually the easy part. Given an SSL connection, somebody listening in the middle will not be able to decrypt the traffic stream. The other function is to authenticate the endpoints of the connection. That is, it helps you ensure you’re talking to the right server or client. That’s the comparatively hard part.

SSL/TLS uses public key cryptography. In fact it’s a hybrid cryptosystem which uses public key cryptography to share a symmetric encryption session key between the endpoints, and that ephemeral symmetric key is then used to encrypt the rest of the session. The reason for this is that symmetric encryption and decryption is far less computationally expensive than public key calculations.

In public key cryptography, the public key is used to encrypt, and the private key is used to decrypt. Possessing the public key and a piece of data encrypted with it does not enable an eavesdropper to decrypt the data. Only possession of the private key will allow decryption. Conversely, cryptographic signatures are made using the private key and validated using the public key. Possession of the public key does not enable an eavesdropper to forge a signature than can be validated with it.

All of this is managed in SSL by certificates. A certificate is a document that contains a number of pieces of information. First it contains a public key which is used in cryptographic operations. Second it contains a name or in some cases a number of names which the certificate asserts it is entitled to use. In Postgres this is normally the Common Name (CN) field of the certificate’s Subject. And it contains a cryptographic signature which certifies that holder of the certificate is entitled to use the name.

For testing purposes it is sufficient to use what is known as a self-signed certificate, one in which the certificate is used to sign itself. For production purposes, where security really matters, you should only use and trust certificates whose signature ultimately relies on a well known and trusted Certificate Authority (CA).

Postgres uses two types of certificates – sever certificates and client certificates. When connecting to a server, the client expects that the server’s certificate will have a name that matches the name of the host it is connecting to. If the name doesn’t match, it’s possible that the connection has been intercepted and if the client has been configured to verify the name it will reject and terminate the connection. Client certificates contain a user name instead of a host name. If a client uses a certificate that doesn’t match the user name it is connecting as, the server will reject the connection if configured to do so. Thus, in general, you can’t use a server certificate where a client certificate is required, and vice versa. I have seen this tried more than once and it always ends in lots of confusion and connection failure.

For each certificate file, there is a matching key file containing the private key. The certificate is actually useless without the key. So anyone can grab the certificate and inspect it. But without the key it’s of no practical value. There are a variety of ways of arriving at a session key, but they all involve the client encrypting something with the server’s public key and the server decrypting it with the private key. Conversely, a client proves it has the private key for its certificate by signing a message with the private key which the server then validates using the public key. Note that the keys are never sent over the wire. The keys are the secrets that need to be locked down tight, while the certificate files can be widely disseminated.

In Postgres, as in most systems that use TLS, only server certificates are used to set up session encryption. Client certificates are only used to authenticate the user, not for encryption operations.

There are two other files that matter here. The first is root.crt. It contains the root certificate of trusted Certificate Authorities. It is used to validate the signature of a certificate sent from the remote end of a connection. It need not have anything to do with local certificates. Thus, on a server, root.crt is used to validate client certificates, and on a client it is used to validate server certificates. If you’re not using client certificates, the server doesn’t need a root.crt. Normally you would want a client to have a root.crt.

Finally, there is root.crl, which contains a list of certificates whose signature has been revoked by the Certificate Authority. You might need one of these alongside root.crt. If there is no root.crt then this file is also not needed.

This diagram shows the SSL files on both the client and server, and how validation of certificates flows:

SSL in PostgreSQL
client server model, client server, SSL files

In the next post in this series we’ll show how to set up a Certificate Authority and create and deploy some server certificates and client certificates, and the various verification options. Later posts will look at deploying with pgbouncer, protecting keys with passphrases, and use of intermediate Certificate Authorities.

Bruce Momjian: Trigger Me Writable

$
0
0

Postgres support for hot standby servers allows read-only queries to be run on standby servers, but how are read-only sessions handled when promoting a standby server to primary? After a standby is promoted to primary, new connections are read/write, but existing connections also change to read/write:

SELECT pg_is_in_recovery();
 pg_is_in_recovery
-------------------
 t
 
SHOW transaction_read_only;
 transaction_read_only
-----------------------
 on
 
\! touch /u/pg/data2/primary.trigger
 
-- wait five seconds for the trigger file to be detected
CREATE TABLE test (x INTEGER);
 
SELECT pg_is_in_recovery();
 pg_is_in_recovery
-------------------
 f
 
SHOW transaction_read_only;
 transaction_read_only
-----------------------
 off

Continue Reading »

Fernando Laudares Camargos: PostgreSQL Monitoring: Set Up an Enterprise-Grade Server (and Sign Up for Webinar Weds 10/10…)

$
0
0
PostgreSQL Monitoring

PostgreSQL logoThis is the last post in our series on building an enterprise-grade PostgreSQL set up using open source tools, and we’ll be covering monitoring.

The previous posts in this series discussed aspects such as security, backup strategy, high availability, connection pooling and load balancing, extensions, and detailed logging in PostgreSQL. Tomorrow, Wednesday, October 10 at 10AM EST, we will be reviewing these topics together, and showcasing then in practice in a webinar format: we hope you can join us!


Monitoring databases

The importance of monitoring the activity and health of production systems is unquestionable. When it comes to the database, with its high number of customizable settings, the ability to track its various metrics (status counters and gauges) allows for the maintenance of a historical record of its performance over time. This can be used for capacity planningtroubleshooting and validation.

When it comes to capacity planning, a monitoring solution is a helpful tool to help you assess how the current setup is faring. At the same time, it can help predict future needs based on trends, such as the increase of active connections, queries, and CPU usage. For example, an increase in CPU usage might be due to a genuine increase in workload, but it could also be a sign of unoptimized queries growing in popularity. In which case, comparing CPU with disk access might provide a more complete view of what is going on.

Being able to easily correlate data like this helps you to catch minor issues and to plan accordingly, sometimes allowing you to avoid an easier but more costly solution of scaling up to mitigate problems like this. But having the right monitoring solution is really invaluable when it comes to investigative work and root cause analysis. Trying to understand a problem that has already taken place is a rather complicated, and often unenviable, task unless you established a continuous, watchful eye on the set up for the whole time.

Finally, a monitoring solution can help you validate changes made in the business logic in general or in the database configuration in specific. By comparing prior and post results for a given metric or for overall performance, you can observe the impact of such changes in practice.

Monitoring PostgreSQL with open source solutions

There is a number of monitoring solutions for PostgreSQL and postgresql.org’s Wiki provides an extensive list, albeit a little outdated. It categorizes the main monitoring solutions into two distinct categories: those that can be identified as generic solutions—and can be extended to cover different technologies through custom plugins—and those labeled as Postgres-centric, which are specific to PostgreSQL.

In the first group, we find venerated open source monitoring tools such as Munin, Zabbix, and CactiNagios could have also been added to this group but it was instead indirectly included in the “Checkers” group. That category includes monitoring scripts that can be used both in stand-alone mode or as feeders (plugins) for “Nagios like software“. Examples of these are check_pgactivity and check_postgres.

One omission from this list is Grafana, a modern time series analytics platform conceived to display metrics from a number of different data sources. Grafana includes a solution packaged as a PostgreSQL native plugin. Percona has built its Percona Monitoring and Management (PMM) platform around Grafana, using Prometheus as its data source. Since version 1.14.0, PMM supports PostgreSQL. Query Analytics (QAN) integration is coming soon.

An important factor that all these generic solutions have in common is that they are widely used for the monitoring of a diverse collection of services, like you’d normally find in enterprise-like environments. It’s common for a given company to adopt one, or sometimes two, such solutions with the aim of monitoring their entire infrastructure. This infrastructure often includes a heterogeneous combination of databases and application servers.

Nevertheless, there is a place for complementary Postgres-centric monitoring solutions in such enterprise environments too. These solutions are usually implemented with a specific goal in mind. Two examples we can mention in this context are PGObserver, which has a focus on monitoring stored procedures, and pgCluu, with its focus on auditing.

Monitoring PostgreSQL with PMM

We built an enterprise-grade PostgreSQL set up for the webinar, and use PMM for monitoring. We will be showcasing some of PMM’s main features, and highlighting some of the most important metrics to watch, during our demo.You may want to have a look at this demo setup to get a feel of how our PostgreSQL Overview dashboard looks:

You can find instructions on how to setup PMM for monitoring your PostgreSQL server in our documentation space. And if there’s still time, sign up for tomorrow’s webinar!


The post PostgreSQL Monitoring: Set Up an Enterprise-Grade Server (and Sign Up for Webinar Weds 10/10…) appeared first on Percona Database Performance Blog.


Andrew Dunstan: Managing Freezing in PostgreSQL

$
0
0

Postgres contains a moving event horizon, which is in effect about 2 billion transactions ahead of or behind the current transaction id. Transactions more than 2 billion ahead of or more than 2 billion behind the current transaction id are considered to be in the future, and will thus be invisible to current transactions.

Postgres avoids this catastrophic data loss by specially marking old rows so that no matter where they are in relation to the current transaction id they will be visible.

Freezing is this process of marking old live tuples (i.e. database rows) so that they don’t get run over by the moving event horizon that would otherwise make them appear to be in the future. This is in contrast to vacuuming, which is the freeing up of space consumed by old dead tuples that are no longer visible to any transaction.

Both processes are managed by vacuum.

There are a number of settings that govern how freezing is done.

First, vacuum_freeze_min_age governs whether or not a tuple will be frozen while vacuum is already looking at a page to see if it has dead tuples that can be cleaned up. Tuples older than vacuum_freeze_min_age will be frozen in this case. Setting this low means that there will be less work to do later on, but at the possible cost of extra effort both in CPU and IO or WAL activity. Generally you probably want this set to at least a few hours worth of transactions. Let’s say you’re expecting to do up to 2000 transactions per second as a sustained rate. 2000 TPS is 7.2m transactions per hour. Thus a fairly aggressive setting for this case might be say 20m. The default setting is 50m. Similarly for vacuum_multixact_freeze_min_age. Note that the transaction_id and multixid counters are independent – you need to keep track of both of them.

Second, there are vacuum_freeze_table_age and vacuum_multixact_freeze_table_age. These settings govern when autovacuum will not just look at pages that might have dead rows, but any page that might have unfrozen rows. The defaults for these settings are 150m. If you have reduced vacuum_freeze_min_age enough, in many cases this more aggressive vacuum will have little or no work to do. In any case, this process is not as busy as it used to be, since modern versions of Postgres (9.6 and up) keep a map of pages where all the tuples are frozen, and only visit those pages that are not all frozen. That means this is no longer a full table scan.

Last there is autovacuum_max_freeze_age. If the last time the table was scanned completely for unfrozen rows was more than this many transactions ago, autovacuum will start an anti-wraparound vacuum on the table. The default is 200m. Similarly for autovacuum_multixact_freeze_max_age for which the default is 400m. This is something you really want to avoid. There are two things that can be done. First, it is very common to increase these settings to something like 1 billion, to give yourself more headroom, especially on systems that are heavy consumers of transactions. You could make it more but you want to have plenty of transaction space between your oldest tuple and the event horizon. Second, it is important to monitor your systems and take remedial action before any databases run into this. This remedial action often includes manual vacuuming.

One problem that can occur is where you have DDL that causes normal (i.e. not anti-wraparound) autovacuum to cancel itself. If you do this enough eventually you will get an anti-wraparound vacuum forced, and any DDL then queues up behind the vacuum process, and that in turn blocks any further DML. At this stage your table is effectively unreadable until the vacuum finishes. This depends on the usage pattern of your database, but this is not just a theoretical possibility and Postgres deployments and DBAs do need to take it into account.

Monitoring your database cluster is critical to managing this. In particular you need to monitor the datfrozenxid and datminmxid of each database in the cluster, and if these get too old take remedial action before an anti-wraparound vacuum is required. Often the problem is with one or a few tables in the database. Which ones are the problem can be discovered by examining the relfrozenxid and relminmxid of the tables in the database. The age() and mxid_age() functions are useful to discover the age of transaction id and multixid counters respectively.

Freezing is not something you can avoid, it is an essential maintenance activity in Postgres that needs to be actively managed.

Laurenz Albe: Are your foreign keys indexed?

$
0
0
A foreign key is no wrong key!
© Laurenz Albe 2018


Foreign key constraints are an important tool to keep your database consistent while also documenting relationships between tables.

A fact that is often ignored is that foreign keys need proper indexing to perform well.

This article will explain that and show you how to search for missing indexes.

Index at the target of a foreign key

In the following, I will call the table on which the foreign key constraint is defined the source table and the referenced table the target table.

The referenced columns in the target table must have a primary key or unique constraint. Such constraints are implemented with unique indexes in PostgreSQL. Consequently, the target side of a foreign key is automatically indexed.

This is required so that there is always a well-defined row to which the foreign key points. The index also comes handy if you want to find the row in the target table that matches a row in the source table.

Index at the source of a foreign key

In contrast to the above, PostgreSQL requires no index at the source of a foreign key.

However, such an index is quite useful for finding all source rows that reference a target row. The typical cases where you need that are:

1. You perform a join between the two tables where you explicitly search for the source rows referencing one or a few target rows. If there is an index on the columns at the source, PostgreSQL can use an efficient nested loop join.

This is well known and pretty obvious.

2. You delete rows or update key columns in the target table.

Then PostgreSQL has to check if the foreign key constraint is still satisfied. It does so by searching if there are rows in the source table that would become orphaned by the data modification. Without an index, this requires a sequential scan of the source table.

An example

Let’s build a source and a target table:

-- to make the plans look simpler
SET max_parallel_workers_per_gather = 0;
-- to speed up CREATE INDEX
SET maintenance_work_mem = '512MB';

CREATE TABLE target (
   t_id integer NOT NULL,
   t_name text NOT NULL
);
INSERT INTO target (t_id, t_name)
   SELECT i, 'target ' || i
   FROM generate_series(1, 500001) AS i;

ALTER TABLE target
   ADD PRIMARY KEY (t_id);

CREATE INDEX ON target (t_name);

/* set hint bits and collect statistics */
VACUUM (ANALYZE) target;

CREATE TABLE source (
   s_id integer NOT NULL,
   t_id integer NOT NULL,
   s_name text NOT NULL
);
INSERT INTO source (s_id, t_id, s_name)
   SELECT i, (i - 1) % 500000 + 1, 'source ' || i
   FROM generate_series(1, 1000000) AS i;

ALTER TABLE source
   ADD PRIMARY KEY (s_id);

ALTER TABLE source
   ADD FOREIGN KEY (t_id) REFERENCES target;

/* set hint bits and collect statistics */
VACUUM (ANALYZE) source;

Query time without an index

Looking up source rows via the link to target and deleting rows from target are unreasonably slow:

EXPLAIN (ANALYZE)
SELECT source.s_name
FROM source
   JOIN target USING (t_id)
WHERE target.t_name = 'target 42';

                          QUERY PLAN
----------------------------------------------------------------
 Hash Join  (cost=8.45..19003.47 rows=2 width=13)
            (actual time=0.150..360.920 rows=2 loops=1)
   Hash Cond: (source.t_id = target.t_id)
   ->  Seq Scan on source
                    (cost=0.00..16370.00 rows=1000000 width=17)
              (actual time=0.011..155.964 rows=1000000 loops=1)
   ->  Hash  (cost=8.44..8.44 rows=1 width=4)
             (actual time=0.111..0.111 rows=1 loops=1)
         Buckets: 1024  Batches: 1  Memory Usage: 9kB
         ->  Index Scan using target_t_name_idx on target
                               (cost=0.42..8.44 rows=1 width=4)
                      (actual time=0.105..0.107 rows=1 loops=1)
               Index Cond: (t_name = 'target 42'::text)
 Planning time: 0.701 ms
 Execution time: 360.982 ms
(9 rows)

EXPLAIN (ANALYZE)
DELETE FROM target
WHERE target.t_name = 'target 500001';

                          QUERY PLAN
----------------------------------------------------------------
 Delete on target  (cost=0.42..8.44 rows=1 width=6)
                   (actual time=0.178..0.178 rows=0 loops=1)
   ->  Index Scan using target_t_name_idx on target
                               (cost=0.42..8.44 rows=1 width=6)
                      (actual time=0.107..0.109 rows=1 loops=1)
         Index Cond: (t_name = 'target 500001'::text)
 Planning time: 0.165 ms
 Trigger for constraint source_t_id_fkey: time=153.804 calls=1
 Execution time: 154.030 ms
(6 rows)

Query time with an index

After creating the appropriate index:

CREATE INDEX source_t_id_idx ON source (t_id);

the queries are as fast as they should be:

EXPLAIN (ANALYZE)
SELECT source.s_name
FROM source
   JOIN target USING (t_id)
WHERE target.t_name = 'target 42';

                          QUERY PLAN
----------------------------------------------------------------
 Nested Loop  (cost=0.85..19.89 rows=2 width=13)
              (actual time=0.068..0.076 rows=2 loops=1)
   ->  Index Scan using target_t_name_idx on target
                               (cost=0.42..8.44 rows=1 width=4)
                      (actual time=0.048..0.049 rows=1 loops=1)
         Index Cond: (t_name = 'target 42'::text)
   ->  Index Scan using source_t_id_idx on source
                             (cost=0.42..11.43 rows=2 width=17)
                      (actual time=0.013..0.019 rows=2 loops=1)
         Index Cond: (t_id = target.t_id)
 Planning time: 1.238 ms
 Execution time: 0.147 ms
(7 rows)

EXPLAIN (ANALYZE)
DELETE FROM target
WHERE target.t_name = 'target 500001';

                           QUERY PLAN
----------------------------------------------------------------
 Delete on target  (cost=0.42..8.44 rows=1 width=6)
                   (actual time=0.135..0.135 rows=0 loops=1)
   ->  Index Scan using target_t_name_idx on target
                               (cost=0.42..8.44 rows=1 width=6)
                      (actual time=0.091..0.094 rows=1 loops=1)
         Index Cond: (t_name = 'target 500001'::text)
 Planning time: 0.151 ms
 Trigger for constraint source_t_id_fkey: time=0.557 calls=1
 Execution time: 0.751 ms
(6 rows)

How to check for missing indexes?

The following query will list all foreign key constraints in the database that do not have an index on the source columns:

SELECT c.conrelid::regclass AS "table",
       /* list of key column names in order */
       string_agg(a.attname, ',' ORDER BY x.n) AS columns,
       pg_catalog.pg_size_pretty(
          pg_catalog.pg_relation_size(c.conrelid)
       ) AS size,
       c.conname AS constraint,
       c.confrelid::regclass AS referenced_table
FROM pg_catalog.pg_constraint c
   /* enumerated key column numbers per foreign key */
   CROSS JOIN LATERAL
      unnest(c.conkey) WITH ORDINALITY AS x(attnum, n)
   /* name for each key column */
   JOIN pg_catalog.pg_attribute a
      ON a.attnum = x.attnum
         AND a.attrelid = c.conrelid
WHERE NOT EXISTS
        /* is there a matching index for the constraint? */
        (SELECT 1 FROM pg_catalog.pg_index i
         WHERE i.indrelid = c.conrelid
           /* the first index columns must be the same as the
              key columns, but order doesn't matter */
           AND (i.indkey::smallint[])[0:cardinality(c.conkey)-1]
               @> c.conkey)
  AND c.contype = 'f'
GROUP BY c.conrelid, c.conname, c.confrelid
ORDER BY pg_catalog.pg_relation_size(c.conrelid) DESC;

The result is ordered by the size of the table, so that the tables where the missing index hurts most are listed on top.

Should I create indexes for all foreign keys?

If the source table is small, you don’t need the index, because then a sequential scan is probably cheaper than an index scan anyway.

Also, if you know that you never need the index for a join and you will never delete a row or update a key column in the target table, the index is unnecessary.

There is one simple way to proceed: create all missing indexes, wait a couple of days and then get rid of the indexes that were never used.

The post Are your foreign keys indexed? appeared first on Cybertec.

Jonathan Katz: Won’t You Be My Neighbor? Quickly Finding Who is Nearby

$
0
0

Many applications these days want us to know how close we are to things:

  • What are the three closest coffee shops to my current location?
  • Which is the nearest airport to the office?
  • What are the two closest subway stops to the restaurant?

and countless more examples.

Another way of asking these questions is to say “who are my nearest neighbors to me?” This maps to a classic algorithmic problem: efficiently finding the K-nearest neighbors (or K-NN), where K is a constant. For example, the first question would be a 3-NN problem as we are trying to find the 3 closest coffee shops.

(If you are interested in learning more about K-NN problems in general, I highly recommend looking at how you can solve this using n-dimensional Voronoi diagrams, a wonderful data structure developed in the field of computational geometry.)

How can we use PostgreSQL to help us quickly find our closest neighbors? Let’s explore.

Avinash Kumar: PostgreSQL Extensions for an Enterprise-Grade System

$
0
0
PostgreSQL extensions for logging

PostgreSQL® logoIn this current series of blog posts we have been discussing various relevant aspects when building an enterprise-grade PostgreSQL setup, such as security, back up strategy, high availability, and different methods to scale PostgreSQL. In this blog post, we’ll get to review some of the most popular open source extensions for PostgreSQL, used to expand its capabilities and address specific needs. We’ll cover some of them during a demo in our upcoming webinar on October 10.

Expanding with PostgreSQL Extensions

PostgreSQL is one of the world’s most feature-rich and advanced open source RDBMSs. Its features are not just limited to those released by the community through major/minor releases. There are hundreds of additional features developed using the extensions capabilities in PostgreSQL, which can cater to needs of specific users. Some of these extensions are very popular and useful to build an enterprise-grade PostgreSQL environment. We previously blogged about a couple of FDW extensions (mysql_fdw and postgres_fdw ) which will allow PostgreSQL databases to talk to remote homogeneous/heterogeneous databases like PostgreSQL and MySQL, MongoDB, etc. We will now cover a few other additional extensions that can expand your PostgreSQL server capabilities.

pg_stat_statements

The pg_stat_statements module provides a means for tracking execution statistics of all SQL statements executed by a server. The statistics gathered by the module are made available via a view named pg_stat_statements. This extension must be installed in each of the databases you want to track, and like many of the extensions in this list, it is available in the contrib package from the PostgreSQL PGDG repository.

pg_repack

Tables in PostgreSQL may end up with fragmentation and bloat due to the specific MVCC implementation in PostgreSQL, or simply due to a high number of rows being naturally removed. This could lead to not only unused space being held inside the table but also to sub-optimal execution of SQL statements. pg_repack is the most popular way to address this problem by reorganizing and repacking the table. It can reorganize the table’s content without placing an exclusive lock on it during the process. DMLs and queries can continue while repacking is happening.  Version 1.2 of pg_repack introduces further new features of parallel index builds, and the ability to rebuild just the indexes. Please refer to the official documentation for more details.

pgaudit

PostgreSQL has a basic statement logging feature. It can be implemented using the standard logging facility with

log_statement = all
 . But this is not sufficient for many audit requirements. One of the essential features for enterprise deployments is the capability for fine-grained auditing the user interactions/statements issued to the database. This is a major compliance requirement for many security standards. The pgaudit extension caters to these requirements.

The PostgreSQL Audit Extension (pgaudit) provides detailed session and/or object audit logging via the standard PostgreSQL logging facility. Please refer to the settings section of its official documentation for more details.

pldebugger

This is a must-have extension for developers who work on stored functions written in PL/pgSQL. This extension is well integrated with GUI tools like pgadmin, which allows developers to step through their code and debug it. Packages for pldebugger are also available in the PGDG repository and installation is straightforward.Once it is set up, we can step though and debug the code remotely.

The official git repo is available here

plprofiler

This is a wonderful extension for finding out where the code is slowing down. This is very helpful, particularly during complex migrations from proprietary databases, like from Oracle to PostgreSQL, which affect application performance. This extension can prepare a report on the overall execution time and tables representation, including flamegraphs, with clear information about each line of code. This extension is not, however, available from the PGDG repo: you will need to build it from source. Details on building and installing plprofiler will be covered in a future blog post. Meanwhile, the official repository and documentation is available here

PostGIS

PostGIS is arguably the most versatile implementation of the specifications of the Open Geospatial Consortium. We can see a large list of features in PostGIS that are rarely available in any other RDBMSs.

There are many users who have primarily opted to use PostgreSQL because of the features supported by PostGIS. In fact, all these features are not implemented as a single extension, but are instead delivered by a collection of extensions. This makes PostGIS one of the most complex extensions to build from source. Luckily, everything is available from the PGDG repository:

$ sudo yum install postgis24_10.x86_64

Once the postgis package is installed, we are able to create the extensions on our target database:

postgres=# CREATE EXTENSION postgis;
CREATE EXTENSION
postgres=# CREATE EXTENSION postgis_topology;
CREATE EXTENSION
postgres=# CREATE EXTENSION postgis_sfcgal;
CREATE EXTENSION
postgres=# CREATE EXTENSION fuzzystrmatch;
CREATE EXTENSION
postgres=# CREATE EXTENSION postgis_tiger_geocoder;
CREATE EXTENSION
postgres=# CREATE EXTENSION address_standardizer;
CREATE EXTENSION

Language Extensions : PL/Python, PL/Perl, PL/V8,PL/R etc.

Another powerful feature of PostgreSQL is its programming languages support. You can code database functions/procedures in pretty much every popular language.

Thanks to the enormous number of libraries available, which includes machine learning ones, and its vibrant community, Python has claimed the third spot amongst the most popular languages of choice according to the TIOBE Programming index. Your team’s skills and libraries remain valid for PostgreSQL server coding too! Teams that regularly code in JavaScript for Node.js or Angular can easily write PostgreSQL server code in PL/V8. All of the packages required are readily available from the PGDG repository.

cstore_fdw

cstore_fdw is an open source columnar store extension for PostgreSQL. Columnar stores provide notable benefits for analytics use cases where data is loaded in batches. Cstore_fdw’s columnar nature delivers performance by only reading relevant data from disk. It may compress data by 6 to 10 times to reduce space requirements for data archive. The official repository and documentation is available here

HypoPG

HypoPG is an extension for adding support for hypothetical indexes – that is, without actually adding the index. This helps us to answer questions such as “how will the execution plan change if there is an index on column X?”. Installation and setup instructions are part of its official documentation

mongo_fdw

Mongo_fdw presents collections from mongodb as tables in PostgreSQL. This is a case where the NoSQL world meets the SQL world and features combine. We will be covering this extension in a future blog post. The official repository is available here

tds_fdw

Another important FDW (foreign data wrapper) extension in the PostgreSQL world is tds_fdw. Both Microsoft SQL Server and Sybase uses TDS (Tabular Data Stream) format. This fdw allows PostgreSQL to use tables stored in remote SQL Server or Sybase database as local tables. This FDW make use of FreeTDS libraries.

orafce

As previously mentioned, there are lot of migrations underway from Oracle to PostgreSQL. Incompatible functions in PostgreSQL are often painful for those who are migrating server code. The “orafce” project implements some of the functions from the Oracle database. The functionality was verified on Oracle 10g and the module is useful for production work. Please refer to the list in its official documentation about the Oracle functions implemented in PostgreSQL

TimescaleDB

In this new world of IOT and connected devices, there is a growing need of time-series data. Timescale can convert PostgreSQL into a scalable time-series data store. The official site is available here with all relevant links.

pg_bulkload

Is loading a large volume of data into database in a very efficient and faster way a challenge for you? If so pg_bulkload may help you solve that problem. Official documentation is available here

pg_partman

PostgreSQL 10 introduced declarative partitions. But creating new partitions and maintaining existing ones, including purging unwanted partitions, requires a good dose of manual effort. If you are looking to automate part of this maintenance you should have a look at what pg_partman offers. The repository with documentation is available here.

wal2json

PostgreSQL has feature related to logical replication built-in. Extra information is recorded in WALs which will facilitate logical decoding. wal2json is a popular output plugin for logical decoding. This can be utilized for different purposes including change data capture. In addition to wal2json, there are other output plugins: a concise list is available in the PostgreSQL wiki.

There are many more extensions that help us build an enterprise-grade PostgreSQL set up using open source solutions. Please feel free to comment and ask us if we know about one that satisfies your particular needs. Or, if there’s still time, sign up for our October webinar and ask us in person!

The post PostgreSQL Extensions for an Enterprise-Grade System appeared first on Percona Database Performance Blog.

Bruce Momjian: Multi-Host Libpq

$
0
0

Libpq is used by many client interface languages to communicate with the Postgres server. One new feature in Postgres 10 is the ability to specify multiple servers for connection attempts. Specifically, it allows the connection string to contain multiple sets of host, hostaddr, and port values. These are tried until one connects.

NoSQL solutions have used this method of multi-host connectivity for a while, so it is good Postgres can now do it too. It doesn't have all the features of a separate connection pooler, but it doesn't have the administrative or performance overhead of a separate connection pooler either, so it certainly fits a need for some environments.

Pavel Stehule: New functionality of plpgsql_extension

$
0
0
I am working on new release of plpgsql_check extension - https://github.com/okbob/plpgsql_check.

Interesting new function is possibility to return list of used relation and functions. With these information is easy to generate dependency graph:

postgres=# \sf fx
CREATE OR REPLACE FUNCTION public.fx()
RETURNS void
LANGUAGE plpgsql
AS $function$
begin
perform upper(((plus(a) + 200) * 100)::text) from xx;
end;
$function$
postgres=# select * from plpgsql_show_dependency_tb('fx()');
┌──────────┬───────┬────────┬──────┬───────────┐
│ type │ oid │ schema │ name │ params │
╞══════════╪═══════╪════════╪══════╪═══════════╡
│ FUNCTION │ 18310 │ public │ plus │ (integer) │
│ RELATION │ 24576 │ public │ xx │ │
└──────────┴───────┴────────┴──────┴───────────┘
(2 rows)

Shaun M. Thomas: PG Phriday: Studying Stored Procedures in Postgres 11

$
0
0

Studying Stored Procs in Postgres 11

With Postgres 11 looming on the near horizon, it’s only appropriate to check out a recent beta and kick the tires a few times. Whether it’s improvements in parallelism, partitions, stored procedures, JIT functionality, or any number of elements in the release page, there’s a lot to investigate.

It just so happens that I ran across a fortuitous event on Twitter when deciding on an appropriate topic. Behold!

waste_xid Postgres 11
Wasting XIDs has never been this fun

Wait! No! That’s not what stored procedures are for!

I felt so good like anything was possible

When confronted with such a blatant corruption of such a cool new feature, it’s only natural to question the wisdom of doing so. It is, after all, not a great idea to programatically consume transaction IDs. I said as much and moved on with life, certain the worst was over.

Then this happened.

waste_xid is fun
Magnus helpfully recommends proceeding

Now, Magnus is infamous for two things: his technical acumen, and giddy malevolence. His advocacy of a stored procedure named “waste_xid” only proved nobody anywhere should ever run this anywhere, lest they immolate whatever system hosted the database instance.

But hey, VMs are cheap; let’s break things. How else can we learn the limits of our new toys, but by virtually atomizing them?

I hit cruise control and rubbed my eyes

Before we saddle our poor innocent Postgres 11 installation with an inadvisable stored procedure designed specifically to underhandedly reap its transaction lifespan, we should probably make the routine as evil as possible.

One thing stands out immediately: calling EXECUTE is unnecessary overhead. According to the information function documentation, txid_current will assign a new transaction ID if there isn’t one already. Since the stored procedure is constantly committing, that’s extremely handy. And since this is Pl/pgSQL, we can use direct assignment instead.

Our new procedure looks something like this:

CREATE OR REPLACE PROCEDURE waste_xid(cnt int)
AS $$
DECLARE
    i INT;
    x BIGINT;
BEGIN
    FOR i in 1..cnt LOOP
        x := txid_current();
        COMMIT;
    END LOOP;
END;
$$
LANGUAGE plpgsql;

Great! We can now waste XIDs about 4x faster than before! On this particular test VM, the maximum amount of wasted XIDs per second was about 125k. At that rate, we could blow through a billion in roughly two hours.

Since quite a few installations use the default autovacuum settings, that means we could trigger a lot of vacuums at the 200M transaction mark in about half an hour. We didn’t need that disk throughput anyway.

Workin’ on a mystery, goin’ wherever it leads

Regardless, what happens if we run it?

CALL waste_xid(1000000);

CALL

Well, that was anticlimactic. How about the logs? We set our min_log_duration_statement to 100ms for debugging purposes, so we should definitely see a long call there.

2018-10-03 20:53:02.505 UTC [11334] postgres@test LOG:  duration: 7949.540 ms  statement: call waste_xid(1000000);

Here’s something that’s actually more interesting than it might appear at first glance. Stored procedures, it would seem, are atomic. We tested explicitly by adding a long pg_sleep call in the loop, and none of those entries were logged.

Since procedures can COMMIT transactions and thus could contain semantically unrelated unrelated activity to the originating transaction, can a procedure essentially derail an existing transaction? Let’s see:

BEGIN;

CALL waste_xid(1000000);

ERROR:  invalid transaction termination
CONTEXT:  PL/pgSQL function waste_xid(integer) line 8 at COMMIT

Nope! Apparently CALL is only valid within its own context; no transactions for you. This could introduce interesting behavior in application layers that implicitly start a transaction before every command. The resulting error is a bit ambiguous however; why is the transaction termination invalid? Can’t it just say we can’t close the current transaction from within a procedure?

So stored procedures are atomic, and can do whatever they want in their own transactional context. What else are they hiding?

I put the pedal down to make some time

It seems there are special rules to how transactions are handled in stored procedures. While the discussion was hot, a couple more functional variants popped up. Here’s an interesting one:

CREATE OR REPLACE PROCEDURE check_now()
AS $$
DECLARE
    i int;
BEGIN
    FOR i in 1..5 LOOP
        RAISE NOTICE 'It is now: %', now();
        PERFORM txid_current();
        COMMIT;
        PERFORM pg_sleep(0.1);
    END LOOP;
END;
$$
LANGUAGE plpgsql;

What are we testing for here? Well, one fundamental attribute of the now() function and several other related DATETIME routines, is that they are tied to the current transaction. So in theory, the value being returned should change.

Let’s try it:

CALL check_now();

NOTICE:  It is now: 2018-10-03 21:27:07.764822+00

Uh oh. What does this actually mean? Is now() being tethered to the initial CALL instead of the current transaction? Or are PL/pgSQL transactions not real transactions? If they do operate in a different context than the outer transaction, how else does that context diverge? Or is this a bug?

Postgres 11 is still in beta, after all.

It was always cold, no sunshine

Upon adopting the PROCEDURE nomenclature, we’re also presented with a rather unique historical quirk. Consider the previous syntax for creating a trigger. More than a few triggers have been declared this way:

CREATE TRIGGER t_my_trigger
BEFORE INSERT OR UPDATE ON mytable
   FOR EACH ROW
       EXECUTE PROCEDURE my_function();

Ever prescient, the devs saw this coming and added a disclaimer to the Postgres 11 docs:

In the syntax of CREATE TRIGGER, the keywords FUNCTION and PROCEDURE are equivalent, but the referenced function must in any case be a function, not a procedure. The use of the keyword PROCEDURE here is historical and deprecated.

So in case you’d mentally linked the historical—and up until Postgres 11, current—syntax with the new stored procedure functionality, don’t. Procedures really did change more of the Postgres internals than a cursory examination could reveal.

There’s something good waitin’ down this road

Now that we’ve kicked the proverbial tires and explored a few of the neat quirks stored procedures offer, what does it all mean?

First and foremost, the ability to COMMIT or ROLLBACK within a function call allows both safeguarding activity batches or particularly critical data. No longer will one function call represent an all-or-nothing proposition. That alone is a massive enhancement to Postgres, one which users of other database engines such as Oracle have been clamoring for over the last 20 years.

More subtly, it presents a new security concern that administrators should consider. The ability to manipulate transactions is a powerful lever ripe for abuse. At minimum, DBAs should consider revoking USAGE on any languages from users that shouldn’t be granted that capability.

REVOKE USAGE ON LANGUAGE plpgsql FROM PUBLIC;

Users will still be able to invoke previously defined functions or procedures, but won’t be able to create new ones. In fact, this should probably be done on all current systems as a matter of course.

Judiciously wielded, Postgres can continue runnin’ down the dream of becoming the best and most feature-laden database. We just need to pay attention to where we’re going.


Bruce Momjian: Installing PL/v8

$
0
0

PL/v8 is the JavaScript server-side language for Postgres. It has been available for several years, but a change in the way Google packages the v8 languages has made it burdensome for packagers to build PL/v8 packages.

Therefore, few package managers still distribute PL/v8. This is disappointing since it undercuts some of our NoSQL story. We previously supported JSON storage and a JSON-specific server-side language. This second option is effectively no longer available, and those users who are using PL/v8 will need to find alternatives. This highlights the risk of software significantly relying on other software that it does not control and cannot maintain itself.

Ibrar Ahmed: Track PostgreSQL Row Changes Using Public/Private Key Signing

$
0
0
PostgreSQL encryption and authorization

row signing with postgresqlAuthorisations and encryption/decryption within a database system establish the basic guidelines in protecting your database by guarding against malicious structural or data changes.

What are authorisations?

Authorisations are the access privileges that mainly control what a user can and cannot do on the database server for one or more databases. So consider this to be like granting a key to unlock specific doors. Think of this as more like your five star hotel smart card. It allows you access all facilities that are meant for you, but doesn’t let you open every door. Whereas, privileged staff have master keys which let them open any door.

Similarly, in the database world, granting permissions secures the system by allowing specific actions by specific users or user groups, yet it allows database administrator to perform whatever action(s) on the database he/she wishes. PostgreSQL provides user management where you can can create users, and grant and revoke their privileges.

Encryption

Encryption, decryption can protect your data, obfuscate schema structure and help hide code from prying eyes. Encryption/decryption hides the valuable information and ensures that there are no mischievous changes in the code or data that may be considered harmful. In almost all cases, data encryption and decryption happens on the database server. This is more like hiding your stuff somewhere in your room so that nobody can see it, but also making your stuff difficult to access.

PostgreSQL also provides encryption using pgcrypto (PostgreSQL extension). There are some cases where you don’t want to hide the data, but don’t want people to update it either. You can revoke the privileges to modify the data.

Data modifications

But what if an admin user modifies the data? How you can identify that data is changed? If somebody changes the data and you don’t know about, then it is more dangerous than you losing your data, as you are relying on data which may no longer be valid.

Logs in database systems allow us to track back changes and “potentially” identify what was changed—unless, those logs are removed by the administrator.

So consider if you can leave your stuff openly in your room and in case of any changes, you can identify that something was tampered with. In database terms, that translates to data without encryption, but with your very own signature. One option is to add a column to your database table which keeps a checksum for the data that is generated on the client side using the user’s own private key.  Any changes in the data would mean that checksum doesn’t match anymore, and hence, one can easily identify if the data has changed. The data signing happens on the client-side, thereby ensuring that only users with the required private key can insert the data and anyone with a public key can validate.

Public/Private Keys

Asymmetric cryptographic system uses pairs of keys; public keys and private keys. Private keys are known only to the owner(s). It is used for signing or decrypting data. Public keys are shared with other stakeholders who may use it to encrypt messages or validate messages signed by the owner.

Generate Private / Public Key

Private Key

$ openssl genrsa -aes128 -passout pass:password -out key.private.pem
Generating RSA private key, 2048 bit long modulus

Public Key

$ openssl rsa -in key.private.pem -passin pass:password -pubout -out key.public.pem
writing RSA key

Signing Data

Create a sample table tbl_marks and insert a sample row in that. We’ll need to add additional columns for signature verification. This will understandably increase the table size as we are adding additional columns.

postgres=# CREATE TABLE tbl_marks (id INTEGER, name TEXT, marks INTEGER, hash TEXT);

Let’s add a row that we’d like to validate.

postgres=# INSERT INTO tbl_marks VALUES(1, 'Alice', 80);

We will select the data to store the value into into query buffer using

\gset
  command (https://www.postgresql.org/docs/current/static/app-psql.html). The complete row will be saved into “row” psql variable.
postgres=# SELECT row(id,name,marks) FROM tbl_marks WHERE id = 1;
     row   
---------------
(1,Alice,80)
(1 row)
postgres=# \gset
postgres=# SELECT :'row' as row;
     row   
---------------
(1,Alice,80)
(1 row)

Now let’s generate signature for the data stored in “row” variable.

postgres=# \set sign_command `echo :'row' | openssl dgst -sha256 -sign key.private.pem | openssl base64 | tr -d '\n' | tr -d '\r'`
Enter pass phrase for key.private.pem:

The signed hash is stored into the “sign_command” psql variable. Let’s now add this to the data row in tbl_marks table.

postgres=# UPDATE tbl_marks SET hash = :'sign_command' WHERE id = 1;
UPDATE 1

Validating Data

So our data row now contains data with a valid signature. Let’s try to validate to it. We are going to select our data in “row” psql variable and the signature hash in “hash” psql variable.

postgres=# SELECT row(id,name,marks), hash FROM tbl_marks;    
Row           hash                                                                                                                                                                                                                                                                                                                                                                                            
---------------+-----------------------------------------------
(1,Alice,80) | U23g3RwaZmbeZpYPmwezP5xvbIs8ILupW7jtrat8ixA ...
(1 row)
postgres=# \gset

Let’s now validate the data using a public key.

postgres=# \set verify_command `echo :'hash' | awk '{gsub(/.{65}/,"&\n")}1' | openssl base64 -d -out v && echo :'row' | openssl dgst -sha256 -verify key.public.pem -signature v`
postgres=# select :'verify_command' as verify;
  verify    
-------------
Verified OK
(1 row)

Perfect! The data is validated and all this happened on the client side. Imagine somebody doesn’t like that Alice got 80 marks, and they decide to reduce Alice’s marks to 30. Nobody knows if the teacher had given Alice 80 or 30 unless somebody goes and checks the database logs. We’ll give Alice 30 marks now.

postgres=# UPDATE tbl_marks SET marks = 30;
UPDATE 1

The school admin now decides to check that all data is correct before giving out the final results. The school admin has the teacher’s public key and tries to validate the data.

postgres=# SELECT row(id,name,marks), hash FROM tbl_marks;
    row    | hash                                                                                                                                                                                                                                                                  
--------------+--------------------------------------------------
(1,Alice,30) | yO20vyPRPR+HgW9D2nMSQstRgyGmCxyS9bVVrJ8tC7nh18iYc...
(1 row)
postgres=# \gset

postgres=# \set verify_command `echo :'hash' | awk '{gsub(/.{65}/,"&\n")}1' | openssl base64 -d -out v && echo :'row' | openssl dgst -sha256 -verify key.public.pem -signature v`
postgres=# SELECT :'verify_command' AS verify;
      verify      
----------------------
Verification Failure

As expected, the validation fails. Nobody other than the teacher had the private key to sign that data, and any tampering is easily identifiable.

This might not be the most efficient way of securing a dataset, but it is definitely an option if you want to keep the data unencrypted, and yet easily detect any unauthorised changes. All the load is shifted on to the client side for signing and verification thereby reducing load on the server. It allows only users with private keys to update the data, and anybody with the associated public key to validate it.

The example used psql as a client application for signing but you can do this on any client which can call the required openssl functions or directly used openssl binaries for signing and verification.

pgCMH - Columbus, OH: Joining the herd

$
0
0

The Oct meeting will be held at 18:00 EST on Tues, the 23rd. Once again, we will be holding the meeting in the community space at CoverMyMeds. Please RSVP on MeetUp so we have an idea on the amount of food needed.

What

Our very own Douglas will be presenting this month. He’s going to tell us all about how you can join the PostgreSQL community and contribute the growth and success of PostgreSQL.

Where

CoverMyMeds has graciously agreed to validate your parking if you use their garage so please park there:

You can safely ignore any sign saying to not park in the garage as long as it’s after 17:30 when you arrive.

Park in any space that is not marked ‘24 hour reserved’.

Once parked, take the elevator/stairs to the 3rd floor to reach the Miranova lobby. Once in the lobby, the elevator bank is in the back (West side) of the building. Take a left and walk down the hall until you see the elevator bank on your right. Grab an elevator up to the 11th floor. (If the elevator won’t let you pick the 11th floor, contact Doug or CJ (info below)). Once you exit the elevator, look to your left and right; one side will have visible cubicles, the other won’t. Head to the side without cubicles. You’re now in the community space:

Community space as seen from the stage

The kitchen is to your right (grab yourself a drink) and the meeting will be held to your left. Walk down the room towards the stage.

If you have any issues or questions with parking or the elevators, feel free to text/call Doug at +1.614.316.5079 or CJ at +1.740.407.7043

Pavel Trukhanov: PgBouncer monitoring improvements in recent versions

$
0
0

PgBouncer monitoring improvements in recent versions

As I wrote in my previous article “USE, RED and real world PgBouncer monitoring” there are some nice commands in PgBouncer’s admin interface that allow to collect stats how things going and spot problems, if you know where to look.

This post is about new stats added in these commands in new PgBouncer versions.

So as you know, SHOW STATS shows cumulative stats for each proxied DB:

Since PgBouncer version 1.8 there’s a couple of new columns in its output.

First one — total_xact_time — total number of microseconds spent by pgbouncer when connected to PostgreSQL in a transaction, either idle in transaction or executing queries.

This will allow us to chart db pool utilization in terms of time spent in transactions and compare it to the query time utilization:

We see two totally different situations — while database is used for serving queries only 5 to 25 % of the time, PgBouncer connections around 8:00 am spend up to 70% of time in transactions!

But this total_xact_time is useful in one more very important way.

There’s a known anti-pattern in Postgres usage, is when your application opens up a transaction, makes a query and then starts doing something else, for example some CPU-heavy calculation on that result or query to some other resource/service/database, while transaction keeps hangging. Later this app will probably return back to this transaction and might, for example, update something and commit it. The bad thing in that case is that there’s a corresponding Postgres backend process, that sits there doing nothing, while transaction is idling. And Postgres backends are somewhat expensive.

Your app should avoid such behavior.

This idle in transaction state might be monitored in the Postgres itself — there’s state column in pg_stat_activity system view. But pg_stat_activity provides us only with a snapshot of current states, that leads to possible false negative errors in reporting occurrences of such cases. Using PgBouncer's stats we can calculate a percentage of time that clients were performing some queries (total_query_time) from the total time spent by client while in transaction: total_xact_time. If we subtract that from 100% that will be idling percentage:

Moreover, there’s new two metrics in 1.8 version of PgBouncer that substitute original total_requests stat, that showed number of queries performed. With modern version of PgBouncer you’ll have total_query_count instead of total_requests, and additionally total_xact_count — that counts number of transactions.

So with that in hand, we can divide total_xact_time - total_query_time (total idling time) to the number of transactions —total_xact_count — this will give us how long on average each transaction is idling.

Furthermore with all that, we can characterize database workload in one more useful way: we can calculate average number of queries per transaction, by dividing the rate of queries by the rate of transactions. In okmeter monitoring you can do that as simple as this:

rate(
metric(name="total_query_count", database="*")
) / rate(
metric(name="total_xact_count)", database="*")
)

And here’s a corresponding chart:

We can see clearly when there were changes in workload profile.

Request Durations

As we saw in the previous article if you divide total_query_time by total_requests you’ll get average query duration. With newer PgBouncer versions these new stats you get —total_xact_time and total_wait_time can be charted in the same way — divided by the number of transactions and queries respectfully. This will produce a chart like this one:

This wait_time metric is way more handy in spotting pool saturation, than the one we discussed previous time, calculated from the number of waiting client in SHOW STATS output:

With all that and other detailed PgBouncer metrics and Postgres metrics you’ll be prepared to anything happening with your databases.

I hope you find this write up useful. I’ve tried to cover all the bases, if you feel that you have something to add — please, tell me, I’ll be glad to discuss.

We’re preparing next articles on Postgres and monitoring. So if you’re interested — follow our blog here, or at facebook or twitter to stay tuned!

Our monitoring service — okmeter.io will help you stay on-top of everything happening with you Postgresql, RDS and other infrastructure services.


PgBouncer monitoring improvements in recent versions was originally published in okmeter.io blog on Medium, where people are continuing the conversation by highlighting and responding to this story.

Bruce Momjian: Three-Year Cycle

$
0
0

In the early years of Postgres's open source development, we focused on features that could be accomplished in a few weekends. Within a few years, we had completed many of those, and were challenged trying to accomplish big project with a mostly volunteer workforce. Soon, however, large companies started to sponsor developers' time and we launched into big feature development again.

Currently, the calendar is our only real challenge. We have major releases every year, but many features take multiple years to fully implement. We have seen this multi-year process with:

  • Windows port
  • Point-in-time recovery
  • JSON
  • Streaming replication

and are in the process of completing even more:

  • Parallelism
  • Partitioning
  • JIT
  • Sharding

Continue Reading »

Viewing all 9767 articles
Browse latest View live


<script src="https://jsc.adskeeper.com/r/s/rssing.com.1596347.js" async> </script>