This is the second part of the multi-series Benchmarking Managed PostgreSQL Cloud Solutions. In Part 1 I presented an overview of the available tools, I discussed the reason for using the AWS Benchmark Procedure for Aurora, as well as PostgreSQL versions to be used, and I reviewed Amazon Aurora PostgreSQL 10.6.
In this part, pgbench and sysbench will be running against Amazon RDS for PostgreSQL 11.1. At the time of this writing the latest PostgreSQL version is 11.2 released about a month ago.
It’s worth pausing for a second to quickly review the PostgreSQL versions currently available in the cloud:
Amazon is again a winner, with its RDS offering, by providing the most recent version of PostgreSQL. As announced in the RDS forum AWS made PostgreSQL 11.1 available on March 13th, which is four months after the community release.
Setting Up the Environment
A few notes about the constraints related to setting up the environment and running the benchmark, points that were discussed in more detail during Part 1 of this series:
- No changes to the cloud provider default GUC settings.
- The connections are limited to a maximum of 1,000 as the AWS patch for pgbench did not apply cleanly. On a related note, I had to download the AWS timing patch from this pgsql-hackers submission since it was no longer available at the link mentioned in the guide.
- The Enhanced Networking must be enabled for the client instance.
- The database does not include a replica.
- The database storage is not encrypted.
- Both the client and the target instances are in the same availability zone.
First, setup the client and the database instances:
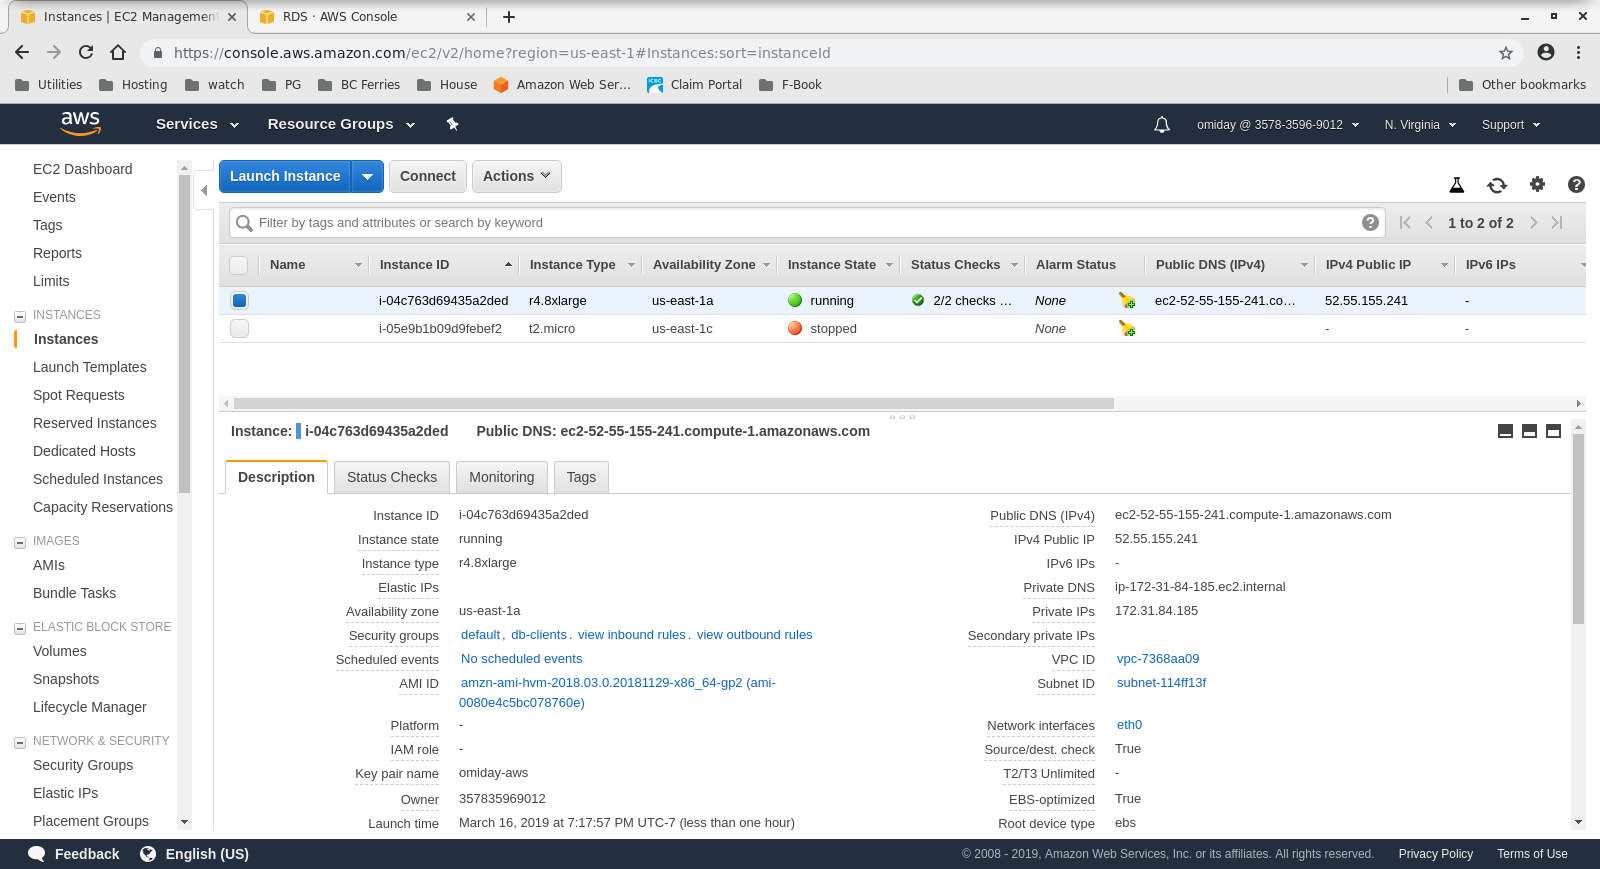
- The client is an on demand r4.8xlarge EC2 instance:
- vCPU: 32 (16 Cores x 2 Threads/Core)
- RAM: 244 GiB
- Storage: EBS Optimized
- Network: 10 Gigabit
![Client Instance Configuration]()
Client Instance Configuration
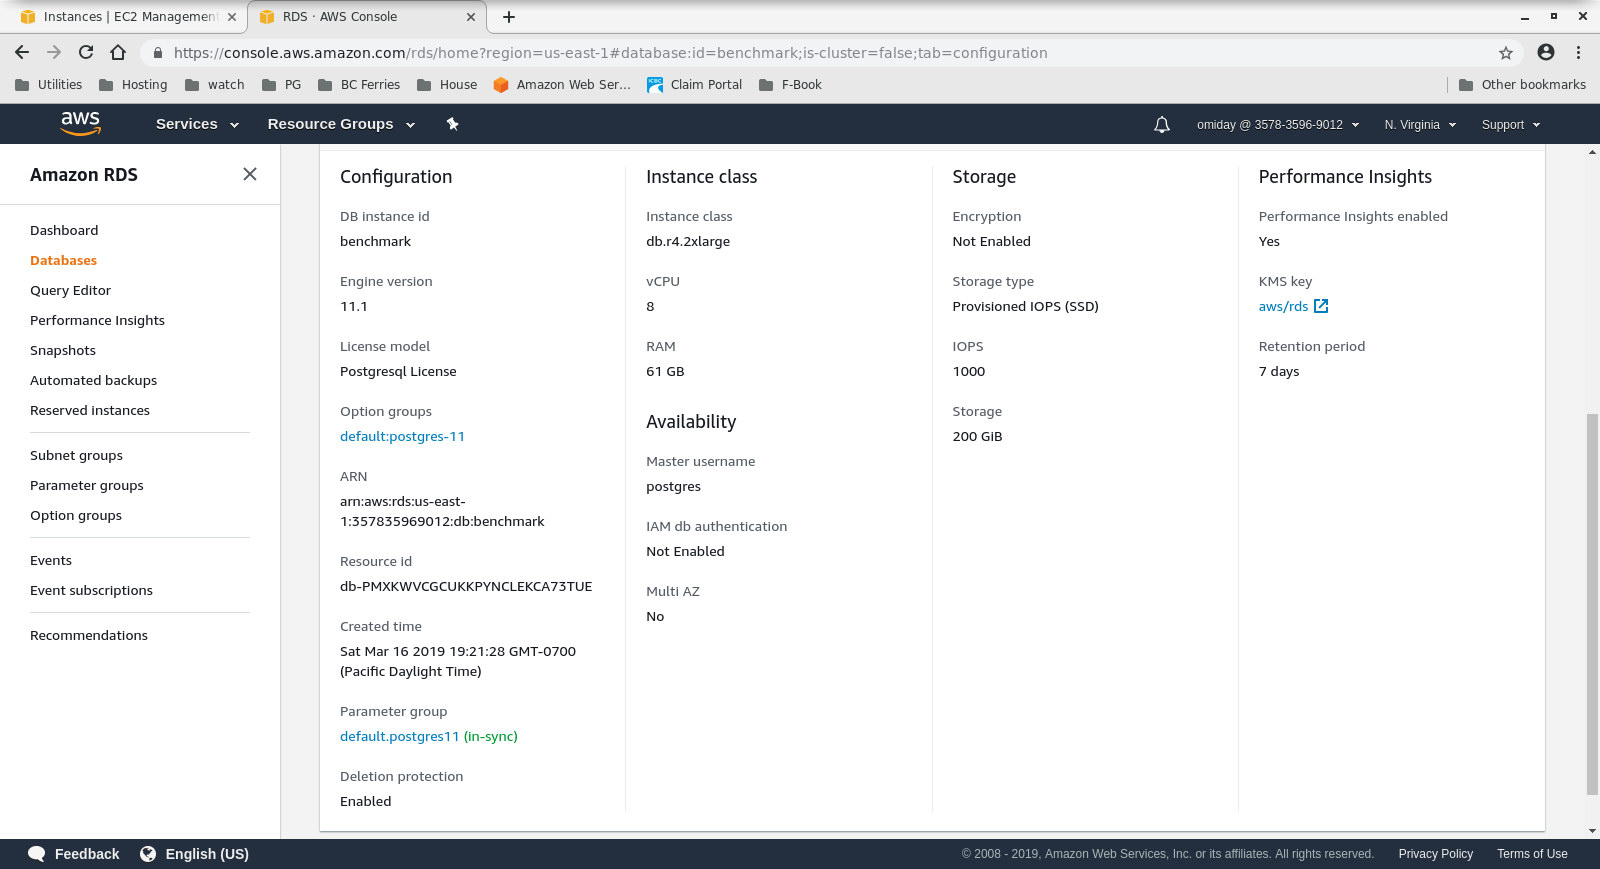
- The DB Cluster is an on demand db.r4.2xlarge:
- vCPU: 8
- RAM: 61GiB
- Storage: EBS Optimized
- Network: 1,750 Mbps Max Bandwidth on an up to 10 Gbps connection
![Database Instance Configuration]()
Database Instance Configuration
Next, install and configure the benchmark tools, pgbench and sysbench, by following the instructions in the Amazon guide.
The last step in getting the environment ready is configuring the PostgreSQL connection parameters. One way of doing it is by initializing the environment variables in .bashrc. Also, we need to set the paths to PostgreSQL binaries and libraries:
export PGHOST=benchmark.ctfirtyhadgr.us-east-1.rds.amazonaws.com
export PGHOST=benchmark.ctfirtyhadgr.us-east-1.rds.amazonaws.com
export PGUSER=postgres
export PGPASSWORD=postgres
export PGDATABASE=postgres
export PATH=$PATH:/usr/local/pgsql/bin
export LD_LIBRARY_PATH=$LD_LIBRARY_PATH:/usr/local/pgsql/lib
Verify that everything is in place:
[root@ip-172-31-84-185 ~]# psql --version
psql (PostgreSQL) 11.1
[root@ip-172-31-84-185 ~]# pgbench --version
pgbench (PostgreSQL) 11.1
[root@ip-172-31-84-185 ~]# sysbench --version
sysbench 0.5
Running the Benchmarks
pgench
First, initialize the pgbench database.
[root@ip-172-31-84-185 ~]# pgbench -i --fillfactor=90 --scale=10000
The initialization process takes some time, and while running generated the following output:
dropping old tables...
NOTICE:  table "pgbench_accounts" does not exist, skipping
NOTICE:  table "pgbench_branches" does not exist, skipping
NOTICE:  table "pgbench_history" does not exist, skipping
NOTICE:  table "pgbench_tellers" does not exist, skipping
creating tables...
generating data...
100000 of 1000000000 tuples (0%) done (elapsed 0.06 s, remaining 599.79 s)
200000 of 1000000000 tuples (0%) done (elapsed 0.15 s, remaining 739.16 s)
300000 of 1000000000 tuples (0%) done (elapsed 0.22 s, remaining 742.21 s)
400000 of 1000000000 tuples (0%) done (elapsed 0.33 s, remaining 814.64 s)
500000 of 1000000000 tuples (0%) done (elapsed 0.41 s, remaining 825.82 s)
600000 of 1000000000 tuples (0%) done (elapsed 0.51 s, remaining 854.13 s)
700000 of 1000000000 tuples (0%) done (elapsed 0.66 s, remaining 937.01 s)
800000 of 1000000000 tuples (0%) done (elapsed 1.52 s, remaining 1897.42 s)
900000 of 1000000000 tuples (0%) done (elapsed 1.66 s, remaining 1840.08 s)

...

500600000 of 1000000000 tuples (50%) done (elapsed 814.78 s, remaining 812.83 s)
500700000 of 1000000000 tuples (50%) done (elapsed 814.81 s, remaining 812.53 s)
500800000 of 1000000000 tuples (50%) done (elapsed 814.83 s, remaining 812.23 s)
500900000 of 1000000000 tuples (50%) done (elapsed 815.11 s, remaining 812.19 s)
501000000 of 1000000000 tuples (50%) done (elapsed 815.20 s, remaining 811.94 s)

...

999200000 of 1000000000 tuples (99%) done (elapsed 1645.02 s, remaining 1.32 s)
999300000 of 1000000000 tuples (99%) done (elapsed 1645.17 s, remaining 1.15 s)
999400000 of 1000000000 tuples (99%) done (elapsed 1645.20 s, remaining 0.99 s)
999500000 of 1000000000 tuples (99%) done (elapsed 1645.23 s, remaining 0.82 s)
999600000 of 1000000000 tuples (99%) done (elapsed 1645.26 s, remaining 0.66 s)
999700000 of 1000000000 tuples (99%) done (elapsed 1645.28 s, remaining 0.49 s)
999800000 of 1000000000 tuples (99%) done (elapsed 1645.51 s, remaining 0.33 s)
999900000 of 1000000000 tuples (99%) done (elapsed 1645.77 s, remaining 0.16 s)
1000000000 of 1000000000 tuples (100%) done (elapsed 1646.03 s, remaining 0.00 s)
vacuuming...
creating primary keys...
total time: 5538.86 s (drop 0.00 s, tables 0.01 s, insert 1647.08 s, commit 0.03 s, primary 1251.60 s, foreign 0.00 s, vacuum 2640.14 s)
done.
Once that part is complete, verify that the PostgreSQL database has been populated. The following simplified version of the disk usage query can be used to return the PostgreSQL database size:
SELECT
   d.datname AS Name,
   pg_catalog.pg_get_userbyid(d.datdba) AS Owner,
   pg_catalog.pg_size_pretty(pg_catalog.pg_database_size(d.datname)) AS SIZE
FROM pg_catalog.pg_database d
WHERE d.datname = 'postgres';
…and the output:
  name   |  owner   |  size
----------+----------+--------
postgres | postgres | 160 GB
(1 row)
With all the preparations completed we can start the read/write pgbench test:
[root@ip-172-31-84-185 ~]# pgbench --protocol=prepared -P 60 --time=600 --client=1000 --jobs=2048
After 10 minutes we get the results:
starting vacuum...end.
progress: 60.0 s, 878.3 tps, lat 1101.258 ms stddev 339.491
progress: 120.0 s, 885.2 tps, lat 1132.301 ms stddev 292.551
progress: 180.0 s, 656.3 tps, lat 1522.102 ms stddev 666.017
progress: 240.0 s, 436.8 tps, lat 2277.140 ms stddev 524.603
progress: 300.0 s, 742.2 tps, lat 1363.558 ms stddev 578.541
progress: 360.0 s, 866.4 tps, lat 1146.972 ms stddev 301.861
progress: 420.0 s, 878.2 tps, lat 1143.939 ms stddev 304.396
progress: 480.0 s, 872.7 tps, lat 1139.892 ms stddev 304.421
progress: 540.0 s, 881.0 tps, lat 1132.373 ms stddev 311.890
progress: 600.0 s, 729.3 tps, lat 1366.517 ms stddev 867.784
transaction type: <builtin: TPC-B (sort of)>
scaling factor: 10000
query mode: prepared
number of clients: 1000
number of threads: 1000
duration: 600 s
number of transactions actually processed: 470582
latency average = 1274.340 ms
latency stddev = 544.179 ms
tps = 782.084354 (including connections establishing)
tps = 783.610726 (excluding connections establishing)
sysbench
The first step is adding some data:
sysbench --test=/usr/local/share/sysbench/oltp.lua \
      --pgsql-host=aurora.cluster-ctfirtyhadgr.us-east-1.rds.amazonaws.com \
      --pgsql-db=postgres \
      --pgsql-user=postgres \
      --pgsql-password=postgres \
      --pgsql-port=5432 \
      --oltp-tables-count=250\
      --oltp-table-size=450000 \
      prepare
The command creates 250 tables, each table having 2 indexes:
sysbench 0.5:  multi-threaded system evaluation benchmark

Creating table 'sbtest1'...
Inserting 450000 records into 'sbtest1'
Creating secondary indexes on 'sbtest1'...
Creating table 'sbtest2'...
...
Creating table 'sbtest250'...
Inserting 450000 records into 'sbtest250'
Creating secondary indexes on 'sbtest250'...
Let’s look at indexes:
postgres=> \di
                        List of relations
Schema |         Name          | Type  |  Owner   |      Table
--------+-----------------------+-------+----------+------------------
public | k_1                   | index | postgres | sbtest1
public | k_10                  | index | postgres | sbtest10
public | k_100                 | index | postgres | sbtest100
public | k_101                 | index | postgres | sbtest101
public | k_102                 | index | postgres | sbtest102
public | k_103                 | index | postgres | sbtest103

...

public | k_97                  | index | postgres | sbtest97
public | k_98                  | index | postgres | sbtest98
public | k_99                  | index | postgres | sbtest99
public | pgbench_accounts_pkey | index | postgres | pgbench_accounts
public | pgbench_branches_pkey | index | postgres | pgbench_branches
public | pgbench_tellers_pkey  | index | postgres | pgbench_tellers
public | sbtest100_pkey        | index | postgres | sbtest100
public | sbtest101_pkey        | index | postgres | sbtest101
public | sbtest102_pkey        | index | postgres | sbtest102
public | sbtest103_pkey        | index | postgres | sbtest103
public | sbtest104_pkey        | index | postgres | sbtest104
public | sbtest105_pkey        | index | postgres | sbtest105

...

public | sbtest97_pkey         | index | postgres | sbtest97
public | sbtest98_pkey         | index | postgres | sbtest98
public | sbtest99_pkey         | index | postgres | sbtest99
public | sbtest9_pkey          | index | postgres | sbtest9
(503 rows)
Looking good...to start the test just run:
sysbench --test=/usr/local/share/sysbench/oltp.lua \
      --pgsql-host=aurora.cluster-ctfirtyhadgr.us-east-1.rds.amazonaws.com \
      --pgsql-db=postgres \
      --pgsql-user=postgres \
      --pgsql-password=postgres \
      --pgsql-port=5432 \
      --oltp-tables-count=250 \
      --oltp-table-size=450000 \
      --max-requests=0 \
      --forced-shutdown \
      --report-interval=60 \
      --oltp_simple_ranges=0 \
      --oltp-distinct-ranges=0 \
      --oltp-sum-ranges=0 \
      --oltp-order-ranges=0 \
      --oltp-point-selects=0 \
      --rand-type=uniform \
      --max-time=600 \
      --num-threads=1000 \
      run
A note of caution:
RDS storage is not “elastic”, meaning that the storage space allocated when creating the instance must be large enough to fit the amount of data generated during benchmark, or else RDS will fail with:
FATAL: PQexec() failed: 7 PANIC:  could not write to file "pg_wal/xlogtemp.29144": No space left on device
server closed the connection unexpectedly
        This probably means the server terminated abnormally
        before or while processing the request.

FATAL: failed query: COMMIT
FATAL: failed to execute function `event': 3
WARNING:  terminating connection because of crash of another server process
DETAIL:  The postmaster has commanded this server process to roll back the current transaction and exit, because another server process exited abnormally and possibly corrupted shared memory.
HINT:  In a moment you should be able to reconnect to the database and repeat your command.
WARNING:  terminating connection because of crash of another server process
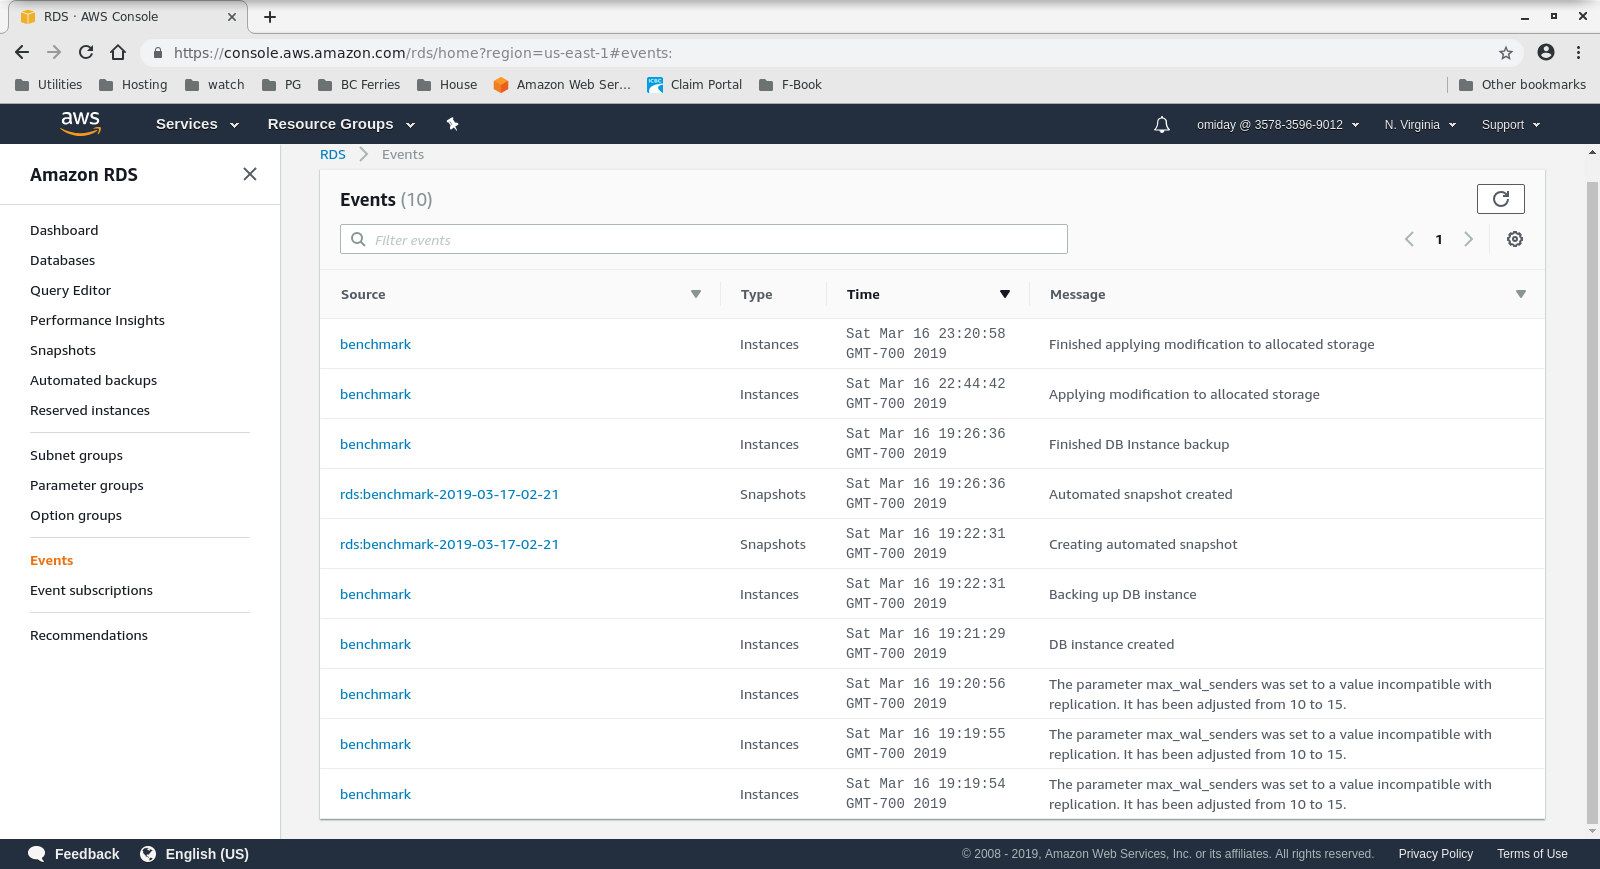
The storage size can be increased without stopping the database, however, it took me about 30 minutes to grow it from 200 GiB to 500 GiB:
![Increasing storage space on RDS]()
Increasing storage space on RDS
And here are the sysbench test results:
sysbench 0.5:  multi-threaded system evaluation benchmark

Running the test with following options:
Number of threads: 1000
Report intermediate results every 60 second(s)
Random number generator seed is 0 and will be ignored

Forcing shutdown in 630 seconds

Initializing worker threads...

Threads started!

[  60s] threads: 1000, tps: 1070.40, reads: 0.00, writes: 4309.35, response time: 1808.81ms (95%), errors: 0.02, reconnects:  0.00
[ 120s] threads: 1000, tps: 889.68, reads: 0.00, writes: 3575.35, response time: 1951.12ms (95%), errors: 0.02, reconnects:  0.00
[ 180s] threads: 1000, tps: 574.57, reads: 0.00, writes: 2320.62, response time: 3936.73ms (95%), errors: 0.00, reconnects:  0.00
[ 240s] threads: 1000, tps: 232.10, reads: 0.00, writes: 928.43, response time: 10994.37ms (95%), errors: 0.00, reconnects:  0.00
[ 300s] threads: 1000, tps: 242.40, reads: 0.00, writes: 969.60, response time: 9412.39ms (95%), errors: 0.00, reconnects:  0.00
[ 360s] threads: 1000, tps: 257.73, reads: 0.00, writes: 1030.98, response time: 8833.64ms (95%), errors: 0.02, reconnects:  0.00
[ 420s] threads: 1000, tps: 264.65, reads: 0.00, writes: 1036.60, response time: 9192.42ms (95%), errors: 0.00, reconnects:  0.00
[ 480s] threads: 1000, tps: 278.07, reads: 0.00, writes: 1134.27, response time: 7133.76ms (95%), errors: 0.00, reconnects:  0.00
[ 540s] threads: 1000, tps: 250.40, reads: 0.00, writes: 1001.53, response time: 9628.97ms (95%), errors: 0.00, reconnects:  0.00
[ 600s] threads: 1000, tps: 249.97, reads: 0.00, writes: 996.92, response time: 10724.58ms (95%), errors: 0.00, reconnects:  0.00
OLTP test statistics:
   queries performed:
      read:                            0
      write:                           1038401
      other:                           519199
      total:                           1557600
   transactions:                        259598 (428.59 per sec.)
   read/write requests:                 1038401 (1714.36 per sec.)
   other operations:                    519199 (857.18 per sec.)
   ignored errors:                      3      (0.00 per sec.)
   reconnects:                          0      (0.00 per sec.)

General statistics:
   total time:                          605.7086s
   total number of events:              259598
   total time taken by event execution: 602999.7582s
   response time:
         min:                                 55.02ms
         avg:                               2322.82ms
         max:                              13133.36ms
         approx.  95 percentile:            8400.39ms

Threads fairness:
   events (avg/stddev):           259.5980/3.20
   execution time (avg/stddev):   602.9998/2.77
PostgreSQL Management & Automation with ClusterControl
Learn about what you need to know to deploy, monitor, manage and scale PostgreSQL
Benchmark Metrics
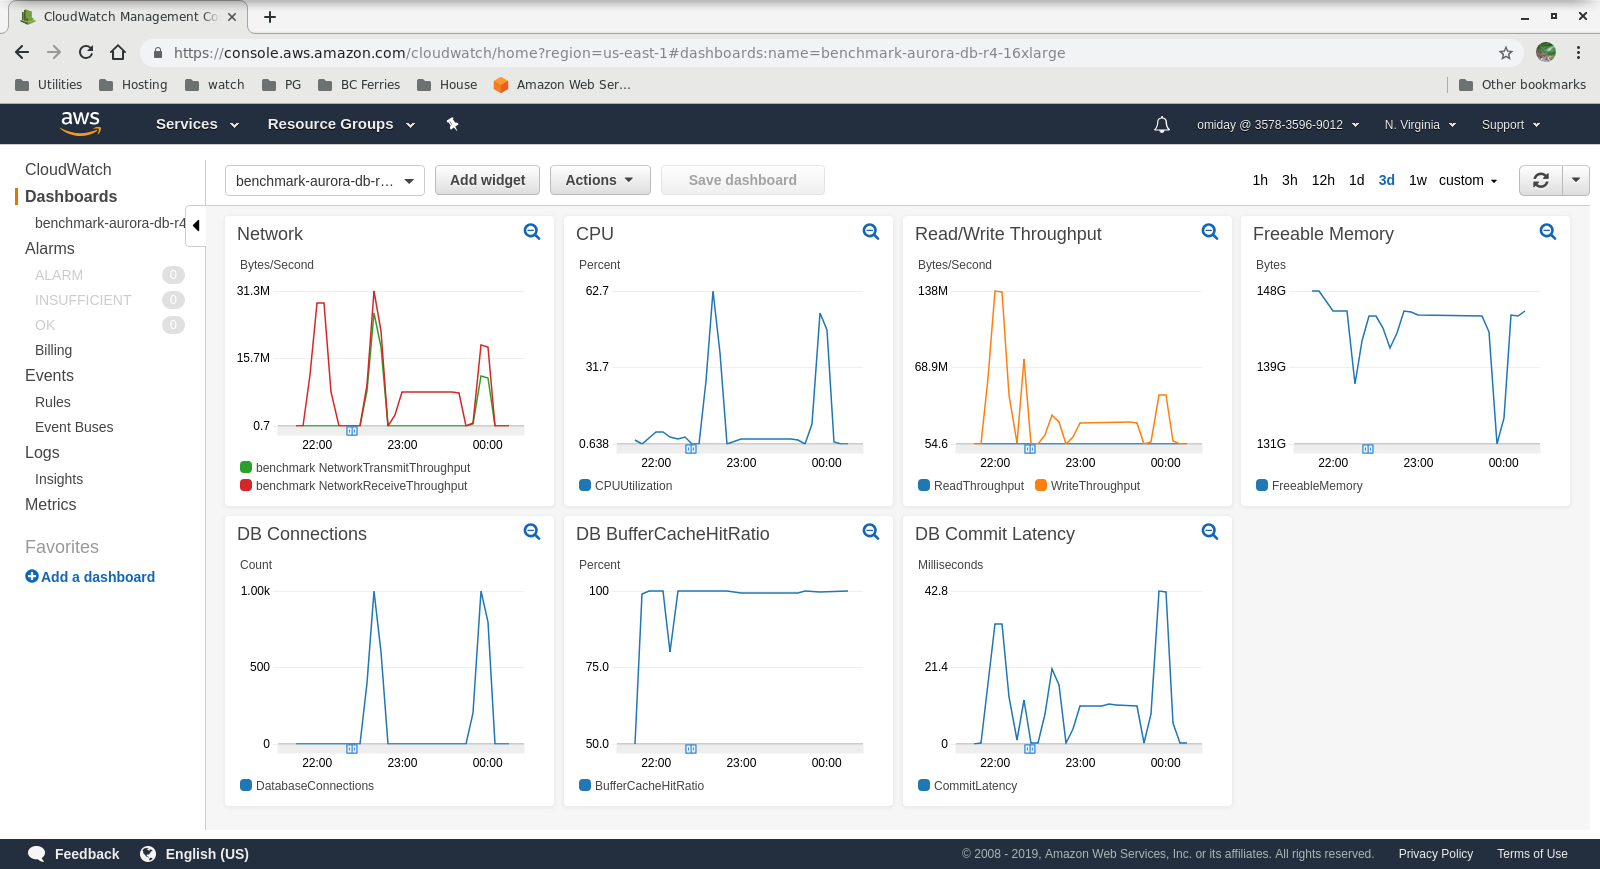
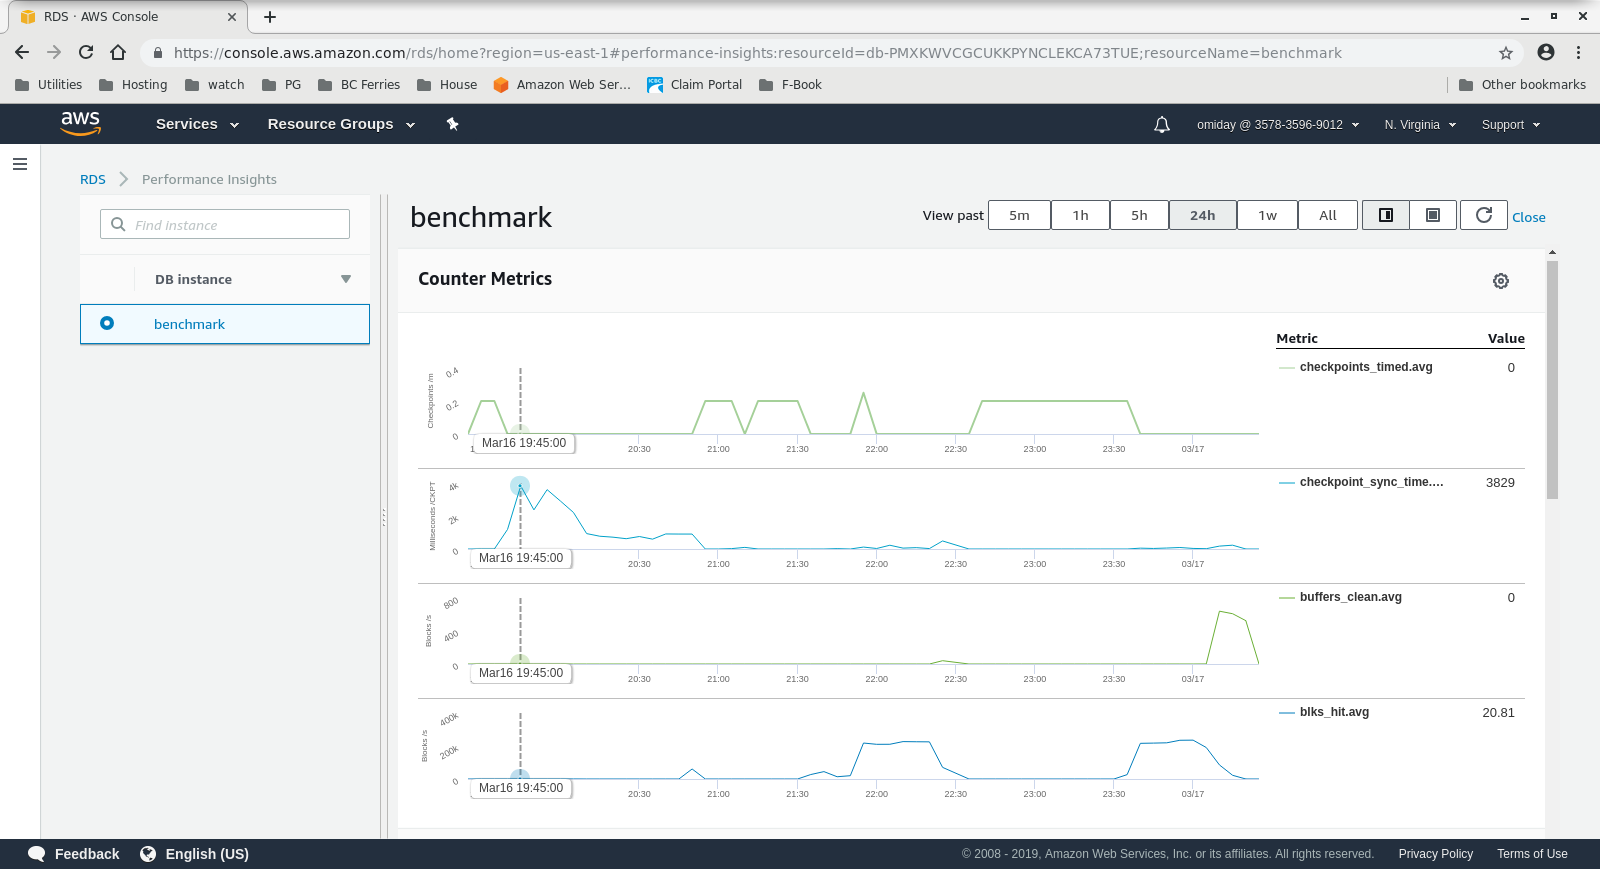
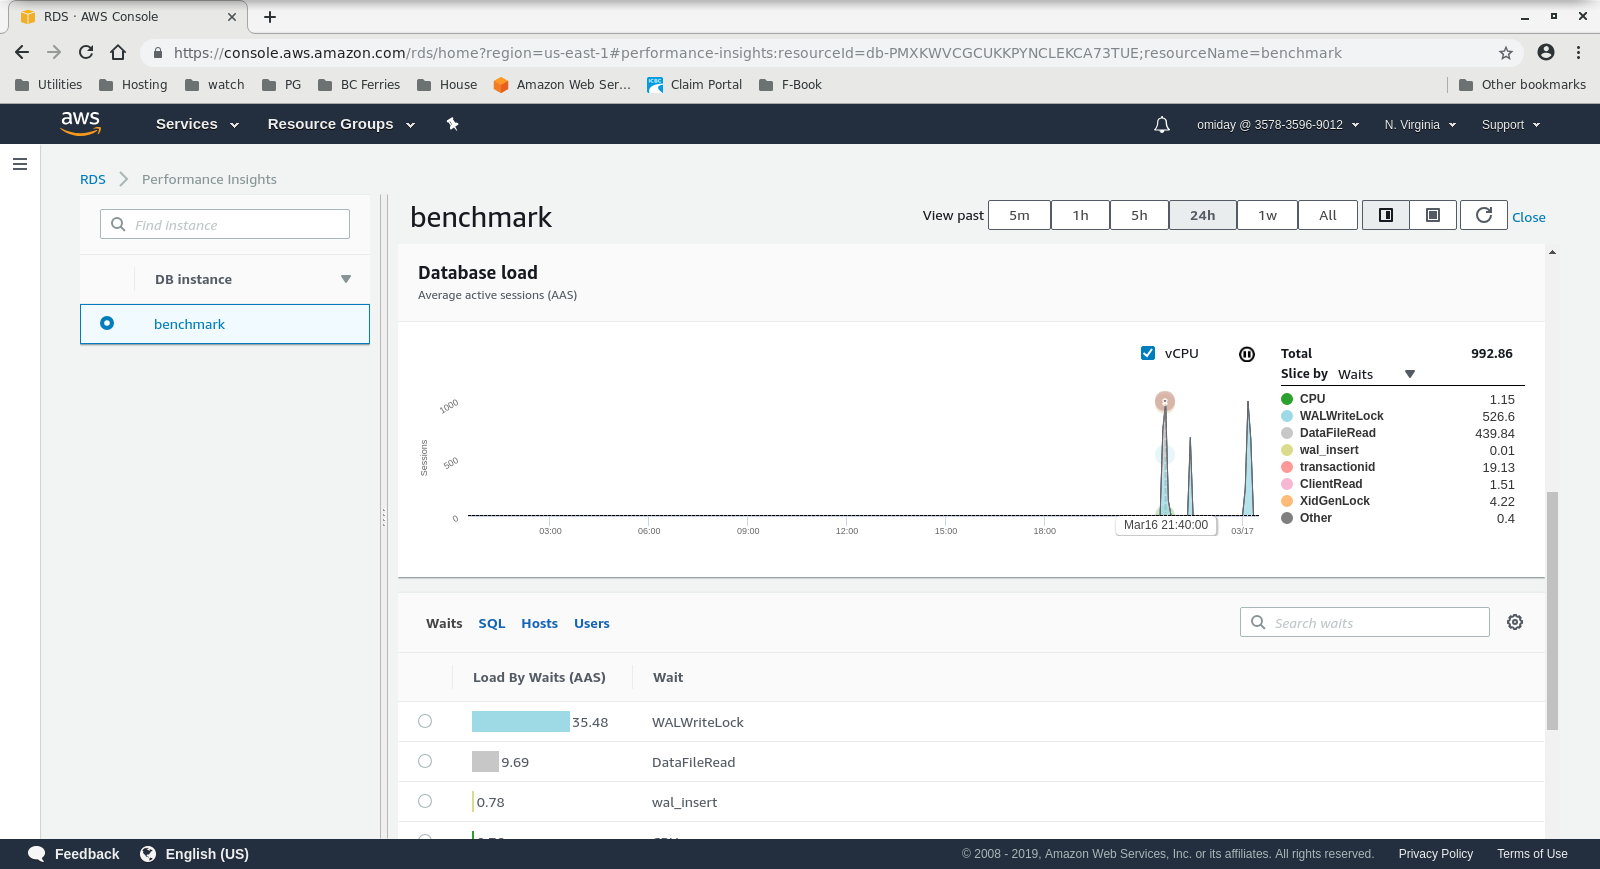
The metrics can be captured using AWS monitoring tools CloudWatch and Performance Insights. Here a few samples for the curious:
![DB Instance CloudWatch Metrics]()
DB Instance CloudWatch Metrics
![RDS Performance Insights - Counter Metrics]()
RDS Performance Insights - Counter Metrics
![RDS Performance Insights - Database Load]()
RDS Performance Insights - Database Load
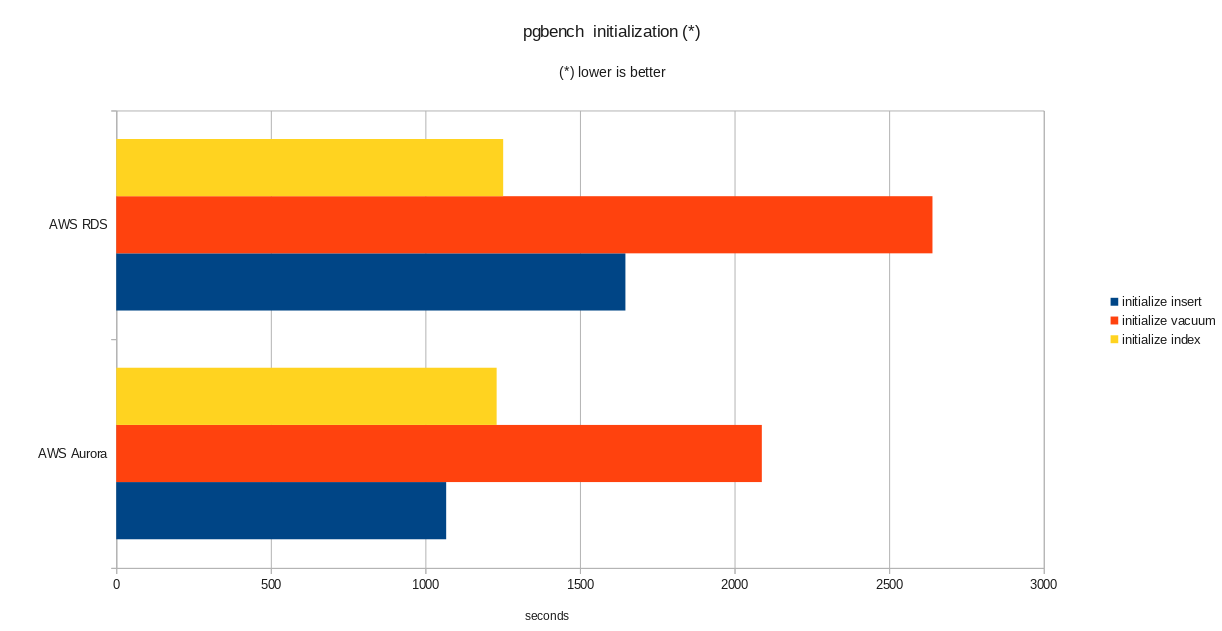
Results
![pgbench initialization results]()
pgbench initialization results
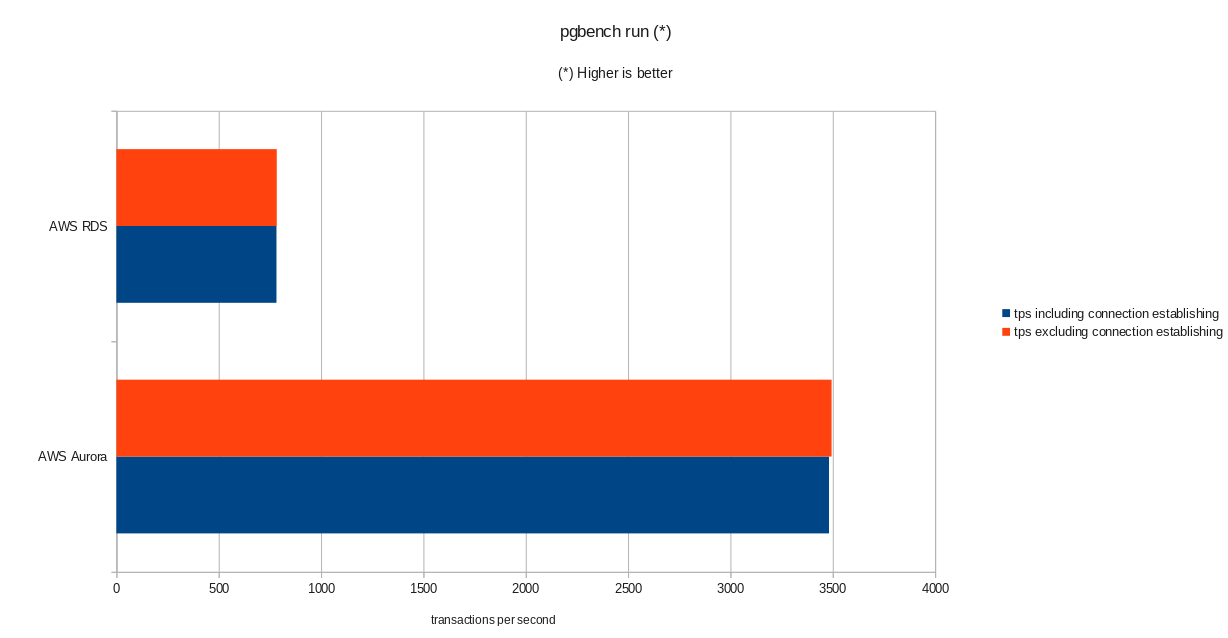
![pgbench run results]()
pgbench run results
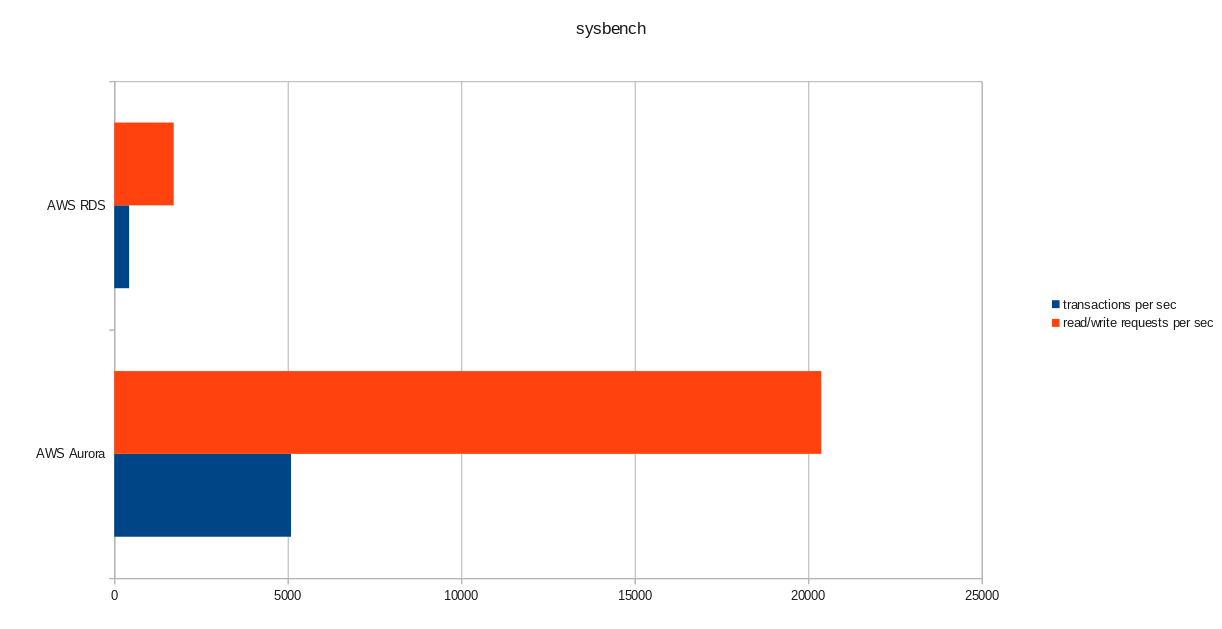
![sysbench results]()
sysbench results
Conclusion
Despite running PostgreSQL version 10.6, Amazon Aurora clearly outperforms RDS which is at version 11.1, and that comes as no surprise. According to Aurora FAQs Amazon went to great lengths in order to improve the overall database performance which was built on top of a redesigned storage engine.
Next in Series
The next part will be about Google Cloud SQL for PostgreSQL.