Quantcast
Channel: Planet PostgreSQL
Viewing all 9665 articles
Browse latest View live

Ibrar Ahmed: PostgreSQL: Access ClickHouse, One of the Fastest Column DBMSs, With clickhousedb_fdw

$
0
0

PostgreSQL logo

Database management systems are meant to house data but, occasionally, they may need to talk with another DBMS. For example, to access an external server which may be hosting a different DBMS. With heterogeneous environments becoming more and more common, a bridge between the servers is established. We call this bridge a “Foreign Data Wrapper” (FDW). PostgreSQL completed its support of SQL/MED (SQL Management of External Data) with release 9.3 in 2013. A foreign data wrapper is a shared library that is loaded by a PostgreSQL server. It enables the creation of foreign tables in PostgreSQL that act as proxies for another data source.

When you query a foreign table, Postgres passes the request to the associated foreign data wrapper. The FDW creates the connection and retrieves or updates the data in the external data store. Since PostgreSQL planner is involved in all of this process as well, it may perform certain operations like aggregate or joins on the data when retrieved from the data source. I cover some of these later in this post.

ClickHouse Database

ClickHouse is an open source column based database management system which claims to be 100–1,000x faster than traditional approaches, capable of processing of more than a billion rows in less than a second.

clickhousedb_fdw

clickhousedb_fdw is an open source project – GPLv2 licensed – from Percona. Here’s the link for GitHub project repository:

https://github.com/Percona-Lab/clickhousedb_fdw

It is an FDW for ClickHouse that allows you to SELECT from, and INSERT INTO, a ClickHouse database from within a PostgreSQL v11 server.

The FDW supports advanced features like aggregate pushdown and joins pushdown. These significantly improve performance by utilizing the remote server’s resources for these resource intensive operations.

If you would like to follow this post and try the FDW between Postgres and ClickHouse, you can download and set up the ontime dataset for ClickHouse.  After following the instructions, the test that you have the desired data. The ClickHouse client is a client CLI for the ClickHouse Database.

Prepare Data for ClickHouse

Now the data is ready in ClickHouse, the next step is to set up PostgreSQL. We need to create a ClickHouse foreign server, user mapping, and foreign tables.

Install the clickhousedb_fdw extension

There are manual ways to install the clickhousedb_fdw, but clickhousedb_fdw uses PostgreSQL’s coolest extension install feature. By just entering a SQL command you can use the extension:

CREATE EXTENSION clickhousedb_fdw;

CREATE SERVER clickhouse_svr FOREIGN DATA WRAPPER clickhousedb_fdw
OPTIONS(dbname 'test_database', driver '/use/lib/libclickhouseodbc.so');

CREATE USER MAPPING FOR CURRENT_USER SERVER clickhouse_svr;

CREATE FOREIGN TABLE clickhouse_tbl_ontime (  "Year" Int,  "Quarter" Int8,  "Month" Int8,  "DayofMonth" Int8,  "DayOfWeek" Int8,  "FlightDate" Date,  "UniqueCarrier" Varchar(7),  "AirlineID" Int,  "Carrier" Varchar(2),  "TailNum" text,  "FlightNum" text,  "OriginAirportID" Int,  "OriginAirportSeqID" Int,  "OriginCityMarketID" Int,  "Origin" Varchar(5),  "OriginCityName" text,  "OriginState" Varchar(2),  "OriginStateFips" text,  "OriginStateName" text,  "OriginWac" Int,  "DestAirportID" Int,  "DestAirportSeqID" Int,  "DestCityMarketID" Int,  "Dest" Varchar(5),  "DestCityName" text,  "DestState" Varchar(2),  "DestStateFips" text,  "DestStateName" text,  "DestWac" Int,  "CRSDepTime" Int,  "DepTime" Int,  "DepDelay" Int,  "DepDelayMinutes" Int,  "DepDel15" Int,  "DepartureDelayGroups" text,  "DepTimeBlk" text,  "TaxiOut" Int,  "WheelsOff" Int,  "WheelsOn" Int,  "TaxiIn" Int,  "CRSArrTime" Int,  "ArrTime" Int,  "ArrDelay" Int,  "ArrDelayMinutes" Int,  "ArrDel15" Int,  "ArrivalDelayGroups" Int,  "ArrTimeBlk" text,  "Cancelled" Int8,  "CancellationCode" Varchar(1),  "Diverted" Int8,  "CRSElapsedTime" Int,  "ActualElapsedTime" Int,  "AirTime" Int,  "Flights" Int,  "Distance" Int,  "DistanceGroup" Int8,  "CarrierDelay" Int,  "WeatherDelay" Int,  "NASDelay" Int,  "SecurityDelay" Int,  "LateAircraftDelay" Int,  "FirstDepTime" text,  "TotalAddGTime" text,  "LongestAddGTime" text,  "DivAirportLandings" text,  "DivReachedDest" text,  "DivActualElapsedTime" text,  "DivArrDelay" text,  "DivDistance" text,  "Div1Airport" text,  "Div1AirportID" Int,  "Div1AirportSeqID" Int,  "Div1WheelsOn" text,  "Div1TotalGTime" text,  "Div1LongestGTime" text,  "Div1WheelsOff" text,  "Div1TailNum" text,  "Div2Airport" text,  "Div2AirportID" Int,  "Div2AirportSeqID" Int,  "Div2WheelsOn" text,  "Div2TotalGTime" text,  "Div2LongestGTime" text,"Div2WheelsOff" text,  "Div2TailNum" text,  "Div3Airport" text,  "Div3AirportID" Int,  "Div3AirportSeqID" Int,  "Div3WheelsOn" text,  "Div3TotalGTime" text,  "Div3LongestGTime" text,  "Div3WheelsOff" text,  "Div3TailNum" text,  "Div4Airport" text,  "Div4AirportID" Int,  "Div4AirportSeqID" Int,  "Div4WheelsOn" text,  "Div4TotalGTime" text,  "Div4LongestGTime" text,  "Div4WheelsOff" text,  "Div4TailNum" text,  "Div5Airport" text,  "Div5AirportID" Int,  "Div5AirportSeqID" Int,  "Div5WheelsOn" text,  "Div5TotalGTime" text,  "Div5LongestGTime" text,  "Div5WheelsOff" text,  "Div5TailNum" text) server clickhouse_svr options(table_name 'ontime');

postgres=# SELECT a."Year", c1/c2 as Value FROM ( select "Year", count(*)*1000 as c1          
           FROM clickhouse_tbl_ontime          
           WHERE "DepDelay">10 GROUP BY "Year") a                        
           INNER JOIN (select "Year", count(*) as c2 from clickhouse_tbl_ontime          
           GROUP BY "Year" ) b on a."Year"=b."Year" LIMIT 3;
Year |   value    
------+------------
1987 |        199
1988 | 5202096000
1989 | 5041199000
(3 rows)

Performance Features

PostgreSQL has improved foreign data wrapper processing by added the pushdown feature. Push down improves performance significantly, as the processing of data takes place earlier in the processing chain. Push down abilities include:

  • Operator and function Pushdown
  • Predicate Pushdown
  • Aggregate Pushdown
  • Join Pushdown

Operator and function Pushdown

The function and operators send to Clickhouse instead of calculating and filtering at the PostgreSQL end.

postgres=# EXPLAIN VERBOSE SELECT avg("DepDelay") FROM clickhouse_tbl_ontime WHERE "DepDelay" <10; 
           Foreign Scan  (cost=1.00..-1.00 rows=1000 width=32) Output: (avg("DepDelay"))  
           Relations: Aggregate on (clickhouse_tbl_ontime)  
           Remote SQL: SELECT avg("DepDelay") FROM "default".ontime WHERE (("DepDelay" < 10))(4 rows)

Predicate Pushdown

Instead of filtering the data at PostgreSQL, clickhousedb_fdw send the predicate to Clikhouse Database.

postgres=# EXPLAIN VERBOSE SELECT "Year" FROM clickhouse_tbl_ontime WHERE "Year"=1989;                                  
           Foreign Scan on public.clickhouse_tbl_ontime  Output: "Year"  
           Remote SQL: SELECT "Year" FROM "default".ontime WHERE (("Year" = 1989)

Aggregate Pushdown

Aggregate push down is a new feature of PostgreSQL FDW. There are currently very few foreign data wrappers that support aggregate push down – clickhousedb_fdw is one of them. Planner decides which aggregates are pushed down and which aren’t. Here is an example for both cases.

postgres=# EXPLAIN VERBOSE SELECT count(*) FROM clickhouse_tbl_ontime;
          Foreign Scan (cost=1.00..-1.00 rows=1000 width=8)
          Output: (count(*)) Relations: Aggregate on (clickhouse_tbl_ontime)
          Remote SQL: SELECT count(*) FROM "default".ontime

Join Pushdown

Again, this is a new feature in PostgreSQL FDW, and our clickhousedb_fdw also supports join push down. Here’s an example of that.

postgres=# EXPLAIN VERBOSE SELECT a."Year"
                           FROM clickhouse_tbl_ontime a
                           LEFT JOIN clickhouse_tbl_ontime b ON a."Year" = b."Year";
        Foreign Scan (cost=1.00..-1.00 rows=1000 width=50);
        Output: a."Year" Relations: (clickhouse_tbl_ontime a) LEFT JOIN (clickhouse_tbl_ontime b)
        Remote SQL: SELECT r1."Year" FROM&nbsp; "default".ontime r1 ALL LEFT JOIN "default".ontime r2 ON (((r1."Year" = r2."Year")))

Percona’s support for PostgreSQL

As part of our commitment to being unbiased champions of the open source database eco-system, Percona offers support for PostgreSQL – you can read more about that here. And as you can see, as part of our support commitment, we’re now developing our own open source PostgreSQL projects such as the clickhousedb_fdw. Subscribe to the blog to be amongst the first to know of PostgreSQL and other open source projects from Percona.

As an author of the new clickhousdb_fdw – as well as other  FDWs – I’d be really happy to hear of your use cases and your experience of using this feature.


Photo by Hidde Rensink on Unsplash


Hubert 'depesz' Lubaczewski: Waiting for PostgreSQL 12 – REINDEX CONCURRENTLY

$
0
0
On 29th of March 2019, Peter Eisentraut committed patch: REINDEX CONCURRENTLY   This adds the CONCURRENTLY option to the REINDEX command. A REINDEX CONCURRENTLY on a specific index creates a new index (like CREATE INDEX CONCURRENTLY), then renames the old index away and the new index in place and adjusts the dependencies, and then drops … Continue reading "Waiting for PostgreSQL 12 – REINDEX CONCURRENTLY"

Craig Kerstiens: A health checkup playbook for your Postgres database

$
0
0

I talk with a lot of folks that set their database up, start working with it, and then are surprised by issues that suddenly crop up out of nowhere. The reality is, so many don’t want to have to be a DBA, instead you would rather build features and just have the database work. But your is that a database is a living breathing thing. As the data itself changes what is the right way to query and behave changes. Making sure your database is healthy and performing at it’s maximum level doesn’t require a giant overhaul constantly. In fact you can probably view it similar to how you approach personal health. Regular check-ups allow you to make small but important adjustments without having to make dramatic life altering changes to keep you on the right path.

After years of running and managing literally millions of Postgres databases, here’s my breakdown of what your regular Postgres health check should look like. Consider running this on a monthly basis to be able to make small tweaks and adjustments and avoid the drastic changes.

Cache rules everything around me

For many applications not all the data is accessed all the time. Instead certain datasets are accessed one and then for some period of time, then the data you’re accessing changes. Postgres in fact is quite good at keeping frequently accessed data in memory.

Your cache hit ratio tells you how often your data is served from in memory vs. having to go to disk. Serving from memory vs. going to disk will be orders of magnitude faster, thus the more you can keep in memory the better. Of course you could provision an instance with as much memory as you have data, but you don’t necessarily have to. Instead watching your cache hit ratio and ensuring it is at 99% is a good metric for proper performance.

You can monitor your cache hit ratio with:

SELECTsum(heap_blks_read)asheap_read,sum(heap_blks_hit)asheap_hit,sum(heap_blks_hit)/(sum(heap_blks_hit)+sum(heap_blks_read))asratioFROMpg_statio_user_tables;

Be careful of dead tuples

Under the covers Postgres is essentially a giant append only log. When you write data it appends to the log, when you update data it marks the old record as invalid and writes a new one, when you delete data it just marks it invalid. Later Postgres comes through and vacuums those dead records (also known as tuples).

All those unvacuumed dead tuples are what is known as bloat. Bloat can slow down other writes and create other issues. Paying attention to your bloat and when it is getting out of hand can be key for tuning vacuum on your database.

WITHconstantsAS(SELECTcurrent_setting('block_size')::numericASbs,23AShdr,4ASma),bloat_infoAS(SELECTma,bs,schemaname,tablename,(datawidth+(hdr+ma-(casewhenhdr%ma=0THENmaELSEhdr%maEND)))::numericASdatahdr,(maxfracsum*(nullhdr+ma-(casewhennullhdr%ma=0THENmaELSEnullhdr%maEND)))ASnullhdr2FROM(SELECTschemaname,tablename,hdr,ma,bs,SUM((1-null_frac)*avg_width)ASdatawidth,MAX(null_frac)ASmaxfracsum,hdr+(SELECT1+count(*)/8FROMpg_statss2WHEREnull_frac<>0ANDs2.schemaname=s.schemanameANDs2.tablename=s.tablename)ASnullhdrFROMpg_statss,constantsGROUPBY1,2,3,4,5)ASfoo),table_bloatAS(SELECTschemaname,tablename,cc.relpages,bs,CEIL((cc.reltuples*((datahdr+ma-(CASEWHENdatahdr%ma=0THENmaELSEdatahdr%maEND))+nullhdr2+4))/(bs-20::float))ASottaFROMbloat_infoJOINpg_classccONcc.relname=bloat_info.tablenameJOINpg_namespacennONcc.relnamespace=nn.oidANDnn.nspname=bloat_info.schemanameANDnn.nspname<>'information_schema'),index_bloatAS(SELECTschemaname,tablename,bs,COALESCE(c2.relname,'?')ASiname,COALESCE(c2.reltuples,0)ASituples,COALESCE(c2.relpages,0)ASipages,COALESCE(CEIL((c2.reltuples*(datahdr-12))/(bs-20::float)),0)ASiotta-- very rough approximation, assumes all colsFROMbloat_infoJOINpg_classccONcc.relname=bloat_info.tablenameJOINpg_namespacennONcc.relnamespace=nn.oidANDnn.nspname=bloat_info.schemanameANDnn.nspname<>'information_schema'JOINpg_indexiONindrelid=cc.oidJOINpg_classc2ONc2.oid=i.indexrelid)SELECTtype,schemaname,object_name,bloat,pg_size_pretty(raw_waste)aswasteFROM(SELECT'table'astype,schemaname,tablenameasobject_name,ROUND(CASEWHENotta=0THEN0.0ELSEtable_bloat.relpages/otta::numericEND,1)ASbloat,CASEWHENrelpages<ottaTHEN'0'ELSE(bs*(table_bloat.relpages-otta)::bigint)::bigintENDASraw_wasteFROMtable_bloatUNIONSELECT'index'astype,schemaname,tablename||'::'||inameasobject_name,ROUND(CASEWHENiotta=0ORipages=0THEN0.0ELSEipages/iotta::numericEND,1)ASbloat,CASEWHENipages<iottaTHEN'0'ELSE(bs*(ipages-iotta))::bigintENDASraw_wasteFROMindex_bloat)bloat_summaryORDERBYraw_wasteDESC,bloatDESC

Query courtesy of Heroku’s pg-extras

Over optimizing is a thing

We always our database to be performant, so in order to do that we keep things in memory/cache (see earlier) and we index things so we don’t have to scan everything on disk. But there is a trade-off when it comes to indexing your database. Each index the system has to maintain will slow down your write throughput on the database. This is fine when you do need to speed up queries, as long as they’re being utilized. If you added an index years ago, but something within your application changed and you no longer need it best to remove it.

Postgres makes it simply to query for unused indexes so you can easily give yourself back some performance by removing them:

SELECTschemaname||'.'||relnameAStable,indexrelnameASindex,pg_size_pretty(pg_relation_size(i.indexrelid))ASindex_size,idx_scanasindex_scansFROMpg_stat_user_indexesuiJOINpg_indexiONui.indexrelid=i.indexrelidWHERENOTindisuniqueANDidx_scan<50ANDpg_relation_size(relid)>5*8192ORDERBYpg_relation_size(i.indexrelid)/nullif(idx_scan,0)DESCNULLSFIRST,pg_relation_size(i.indexrelid)DESC;

Check in on your query performance

In an earlier blog post we talked about how useful pg_stat_statements was for monitoring your database query performance. It records a lot of valuable stats about which queries are run, how fast they return, how many times their run, etc. Checking in on this set of queries regularly can tell you where is best to add indexes or optimize your application so your query calls may not be so excessive.

Thanks to a HN commenter on our earlier post we have a great query that is easy to tweak to show different views based on all that data:

SELECTquery,calls,total_time,total_time/callsastime_per,stddev_time,rows,rows/callsasrows_per,100.0*shared_blks_hit/nullif(shared_blks_hit+shared_blks_read,0)AShit_percentFROMpg_stat_statementsWHEREquerynotsimilarto'%pg_%'andcalls>500--ORDER BY calls--ORDER BY total_timeorderbytime_per--ORDER BY rows_perDESCLIMIT20;

An apple a day…

A regular health check for your database saves you a lot of time in the long run. It allows you to gradually maintain and improve things without huge re-writes. I’d personally recommend a monthly or bimonthly check-in on all of the above to ensure things are in a good state.

Hubert 'depesz' Lubaczewski: Waiting for PostgreSQL 12 – Generated columns

$
0
0
On 30th of March 2019, Peter Eisentraut committed patch: Generated columns   This is an SQL-standard feature that allows creating columns that are computed from expressions rather than assigned, similar to a view or materialized view but on a column basis.   This implements one kind of generated column: stored (computed on write). Another kind, … Continue reading "Waiting for PostgreSQL 12 – Generated columns"

Hubert 'depesz' Lubaczewski: Waiting for PostgreSQL 12 – Report progress of CREATE INDEX operations

Hubert 'depesz' Lubaczewski: Waiting for PostgreSQL 12 – Log all statements from a sample of transactions

Julien Rouhaud: New in pg12: Statistics on checkums errors

$
0
0

Data checksums

Added in PostgreSQL 9.3, data checksums can help to detect data corruption happening on the storage side.

Checksums are only enabled if the instance was setup using initdb --data-checksums (which isn’t the default behavior), or if activated afterwards with the new pg_checksums tool also added in PostgreSQL 12.

When enabled, checksums are written each time a block is written to disk, and verified each time a block is read from disk (or from the operating system cache). If the checksum verification fails, an error is reported in the logs. If the block was read by a backend, the query will obviously fails, but if the block was read by a BASE_BACKUP operation (such as pg_basebackup), the command will continue its processing . While data checkums will only catch a subset of possible problems, they still have some values, especially if you don’t trust your storage reliability.

Up to PostgreSQL 11, any checksum validation error could only be found by looking into the logs, which clearly isn’t convenient if you want to monitor such error.

New counters available in pg_stat_database

To make checksum errors easier to monitor, and help users to react as soon as such a problem occurs, PostgreSQL 12 adds new counters in the pg_stat_database view:

commit 6b9e875f7286d8535bff7955e5aa3602e188e436
Author: Magnus Hagander <magnus@hagander.net>
Date:   Sat Mar 9 10:45:17 2019 -0800

Track block level checksum failures in pg_stat_database

This adds a column that counts how many checksum failures have occurred
on files belonging to a specific database. Both checksum failures
during normal backend processing and those created when a base backup
detects a checksum failure are counted.

Author: Magnus Hagander
Reviewed by: Julien Rouhaud


commit 77bd49adba4711b4497e7e39a5ec3a9812cbd52a
Author: Magnus Hagander <magnus@hagander.net>
Date:   Fri Apr 12 14:04:50 2019 +0200

    Show shared object statistics in pg_stat_database

    This adds a row to the pg_stat_database view with datoid 0 and datname
    NULL for those objects that are not in a database. This was added
    particularly for checksums, but we were already tracking more satistics
    for these objects, just not returning it.

    Also add a checksum_last_failure column that holds the timestamptz of
    the last checksum failure that occurred in a database (or in a
    non-dataabase file), if any.

    Author: Julien Rouhaud <rjuju123@gmail.com>


commit 252b707bc41cc9bf6c55c18d8cb302a6176b7e48
Author: Magnus Hagander <magnus@hagander.net>
Date:   Wed Apr 17 13:51:48 2019 +0200

    Return NULL for checksum failures if checksums are not enabled

    Returning 0 could falsely indicate that there is no problem. NULL
    correctly indicates that there is no information about potential
    problems.

    Also return 0 as numbackends instead of NULL for shared objects (as no
    connection can be made to a shared object only).

    Author: Julien Rouhaud <rjuju123@gmail.com>
    Reviewed-by: Robert Treat <rob@xzilla.net>

Those counters will reflect checksum validation errors for both backend activity and BASE_BACKUP activity, per database.

rjuju=#\dpg_stat_databaseView"pg_catalog.pg_stat_database"Column|Type|Collation|Nullable|Default-----------------------+--------------------------+-----------+----------+---------datid|oid|||datname|name|||[...]checksum_failures|bigint|||checksum_last_failure|timestampwithtimezone|||[...]stats_reset|timestampwithtimezone|||

The checksum_failures column will show a cumulated number of errors, and the checksum_last_failure column will show the timestamp of the last checksum failure on the database (NULL if no error ever happened).

To avoid any confusion (thanks to Robert Treat for pointing it), those two columns will always return NULL if data checksums aren’t enabled, so people won’t mistakenly think that data checksums are always successfully verified.

As a side effect, pg_stat_database will also now show available statistics for shared objects (such as the pg_database table for instance), in a new row with datid valued to 0, and a NULLdatname. Those were always accumulated, but weren’t displayed in any system view until now.

A dedicated check is also already planned in check_pgactivity!

New in pg12: Statistics on checkums errors was originally published by Julien Rouhaud at rjuju's home on April 18, 2019.

Andrew Dunstan: PostgreSQL Buildfarm Client Release 10

$
0
0

Announcing Release 10 of the PostgreSQL Buildfarm client

Principal feature: support for non-standard repositories:

  • support multi-element branch names, such as “dev/featurename” or “bug/ticket_number/branchname”
  • provide a get_branches() method in SCM module
  • support regular expression branches of interest. This is matched against the list of available branches
  • prune branches when doing git fetch.

This feature and some server side changes will be explored in detail in my presentation at pgCon in Ottawa next month. The feature doesn’t affect owners of animals in our normal public Build Farm. However, the items below are of use to them.

Other features/ behaviour changes:

  • support for testing cross version upgrade extended back to 9.2
  • support for core Postgres changes:
    • extended support for USE_MODULE_DB
    • new extra_float_digits regime
    • removal of user table oid support
    • removal of abstime and friends
    • changed log file locations
  • don’t search for valgrind messages unless valgrind is configured
  • make detection of when NO_TEMP_INSTALL is allowed more bulletproof

There are also various minor bug fixes and code improvements.

The release can be downloaded from https://github.com/PGBuildFarm/client-code/archive/REL_10.tar.gz or https://buildfarm.postgresql.org/downloads/latest-client.tgz


Shaun M. Thomas: I am Developer! (And You Can Too!)

$
0
0

A while back, 2ndQuadrant notified a few of us that we should get more involved in Postgres Development in some capacity. Being as I’ve essentially fallen off the map in corresponding with the mailing lists in general, it would be a good way to get back into the habit.

But wait! Don’t we want more community involvement in general? Of course we do! So now is also a great opportunity to share my journey in the hopes others follow suit. Let’s go!

In the Beginning

So how does one start contributing? Do I have to know C? Must I poke around in the internals for weeks to form an understanding, however so tenuous, of the Black Magic that animates Postgres? Perhaps I should chant incantations to summon some dark entity to grant otherworldly powers necessary to comprehend the mind-bleedingly high-level conversations regularly churning within the deeply foreboding confines of the Hackers mailing list.

No.

God no.

If those were the prerequisites for getting involved, there would be approximately one person pushing Postgres forward, and his name is Tom Lane. Everyone else would be too terrified to even approach the process. I certainly count myself among those more timid individuals.

Instead, let’s start somewhere simple, and with something small. Sometimes all it takes to make a difference is to piggyback on the coattails of someone else who knows what they’re doing. If we’re too inexperienced to submit a patch, maybe we can review one instead.

Getting the Party Started (In Here)

Postgres development marches forward steadily in a form of punctuated equilibrium. Every few months, we throw a bunch of patches against the wall, and see what sticks. That cadence is currently marshaled by a master list of past and present commit fests going back to late 2014. It’s hardly an exhaustive resource dating back to antiquity, but it doesn’t need to be.

All we really need is the most recent iteration that’s in progress. At the time of this writing, that’s 2019-03.

Decisions, Decisions

Now for what might just be the most difficult portion of the whole endeavor: choosing a patch to review. Patches are grouped by category, and range from the relatively mundane documentation revision, to the more brain numbing voodoo of planner bugs.

Some of these, by their very nature, may seem storied and impenetrable. The Logical decoding of two-phase transactions patch for example, has been in commitfests since early 2017! It’s probably best to focus on patches that offer high utility, or seem personally interesting. There’s certainly no shortage of selection!

Just browse through a few, click through the patches until one seems interesting, and read the emails. As a personal hint, use this link after opening the "Emails" link in another tab:

Click: Whole Thread
Don’t click through each message, see them all!

It will let you view the entire conversation on the patch until now, and can be invaluable for understanding some of the background before moving forward.

I personally elected to review the patch on a separate table level option to control compression for a few reasons:

  1. It’s really just an extension on the Postgres Grand Unified Config based on a parameter that already exists: toast_tuple_target.
  2. The patch included documentation for the new parameter, so I’d have some basis for how it should work.
  3. The patch included tests, so I could compare how Postgres behaved with and without it.
  4. The existing conversation was relatively short, so I could provide some meaningful input that wouldn’t be immediately overshadowed by more experienced participants. Gotta maximize that value!
  5. More selfishly, I worked with the author, so I could clarify things off list if necessary.

With that out of the way, it was time press "Become Reviewer" to get to "work".

Bits and Pieces

Each patch summary page will, or should, list all of the patches in the "Emails" pane. Simply grab the latest of these and download it into your local copy of the Postgres source.

Wait, you don’t have one of those? Do you have git installed? If not, that’s a whole different conversation. So let’s just assume git is available and get some Postgres code:

git clone git://git.postgresql.org/git/postgresql.git

Then the easiest way to proceed is to work on your own local branch. In most cases, we want to apply our patch to HEAD, so we just need to create a new branch as a snapshot of that before we start reviewing. This is what I did:

git checkout -b cf_table_compress

Now when HEAD advances, it won’t mess with our testing until we rebase or pull HEAD into our branch. But what about obtaining and applying the patch? Remember those email links? Know how to use wget? Great! Here’s the patch I retrieved:

wget https://www.postgresql.org/message-id/attachment/99931/0001-Add-a-table-level-option-to-control-compression.patch

Then we need to apply the patch itself. The patch utility applies patches to code referenced in the patch file. Using it can sometimes be confusing, but there’s really only two things relevant to us: the -p parameter, and the patch itself.

Just drop the patch in the base folder of your Postgres repository clone, and do this:

patch -p1 < 0001-Add-a-table-level-option-to-control-compression.patch

Thus a level-1 prefix application of the supplied patch is now applied to the Postgres code, assuming there were no errors. That in fact, can be our first criteria.

  1. Did the patch apply cleanly?

Compile, compile, compile

So what now? Well, really we just follow the usual process of building most code with one exception. If we want to test a running Postgres instance, it's best to put the binaries somewhere they won't interfere with the rest of the system, a container, or otherwise. The easiest way is to just set the --prefix before building.

So do this:

./configure --prefix=/opt/cf_table_compress
make
make install

And it's also good to do this:

make check
make installcheck

That will invoke the test routines both before and after installing the build, to prove everything works. It's a good idea to do this even if the patch didn't include its own tests, because the patch itself may have broken existing functionality. So now we have some additional criteria to share:

  1. Did the code compile cleanly?
  2. Did all tests complete successfully?
  3. Did the build install properly?
  4. Does the installed version work?
  5. Did tests succeed against the installed version?

Blazing a New Trail

At this point we're free to apply any further criteria we deem necessary. Some starting points that could prove useful:

  • Does the patch do what it claims?
  • Is the functionality accurately described?
  • Can you think of any edge cases it should handle? Test those.
  • Is there anything in the documentation that could be clarified?
  • If applicable, were there any performance regressions?

Really, the sky is the limit. Just remember that sunlight is the best disinfectant. You're not just proving contributing isn't as hard as it looks, your efforts can directly make Postgres better by proving a patch is worthy of inclusion. You, yes you, have the power to reveal bad behavior before it becomes a bug we have to fix later.

Take as much time as you need, and be as meticulous as you feel necessary. Just share your observations before too long, or existing reviewers or constraints of the commitfest itself may beat you to the punch.

Sharing the Wisdom

Remember that original email thread that the patch summary page referenced? Once a patch has been put through its paces, it's time to tell everyone what you did, how it went, and how many thumbs (in which directions) the patch deserves.

Did it completely destroy everything, corrupt all data you inserted, and also make vague threats against your pets? Make a note about all of that. Did it perform as expected, and also clean your gutters before the spring rainfalls? We want to know that too. You were the one performing the tests, and did all the hard work to decide what you wanted to verify or augment. Don't keep it to yourself!

With that said, there really is no formal review procedure. There appears to be a loosely advocated format, but really all that's necessary is to convey your experiences without omitting anything critical. My own initial effort was probably unduly ostentatious, but hey, I'm still learning. It's OK to be a bit awkward until experience digs a more comfortable rut.

We want to hear from you! We crave your input! Be a part of the Postgres team.

You know you want to.

Umair Shahid: Postgres is the coolest database – Reason #1: Developers love it!

$
0
0

PostgreSQL has been my livelihood since 2004 – so I am naturally biased in its favor. I think it is the coolest piece of software on the planet, and I am not alone.

DB-Engines

PostgreSQL DBMS of the year 2018PostgreSQL DBMS of the year 2017

See those 2 badges up there? That’s 2 years in a row. DB-Engines monitors a total of 343 databases and their trends. For each of 2017 and 2018, DB-Engines states that PostgreSQL gained more popularity in their rankings than any other database – hence the award.

This is no small feat. DB-Engines has a complex methodology of calculating popularity including search engine queries, technical discussions on popular forums, related job offers, and social media trends. Coming out on top 2 years in a row shows how much technologists love Postgres.

Stack Overflow

You Google for the solution of a problem you are facing. Chances are the first hit you are going to get will be a link from Stack Overflow. Millions of registered users interact hundreds of thousands of times every day answering questions, sharing knowledge, and making technology so much more easy to use for fellow enthusiasts.

Stack Overflow runs a survey each year asking the developer community about their favorite technologies. Want to guess what I am driving at?

Stackoverflow Most Loved Database PostgreSQL

That’s the result of over 100,000 technology enthusiasts from across the world coming together and loving PostgreSQL.

Hacker News

Hacker news – run by Y Combinator, one of the top USA accelerators since 2005 – is another forum that brings together technology enthusiasts from all around the world.

Hacker News PostgreSQL Trends

Do I really need to label the blue line? ;-)

The graph above posts trends over the past 8 years and compares popularity between MySQL, SQL Server, MongoDB, and our rising star – PostgreSQL. And just look at how it is rising!

Postgres is definitely the coolest database out there, and this is only reason #1 :-)

Stay tuned for more!

Andrew Dunstan: Buildfarm RSS feed

$
0
0

If you’ve visited almost any web page on the PostgreSQL Build Farm server in the last few days you might have noticed that it is sporting a new RSS feed, of changes in status. This is similar to the information on the buildfarm-status-green-chgs mailing list, except that it has all status changes, not just to and from green. This new feature fulfills a long outstanding request.

Robins Tharakan: Another look at Replica Lag :)

$
0
0
The other day, I remembered an old 9.0-era mail thread (when Streaming Replication had just launched) where someone had tried to daisy-chain Postgres Replicas and see how many (s)he could muster.

If I recall correctly, the OP could squeeze only ~120 or so, mostly because the Laptop memory gave way (and not really because of an engine limitation).

I couldn't find that post, but it was intriguing to know if we could reach (at least) a thousand mark and see what kind of "Replica Lag" would that entail; thus NReplicas.

On a (very) unscientific test, my 4-Core 16G machine can spin-up a 1000 Replicas in ~8m (and tear them down in another ~2m). Now am sure this could get better, but am not complaining since this was a breeze to setup (in that it just worked without much tinkering ... besides lowering shared_buffers).

For those interested, a single UPDATE on the master, could (nearly consistently) be seen on the last Replica in less than half a second, with top showing 65% CPU idle (and 3.5 on the 1-min CPU metric) during a ~15 minute test.

So although (I hope) this isn't a real-world use-case, I still am impressed that without much tweaking, we're way under the 1 second mark, and that's right out of the box.

Am sure there's more to squeeze here, but still felt this was worthy of a small post nonetheless!

Pavel Stehule: new release of plpgsql_check - possibility to check SQL injection issue

$
0
0
Yesterday I released next version of plpgsql_check.

With this release a developer can check some well known patterns of SQL injection vulnerabilities. The code of stored procedures of native languages like PL/SQL, T-SQL or PL/pgSQL is secure, and there is not a risk of SQL injection until dynamic SQL is used (the EXECUTE command in PL/pgSQL). The safe programming requires sanitization of all string variables. Anybody can use functions: quote_literal, quote_ident or format. This check can be slow, so it should be enabled by setting security_warnings parameter:

CREATE OR REPLACE FUNCTION public.foo1(a text)
RETURNS text
LANGUAGE plpgsql
AS $function$
DECLARE result text;
BEGIN
-- secure
EXECUTE 'SELECT $1' INTO result USING a;
-- secure
EXECUTE 'SELECT ' || quote_literal(a) INTO result;
-- secure
EXECUTE format('SELECT %L', a) INTO result;
-- unsecure
EXECUTE 'SELECT ''' || a || '''' INTO result;
-- unsecure
EXECUTE format(e'SELECT \'%s\'', a) INTO result;
RETURN result;
END;
$function$

postgres=# select * from plpgsql_check_function('foo1');
┌────────────────────────┐
│ plpgsql_check_function │
╞════════════════════════╡
└────────────────────────┘
(0 rows)

postgres=# select * from plpgsql_check_function('foo1', security_warnings => true);
┌─────────────────────────────────────────────────────────────────────────────┐
│ plpgsql_check_function │
╞═════════════════════════════════════════════════════════════════════════════╡
│ security:00000:11:EXECUTE:text type variable is not sanitized │
│ Query: SELECT 'SELECT ''' || a || '''' │
│ -- ^ │
│ Detail: The EXECUTE expression is SQL injection vulnerable. │
│ Hint: Use quote_ident, quote_literal or format function to secure variable. │
│ security:00000:13:EXECUTE:text type variable is not sanitized │
│ Query: SELECT format(e'SELECT \'%s\'', a) │
│ -- ^ │
│ Detail: The EXECUTE expression is SQL injection vulnerable. │
│ Hint: Use quote_ident, quote_literal or format function to secure variable. │
└─────────────────────────────────────────────────────────────────────────────┘
(10 rows)

Ernst-Georg Schmid: The Hare and the Hedgehog. Muscle, brain - or both?

$
0
0
In the famous fairy tale the hedgehog wins the race against the hare because he uses his brain to outwit the much faster hare: Brain beats muscle. But is that always the case? And what if we combine the two virtues?

The case at hand: Screening large sets of molecules for chemical simliarity.

Since (sub)graph isomorphism searching faces some mathematical challenges because of nonpolynomial O - even if you can use a specialized index, like pgchem::tigress does - fast similarity searching based on binary fingerprints has gained popularity in recent years.

I was tasked with evaluating a solution to the problem of similarity screening large sets of molecules with PostgreSQL where the fingerprints are generated externally, e.g. with the CDK.

This is, what I came up with...

Preparing the Racetrack


CREATE TABLE cdk.externalfp (
id int4 NOT NULL,
smiles varchar NOT NULL,
pubchemfp varbit NULL,
"cardinality" int4 NULL,
CONSTRAINT externalfp_pk PRIMARY KEY (id)
);

Above is the table definition of the final table. The cardinality column will be not used now, but since it is calculated by the fingerprint generator anyway, keeping it will save some work later. If you want to copy my example code 1:1, please use a database named chemistry and a schema named cdk.

First we need to load some data into the table. I used the free NCISMA99 dataset  from the National Cancer Institute, containing 249081 chemical structures in SMILES notation.

COPY cdk.externalfp (id, smiles) FROM '/tmp/NCISMA99' 
WITH (DELIMITER ' ', HEADER false, FORMAT csv);

And a few seconds later you should have 249081 rows in the table. Now we need to generate the fingerprints. The generator code is here, additionally you need the CDK 2.2 and a PostgreSQL JDBC driver. After changing the code to reflect your JDBC URL you are good to go.

Running the FingerprintGenerator should show no errors and takes about 30 Minutes on my Core i5 Linux Notebook. The fingerprint used is the PubChem fingerprint as described here.
Now we can put an index on the cardinality column (also used later) and are all set.

CREATE INDEX externalfp_cardinality_idx ON cdk.externalfp USING btree (cardinality);

Almost...

The function to calculate the similarity measure is still missing. We use the Tanimoto coefficient, as it is widely used and fairly easy to understand. The Tanimoto coefficient over PostgreSQL BIT VARYING can thus be written in pure SQL as:

CREATE OR REPLACE FUNCTION cdk.tanimoto(bit varying, bit varying)
 RETURNS real
 LANGUAGE sql
 IMMUTABLE STRICT SECURITY INVOKER LEAKPROOF
AS $function$
select length(replace(($1 & $2)::text, '0', ''))::real / length(replace(($1 | $2)::text, '0', ''))::real;
$function$;

Please note that the required bitcount function on BIT VARYING is emulated by removing all 0s and measuring the length of the remaining string, containing all 1s.


The Baseline. No brain, no muscles


For the first naive test, we run FindBySimilarity with the following inputs:

SMILES: CC(=O)OC1=CC=CC=C1C(=O)O
Threshold: 0.9
top N: 10

which gives the following plan from EXPLAIN ANALYZE:

Limit  (cost=14515.22..14516.38 rows=10 width=77) (actual time=6436.022..6436.621 rows=10 loops=1)                                         
  ->  Gather Merge  (cost=14515.22..22587.95 rows=69190 width=77) (actual time=6436.021..6436.618 rows=10 loops=1)                         
        Workers Planned: 2                                                                                                                 
        Workers Launched: 2                                                                                                                
        ->  Sort  (cost=13515.19..13601.68 rows=34595 width=77) (actual time=6432.534..6432.535 rows=8 loops=3)                            
              Sort Key: (((length(replace((('1100000001110000001110000000000000000000000000000000000000000000000000000000000000000000000000
              Sort Method: top-N heapsort  Memory: 27kB                                                                                    
              Worker 0:  Sort Method: quicksort  Memory: 27kB                                                                              
              Worker 1:  Sort Method: top-N heapsort  Memory: 27kB                                                                         
              ->  Parallel Seq Scan on externalfp  (cost=0.00..12767.61 rows=34595 width=77) (actual time=41.329..6432.411 rows=30 loops=3)
                    Filter: (((length(replace((('110000000111000000111000000000000000000000000000000000000000000000000000000000000000000000
                    Rows Removed by Filter: 82997                                                                                          
Planning Time: 0.169 ms                                                                                                                    
Execution Time: 6436.648 ms                                                                                                                                                                                                                                                                                                                           
Including retrieval, this plan leads to an overall response time of about 14 seconds.


First race. Introducing the Hedgehog


An index could be helpful, but can we build one without major programming effort? Yes, due to the work of S. Joshua Swamidass and Pierre Baldi. In their 2007 paper"Bounds and Algorithms for Fast Exact Searches of Chemical Fingerprints in Linear and Sub-Linear Time", they found ways to calculate upper and lower bounds on the cardinality of fingerprints necessary to meet a given similarity once the cardinality of the search fingerprint is known.

The paper covers these calculations for various similarity measures. For Tanimoto it is:

min_cardinality_of_target = floor(cardinality_of_search_argument * similarity_threshold)

and 

max_cardinality_of_target = ceil(cardinality_of_search_argument / similarity_threshold)

The function swamidassBaldiLimitsForTanimoto() in FindBySimilarity calculates those bounds and if you change:

//int[] lohi = swamidassBaldiLimitsForTanimoto(fp.cardinality(), threshold);
int[] lohi = {0, Integer.MAX_VALUE};

to

int[] lohi = swamidassBaldiLimitsForTanimoto(fp.cardinality(), threshold);
//int[] lohi = {0, Integer.MAX_VALUE};

they will be used. Now the index we already put on the "cardinality" column makes sense, allowing the database to filter out impossible candidates before invoking the tanimoto function.

For CC(=O)OC1=CC=CC=C1C(=O)O, the fingerprint has a cardinality of 115, which gives an upper bound of 128 and a lower bound of 103 bits. All fingerprints with cardinalities outside that bounds can be safely ignored since they cannot yield a Tanimoto coefficient >= 0.9.

Now the plan becomes:

Limit  (cost=10445.68..10446.85 rows=10 width=77) (actual time=1492.430..1495.552 rows=10 loops=1)                                                           
  ->  Gather Merge  (cost=10445.68..12328.11 rows=16134 width=77) (actual time=1492.429..1495.548 rows=10 loops=1)                                           
        Workers Planned: 2                                                                                       
        Workers Launched: 2                                                                                                                                  
        ->  Sort  (cost=9445.66..9465.82 rows=8067 width=77) (actual time=1489.566..1489.567 rows=7 loops=3)                                                 
              Sort Key: (((length(replace((('1100000001110000001110000000000000000000000000000000000000000000000000000000000000000000000000000000000000000000
              Sort Method: top-N heapsort  Memory: 27kB                                                                                                      
              Worker 0:  Sort Method: top-N heapsort  Memory: 27kB                                                                                           
              Worker 1:  Sort Method: top-N heapsort  Memory: 27kB                                                                                           
              ->  Parallel Bitmap Heap Scan on externalfp  (cost=826.09..9271.33 rows=8067 width=77) (actual time=22.032..1489.502 rows=30 loops=3)          
                    Recheck Cond: ((cardinality >= 103) AND (cardinality <= 128))                                                                            
                    Filter: (((length(replace((('110000000111000000111000000000000000000000000000000000000000000000000000000000000000000000000000000000000000
                    Rows Removed by Filter: 19303                                                                                                            
                    Heap Blocks: exact=1928                                                                                                                  
                    ->  Bitmap Index Scan on externalfp_cardinality_idx  (cost=0.00..821.25 rows=58083 width=0) (actual time=5.238..5.238 rows=58000 loops=1)
                          Index Cond: ((cardinality >= 103) AND (cardinality <= 128))                                                                        
Planning Time: 0.166 ms                                                                                                                                      
Execution Time: 1495.587 ms                                                                                                                                                             

Including retrieval, this plan gives us now an overall response time of about 3 seconds, or 4.6 times faster.

Second race. Introducing the Hare


Time to pull out the big guns. The tanimoto calculation in SQL is apparently slow, primarily because PostgreSQL is lacking a native bit count function for BIT VARYING, so this must be emulated using binary string replace() and length().

However, we can build one in C. Since counting bits is a simple operation for a microprocessor (Actually, it is an art in itself. See Andrew Dalke's popcount benchmark for many different ways to count bits.), a C function should perform much better.

After you installed tanimoto.c, changed the tanimoto function calls in the SQL in FindBySimilarity to tanimoto_c, and disabled the Swamidass/Baldi indexing, we see the raw power of a native function.

The plan now becomes:

Limit  (cost=10363.85..10365.02 rows=10 width=77) (actual time=45.829..48.101 rows=10 loops=1)                                         
  ->  Gather Merge  (cost=10363.85..18436.58 rows=69190 width=77) (actual time=45.827..48.097 rows=10 loops=1)                         
        Workers Planned: 2                                                                                                             
        Workers Launched: 2                                                                                                            
        ->  Sort  (cost=9363.83..9450.32 rows=34595 width=77) (actual time=43.667..43.668 rows=8 loops=3)                              
              Sort Key: (tanimoto_c('11000000011100000011100000000000000000000000000000000000000000000000000000000000000000000000000000
              Sort Method: top-N heapsort  Memory: 27kB                                                                                
              Worker 0:  Sort Method: top-N heapsort  Memory: 27kB                                                                     
              Worker 1:  Sort Method: top-N heapsort  Memory: 27kB                                                                     
              ->  Parallel Seq Scan on externalfp  (cost=0.00..8616.24 rows=34595 width=77) (actual time=0.095..43.559 rows=30 loops=3)
                    Filter: (tanimoto_c('1100000001110000001110000000000000000000000000000000000000000000000000000000000000000000000000
                    Rows Removed by Filter: 82997                                                                                      
Planning Time: 0.062 ms                                                                                                                
Execution Time: 48.145 ms     


Overall response is 0.128 seconds, or 110 times faster.

Muscle beats brain. At least here.


Third race. Relay


But if we enable the Swamidass/Baldi index again and keep the native Tanimoto function, the real magic happens.

The final plan:


Limit  (cost=9427.54..9427.56 rows=10 width=77) (actual time=35.567..35.570 rows=10 loops=1)                                                           
  ->  Sort  (cost=9427.54..9475.94 rows=19361 width=77) (actual time=35.566..35.566 rows=10 loops=1)                                                   
        Sort Key: (tanimoto_c('110000000111000000111000000000000000000000000000000000000000000000000000000000000000000000000000000000000000000000000000
        Sort Method: top-N heapsort  Memory: 26kB                                                                                                      
        ->  Bitmap Heap Scan on externalfp  (cost=826.09..9009.15 rows=19361 width=77) (actual time=5.404..35.459 rows=90 loops=1)                     
              Recheck Cond: ((cardinality >= 103) AND (cardinality <= 128))                                                                            
              Filter: (tanimoto_c('11000000011100000011100000000000000000000000000000000000000000000000000000000000000000000000000000000000000000000000
              Rows Removed by Filter: 57910                                                                                                            
              Heap Blocks: exact=6801                                                                                                                  
              ->  Bitmap Index Scan on externalfp_cardinality_idx  (cost=0.00..821.25 rows=58083 width=0) (actual time=4.307..4.307 rows=58000 loops=1)
                    Index Cond: ((cardinality >= 103) AND (cardinality <= 128))                                                                        
Planning Time: 0.149 ms                                                                                                                                
Execution Time: 35.641 ms                                                                                                                                                                                                                                          
                                                                                                       
Final overall response now 0.04 seconds, or 350 times faster!

Muscle + brain: unmatched.

Conclusion

Sometimes the Hare wins, sometimes the Hedgehog does. Always attack nontrivial optimization problems from different angles and experiment, experiment, experiment.

While C largely outperforms the index in this case, it's still good to know both, because using native functions is not always possible, e.g. on an AWS RDS instance. Then, 4.6x faster is better than nothing.

PostgreSQL needs a native builtin function for counting bits in BIT VARYING. Since fingerprint screening can be used not only for chemical structures, but for virtually every complex data that can be broken down into binary features, this would be ever so useful.

Shaun M. Thomas: PG Phriday: Around the World in Two Billion Transactions

$
0
0

Transaction IDs (XID) have been something of a thorn in Postgres’ side since the dawn of time. On one hand, they’re necessary to differentiate tuple visibility between past, present, and concurrent transactions. On the other hand, the counter that stores it is only 32-bits, meaning it’s possible to eventually overflow without some kind of intervention. […]

The post PG Phriday: Around the World in Two Billion Transactions appeared first on 2ndQuadrant | PostgreSQL.


Raghavendra Rao: Fixing up a corrupted TOAST table

$
0
0
Today, when taking a logical backup(pg dump) of a database cluster table (PG 9.4), we saw a toast table error. [crayon-5cbd43c67da7c367733810/] Above error shows the toast table corruption. To fix this, we don’t need any special software, all we have to do is follow the instructions repeatedly suggested by Postgres-community folks on the community channel....

Michael Paquier: Postgres 12 highlight - REINDEX CONCURRENTLY

$
0
0

A lot of work has been put into making Postgres 12 an excellent release to come, and in some of the features introduced, there is one which found its way into the tree and has been first proposed to community at the end of 2012. Here is the commit which has introduced it:

commit: 5dc92b844e680c54a7ecd68de0ba53c949c3d605
author: Peter Eisentraut <peter@eisentraut.org>
date: Fri, 29 Mar 2019 08:25:20 +0100
REINDEX CONCURRENTLY

This adds the CONCURRENTLY option to the REINDEX command.  A REINDEX
CONCURRENTLY on a specific index creates a new index (like CREATE
INDEX CONCURRENTLY), then renames the old index away and the new index
in place and adjusts the dependencies, and then drops the old
index (like DROP INDEX CONCURRENTLY).  The REINDEX command also has
the capability to run its other variants (TABLE, DATABASE) with the
CONCURRENTLY option (but not SYSTEM).

The reindexdb command gets the --concurrently option.

Author: Michael Paquier, Andreas Karlsson, Peter Eisentraut
Reviewed-by: Andres Freund, Fujii Masao, Jim Nasby, Sergei Kornilov
Discussion: https://www.postgresql.org/message-id/flat/60052986-956b-4478-45ed-8bd119e9b9cf%402ndquadrant.com#74948a1044c56c5e817a5050f554ddee

As pointed out by the documentation, REINDEX needs to take an exclusive lock on the relation which is indexed, meaning that for the whole duration of the operation, no queries can be run on it and will wait for the REINDEX to finish. Sometimes REINDEX can become very handy in the event of an index corruption, or when in need to rebuild the index because of extra bloat on it. So the longer the operation takes, the longer a production instance is not available, and that’s bad for any deployments so maintenance windows become mandatory. There is a community tool called pg_reorg, which happens to be used by an organization called Instagram aimed at reducing the impact of a REINDEX at the cost of extra resources by using a trigger-based method to replay tuple changes while an index is rebuilt in parallel of the existing one. Later this tool has been renamed to pg_repack.

REINDEX CONCURRENTLY is aimed at solving the same problems as the previous tools mentioned by doing a REINDEX with a low-level lock (while being cheaper than these tools!), meaning that read and write queries can happen while an index is rebuilt, but the operation is longer, requires a couple of transactions, and costs extra resources in the shape of more table scans. Here is how an index is rebuilt in a concurrent fashion:

  • Create a new index in the catalogs which is a copycat of the one reindexed (with some exceptions, for example partition indexes don’t have their inheritance dependency registered at creation, but at swap time). This new, temporary is suffixed with “_ccnew”. Bref.
  • Build the new index. This may take time, and there may be a lot of activity happening in parallel.
  • Let the new index catch up with the activity done during the build.
  • Rename the new index with the old index name, and switch (mostly!) all the dependencies of the old index to the new one. The old index becomes invalid, and the new one valid. This is called the swap phase.
  • Mark the old index as dead.
  • Drop the old index.

Each one of these steps needs one transaction. When reindexing a table, all the indexes to work on are gathered at once and each step is run through all the indexes one-at-a-time. One could roughly think of these as a mix of CREATE INDEX CONCURRENTLY followed by DROP INDEX in a single transaction, except that the constraint handling is automatic, and that there is an extra step in the middle to make the switch from the old to the new index fully transparent.

First things first. I would like to point out that this patch would have never found its way into the code tree without Andreas Karlsson, who has sent a rebased version of my original patch at the beginning of 2017, for a project I have been mainly working on from 2012 to 2014 with a couple of independent pieces committed, giving up after losing motivation as there was good vibes for getting that feature introduced in Postgres, but then life moved on. My original patch did a swap of the relfilenodes which required an exclusive lock for a short amount of time, but that was not really good as we want the concurrent reindex not allow read and write queries in parallel of the rebuild at any moment. Andreas has reworked that part so as the new index gets renamed with the old index name, and all the dependencies from the old to the new index are switched at the same time to make the switch from the old to the new index transparent. Then Peter Eisentraut has accepted to commit the patch. So this feature owes a lot to those two folks. Since the feature has been first proposed, it has happened that I have become myself a committer of Postgres so I have been stepping up to fix issues related to this feature and adjusting it for the upcoming release.

Note that if the REINDEX fails or is interrupted in the middle, then all the indexes rebuilt are most likely in an invalid state, meaning that they still consume space and that their definition is around, but they are not used at all by the backend. REINDEX CONCURRENTLY is designed so as it is possible to drop invalid indexes. There is a bit more about invalid indexes to be aware about. Here is first an invalid index:

=# CREATE TABLE tab (a int);
CREATE TABLE
=# INSERT INTO tab VALUES (1),(1),(2);
INSERT 0 3
=# CREATE UNIQUE INDEX CONCURRENTLY tab_index on tab (a);
ERROR:  23505: could not create unique index "tab_index"
DETAIL:  Key (a)=(1) is duplicated.
SCHEMA NAME:  public
TABLE NAME:  tab
CONSTRAINT NAME:  tab_index
LOCATION:  comparetup_index_btree, tuplesort.c:4056
=# \d tab
Table "public.tab"
 Column |  Type   | Collation | Nullable | Default
--------+---------+-----------+----------+---------
 a      | integer |           |          |
Indexes:
    "tab_index" UNIQUE, btree (a) INVALID

Then, REINDEX TABLE CONCURRENTLY will skip invalid indexes because in the event of successive and multiple failures then the number of indexes would just ramp up, doubling at each run, causing a lot of bloat on the follow-up reindex operations:

=# REINDEX TABLE CONCURRENTLY tab;
WARNING:  0A000: cannot reindex concurrently invalid index "public.tab_index", skipping
LOCATION:  ReindexRelationConcurrently, indexcmds.c:2708
NOTICE:  00000: table "tab" has no indexes
LOCATION:  ReindexTable, indexcmds.c:2394
REINDEX

It is however possible to reindex invalid indexes with just REINDEX INDEX CONCURRENTLY:

=# DELETE FROM tab WHERE a = 1; DELETE 2 =# REINDEX INDEX CONCURRENTLY tab_index; REINDEX

Another thing to note is that CONCURRENTLY is not supported for catalog tables as locks tend to be released before committing in catalogs so the operation is unsafe, and indexes for exclusion constraints cannot be processed. Toast indexes are handled though.

Hubert 'depesz' Lubaczewski: Waiting for PostgreSQL 12 – Support foreign keys that reference partitioned tables

$
0
0
On 3rd of April 2019, Alvaro Herrera committed patch: Support foreign keys that reference partitioned tables     Previously, while primary keys could be made on partitioned tables, it was not possible to define foreign keys that reference those primary keys. Now it is possible to do that.   Author: Álvaro Herrera   Discussion: https://postgr.es/m/20181102234158.735b3fevta63msbj@alvherre.pgsql … Continue reading "Waiting for PostgreSQL 12 – Support foreign keys that reference partitioned tables"

Viorel Tabara: Benchmarking Managed PostgreSQL Cloud Solutions - Part Three: Google Cloud

$
0
0

In this 3rd part of Benchmarking Managed PostgreSQL Cloud Solutions, I took advantage of Google’s GCP free tier offering. It has been a worthwhile experience and as a sysadmin spending most of his time at the console I couldn’t miss the opportunity of trying out cloud shell, one of the console features that sets Google apart from the cloud provider I’m more familiar with, Amazon Web Services.

To quickly recap, in Part 1 I looked at the available benchmark tools and explained why I chose AWS Benchmark Procedure for Aurora. I also benchmarked Amazon Aurora for PostgreSQL version 10.6. In Part 2 I reviewed AWS RDS for PostgreSQL version 11.1.

During this round, the tests based on the AWS Benchmark Procedure for Aurora will be run against Google Cloud SQL for PostgreSQL 9.6 since the version 11.1 is still in beta.

Cloud Instances

Prerequisites

As mentioned in the previous two articles, I opted for leaving PostgreSQL settings at their cloud GUC defaults, unless they prevent tests from running (see further down below). Recall from previous articles that the assumption has been that out of the box the cloud provider should have the database instance configured in order to provide a reasonable performance.

The AWS pgbench timing patch for PostgreSQL 9.6.5 applied cleanly to Google Cloud version of PostgreSQL 9.6.10.

Using the information Google put out in their blog Google Cloud for AWS Professionals I matched up the specs for the client and the target instances with respect to the Compute, Storage, and Networking components. For example, Google Cloud equivalent of AWS Enhanced Networking is achieved by sizing the compute node based on the formula:

max( [vCPUs x 2Gbps/vCPU], 16Gbps)

When it comes to setting up the target database instance, similarly to AWS, Google Cloud allows no replicas, however, the storage is encrypted at rest and there is no option to disable it.

Finally, in order to achieve the best network performance, the client and the target instances must be located in the same availability zone.

Client

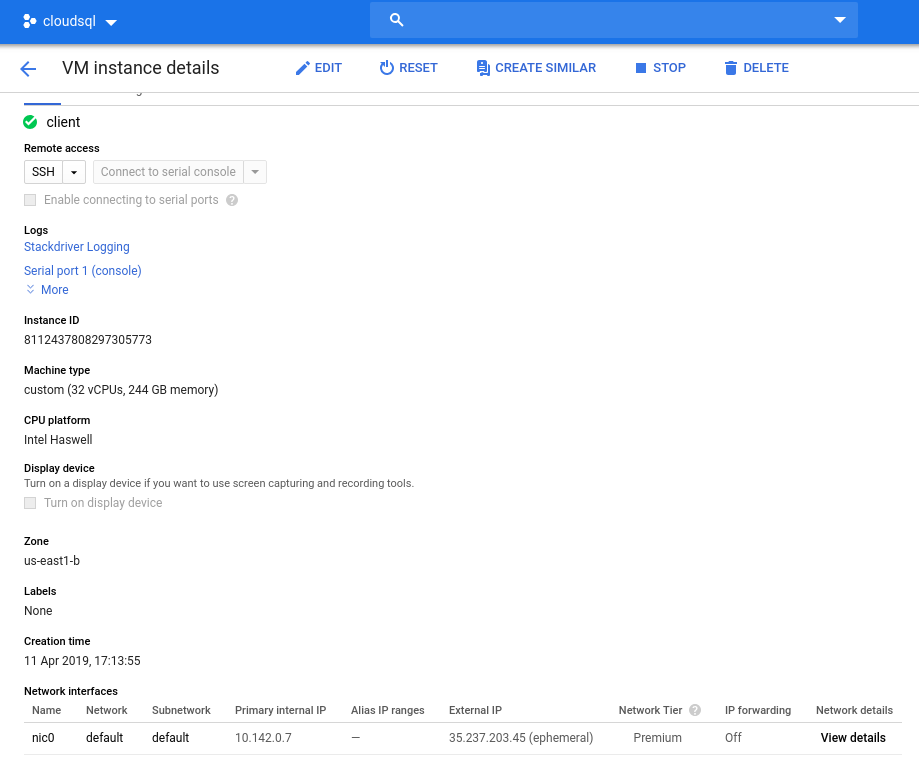
The client instance specs matching the closest the AWS instance, are:

  • vCPU: 32 (16 Cores x 2 Threads/Core)
  • RAM: 208 GiB (maximum for the 32 vCPU instance)
  • Storage: Compute Engine persistent disk
  • Network: 16 Gbps (max of [32 vCPUs x 2 Gbps/vCPU] and 16 Gbps)

Instance details after initialization:

Client instance: Compute and Network

Note: Instances are by default limited to 24 vCPUs. Google Technical Support must approve the quota increase to 32 vCPUs per instance.

While such requests are usually handled within 2 business days, I have to give Google Support Services a thumbs up for completing my request in only 2 hours.

For the curious, the network speed formula is based on the compute engine documentation referenced in this GCP blog.

DB Cluster

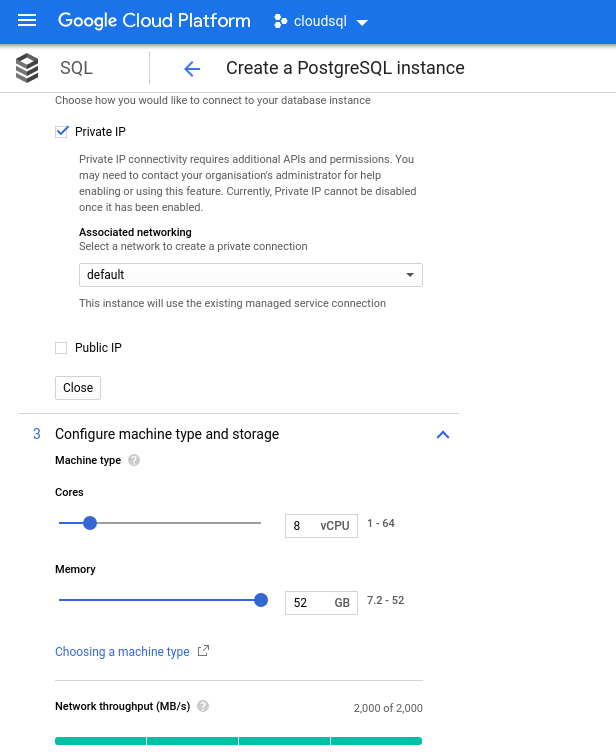
Below are the database instance specs:

  • vCPU: 8
  • RAM: 52 GiB (maximum)
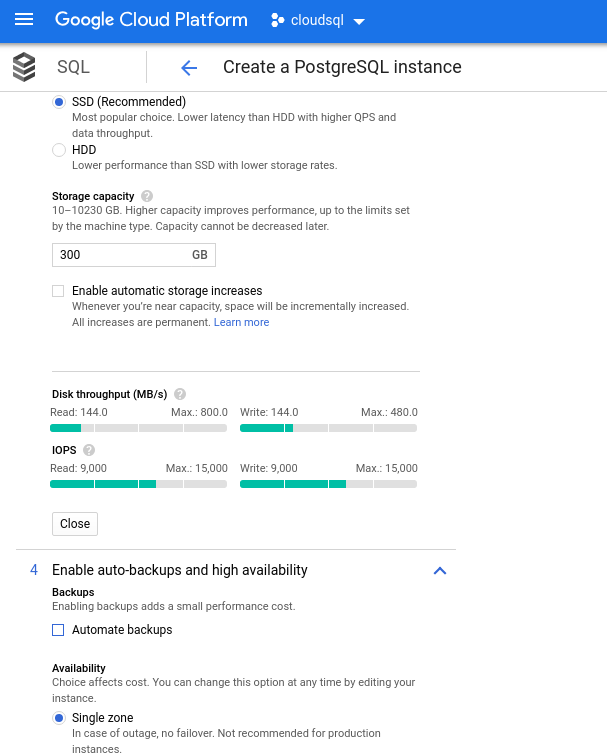
  • Storage: 144 MB/s, 9,000 IOPS
  • Network: 2,000 MB/s

Note that the maximum available memory for an 8 vCPU instance is 52 GiB. More memory can be allocated by selecting a larger instance (more vCPUs):

Database CPU and Memory sizing

While Google SQL can automatically expand the underlying storage, which by the way is a really cool feature, I chose to disable the option in order to be consistent with the AWS feature set, and avoid a potential I/O impact during the resize operation. (“potential”, because it should have no negative impact at all, however in my experience resizing any type of underlying storage increases the I/O, even if for a few seconds).

Recall that the AWS database instance was backed up by an optimized EBS storage which provided a maximum of:

  • 1,700 Mbps bandwidth
  • 212.5 MB/s throughput
  • 12,000 IOPS

With Google Cloud we achieve a similar configuration by adjusting the number of vCPUs (see above) and storage capacity:

Databse storage configuration and backup settings

Running the Benchmarks

Setup

Next, install the benchmark tools, pgbench and sysbench by following the instructions in the Amazon guide adapted to PostgreSQL version 9.6.10.

Initialize the PostgreSQL environment variables in .bashrc and set the paths to PostgreSQL binaries and libraries:

export PGHOST=10.101.208.7
export PGUSER=postgres
export PGPASSWORD=postgres
export PGDATABASE=postgres
export PGPORT=5432
export PATH=$PATH:/usr/local/pgsql/bin
export LD_LIBRARY_PATH=$LD_LIBRARY_PATH:/usr/local/pgsql/lib

Preflight checklist:

[root@client ~]# psql --version
psql (PostgreSQL) 9.6.10
[root@client ~]# pgbench --version
pgbench (PostgreSQL) 9.6.10
[root@client ~]# sysbench --version
sysbench 0.5
postgres=> select version();
                                                 version
---------------------------------------------------------------------------------------------------------
 PostgreSQL 9.6.10 on x86_64-pc-linux-gnu, compiled by gcc (Ubuntu 4.8.4-2ubuntu1~14.04.3) 4.8.4, 64-bit
(1 row)

And we are ready for takeoff:

pgbench

Initialize the pgbench database.

[root@client ~]# pgbench -i --fillfactor=90 --scale=10000

…and several minutes later:

NOTICE:  table "pgbench_history" does not exist, skipping
NOTICE:  table "pgbench_tellers" does not exist, skipping
NOTICE:  table "pgbench_accounts" does not exist, skipping
NOTICE:  table "pgbench_branches" does not exist, skipping
creating tables...
100000 of 1000000000 tuples (0%) done (elapsed 0.09 s, remaining 872.42 s)
200000 of 1000000000 tuples (0%) done (elapsed 0.19 s, remaining 955.00 s)
300000 of 1000000000 tuples (0%) done (elapsed 0.33 s, remaining 1105.08 s)
400000 of 1000000000 tuples (0%) done (elapsed 0.53 s, remaining 1317.56 s)
500000 of 1000000000 tuples (0%) done (elapsed 0.63 s, remaining 1258.72 s)

...

500000000 of 1000000000 tuples (50%) done (elapsed 943.93 s, remaining 943.93 s)
500100000 of 1000000000 tuples (50%) done (elapsed 944.08 s, remaining 943.71 s)
500200000 of 1000000000 tuples (50%) done (elapsed 944.22 s, remaining 943.46 s)
500300000 of 1000000000 tuples (50%) done (elapsed 944.33 s, remaining 943.20 s)
500400000 of 1000000000 tuples (50%) done (elapsed 944.47 s, remaining 942.96 s)
500500000 of 1000000000 tuples (50%) done (elapsed 944.59 s, remaining 942.70 s)
500600000 of 1000000000 tuples (50%) done (elapsed 944.73 s, remaining 942.47 s)

...

999600000 of 1000000000 tuples (99%) done (elapsed 1878.28 s, remaining 0.75 s)
999700000 of 1000000000 tuples (99%) done (elapsed 1878.41 s, remaining 0.56 s)
999800000 of 1000000000 tuples (99%) done (elapsed 1878.58 s, remaining 0.38 s)
999900000 of 1000000000 tuples (99%) done (elapsed 1878.70 s, remaining 0.19 s)
1000000000 of 1000000000 tuples (100%) done (elapsed 1878.83 s, remaining 0.00 s)
vacuum...
set primary keys...
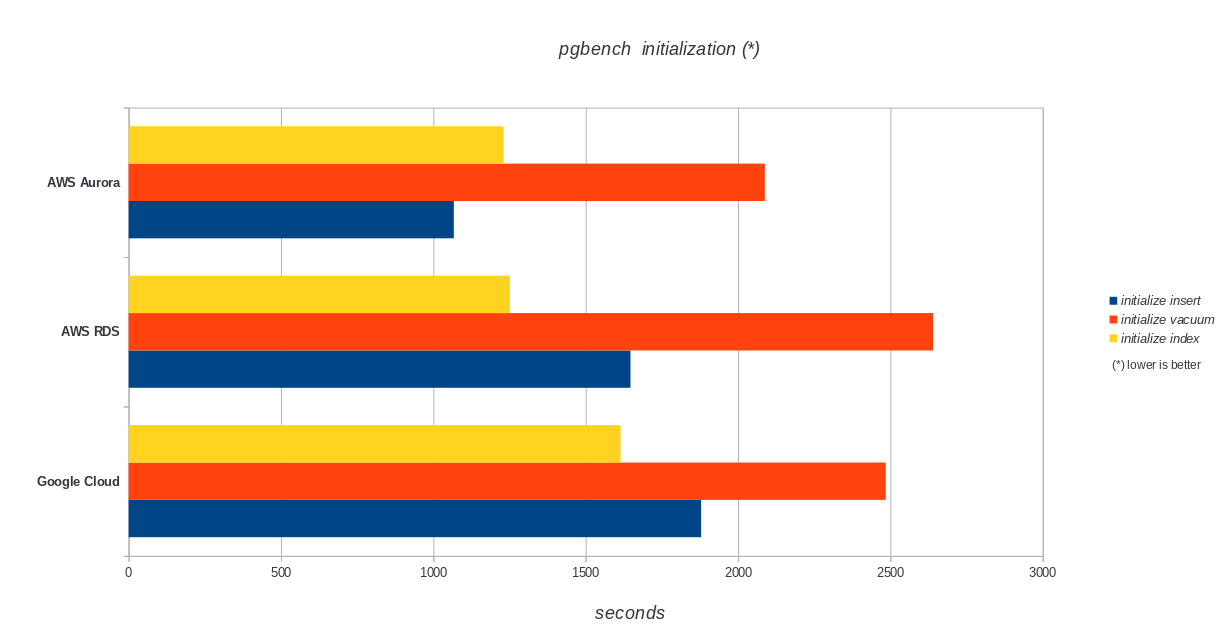
total time: 5978.44 s (insert 1878.90 s, commit 0.04 s, vacuum 2484.96 s, index 1614.54 s)
done.

As we are now used to, the database size must be 160GB. Let’s verify that:

postgres=>  SELECT
postgres->       d.datname AS Name,
postgres->       pg_catalog.pg_get_userbyid(d.datdba) AS Owner,
postgres->       pg_catalog.pg_size_pretty(pg_catalog.pg_database_size(d.datname)) AS SIZE
postgres->    FROM pg_catalog.pg_database d
postgres->    WHERE d.datname = 'postgres';
   name   |       owner       |  size
----------+-------------------+--------
postgres | cloudsqlsuperuser | 160 GB
(1 row)

With all the preparations completed start the read/write test:

[root@client ~]# pgbench --protocol=prepared -P 60 --time=600 --client=1000 --jobs=2048
starting vacuum...end.
connection to database "postgres" failed:
FATAL:  sorry, too many clients already :: proc.c:341
connection to database "postgres" failed:
FATAL:  sorry, too many clients already :: proc.c:341
connection to database "postgres" failed:
FATAL:  remaining connection slots are reserved for non-replication superuser connections

Oops! What is the maximum?

postgres=> show max_connections ;
 max_connections
-----------------
 600
(1 row)

So, while AWS sets a largely enough max_connections as I didn’t encounter that issue, Google Cloud requires a small tweak...Back to the cloud console, update the database parameter, wait a few minutes and then check:

postgres=> show max_connections ;
 max_connections
-----------------
 1005
(1 row)

Restarting the test everything appears to be working just fine:

starting vacuum...end.
progress: 60.0 s, 5461.7 tps, lat 172.821 ms stddev 251.666
progress: 120.0 s, 4444.5 tps, lat 225.162 ms stddev 365.695
progress: 180.0 s, 4338.5 tps, lat 230.484 ms stddev 373.998

...but there is another catch. I was in for a surprise when attempting to open a new psql session in order to count the number of connections:

psql: FATAL: remaining connection slots are reserved for non-replication superuser connections

Could it be that superuser_reserved_connections isn’t at its default?

postgres=> show superuser_reserved_connections ;
 superuser_reserved_connections
--------------------------------
 3
(1 row)

That is the default, then what else could it be?

postgres=> select usename from pg_stat_activity ;
   usename
---------------
cloudsqladmin
cloudsqlagent
postgres
(3 rows)

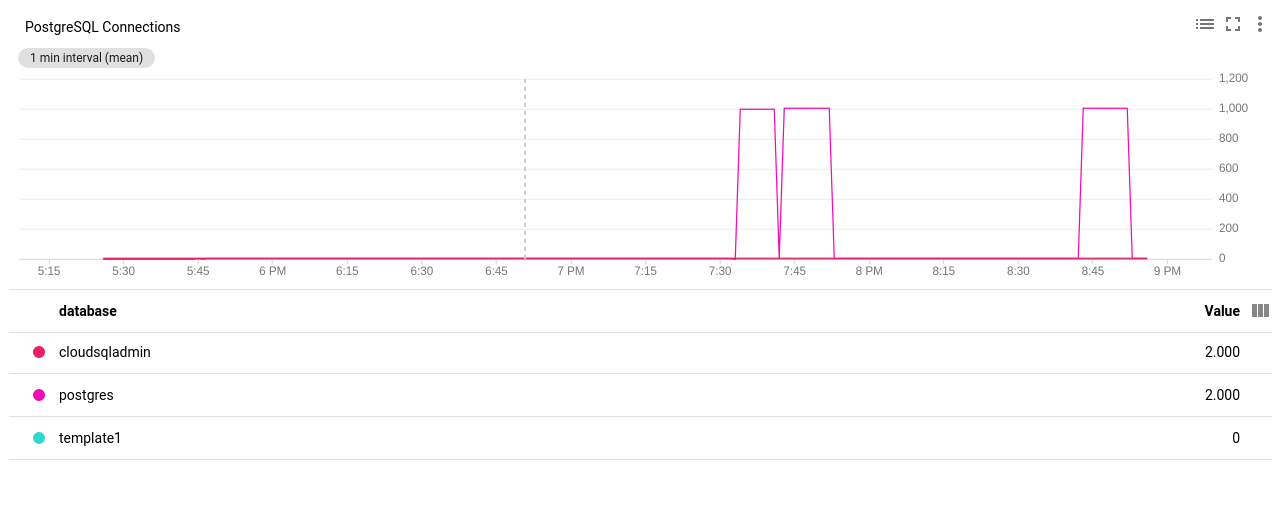
Bingo! Another bump of max_connections takes care of it, however, it required that I restart the pgbench test. And that is folks the story behind the apparent duplicate run in the graphs below.

And finally, the results are in:

progress: 60.0 s, 4553.6 tps, lat 194.696 ms stddev 250.663
progress: 120.0 s, 3646.5 tps, lat 278.793 ms stddev 434.459
progress: 180.0 s, 3130.4 tps, lat 332.936 ms stddev 711.377
progress: 240.0 s, 3998.3 tps, lat 250.136 ms stddev 319.215
progress: 300.0 s, 3305.3 tps, lat 293.250 ms stddev 549.216
progress: 360.0 s, 3547.9 tps, lat 289.526 ms stddev 454.484
progress: 420.0 s, 3770.5 tps, lat 265.977 ms stddev 470.451
progress: 480.0 s, 3050.5 tps, lat 327.917 ms stddev 643.983
progress: 540.0 s, 3591.7 tps, lat 273.906 ms stddev 482.020
progress: 600.0 s, 3350.9 tps, lat 296.303 ms stddev 566.792
transaction type: <builtin: TPC-B (sort of)>
scaling factor: 10000
query mode: prepared
number of clients: 1000
number of threads: 1000
duration: 600 s
number of transactions actually processed: 2157735
latency average = 278.149 ms
latency stddev = 503.396 ms
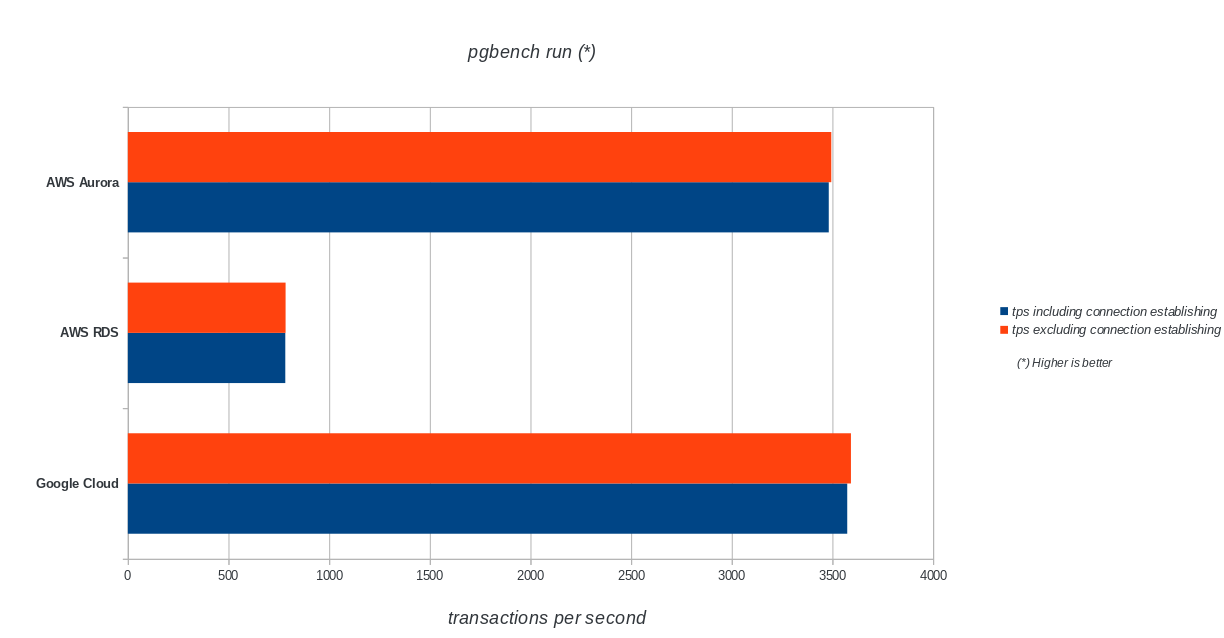
tps = 3573.331659 (including connections establishing)
tps = 3591.759513 (excluding connections establishing)

sysbench

Populate the database:

sysbench --test=/usr/local/share/sysbench/oltp.lua \
--pgsql-host=${PGHOST} \
--pgsql-db=${PGDATABASE} \
--pgsql-user=${PGUSER} \
--pgsql-password=${PGPASSWORD} \
--pgsql-port=${PGPORT} \
--oltp-tables-count=250\
--oltp-table-size=450000 \
prepare

Output:

sysbench 0.5:  multi-threaded system evaluation benchmark
Creating table 'sbtest1'...
Inserting 450000 records into 'sbtest1'
Creating secondary indexes on 'sbtest1'...
Creating table 'sbtest2'...
Inserting 450000 records into 'sbtest2'
...
Creating table 'sbtest249'...
Inserting 450000 records into 'sbtest249'
Creating secondary indexes on 'sbtest249'...
Creating table 'sbtest250'...
Inserting 450000 records into 'sbtest250'
Creating secondary indexes on 'sbtest250'...

And now run the test:

sysbench --test=/usr/local/share/sysbench/oltp.lua \
--pgsql-host=${PGHOST} \
--pgsql-db=${PGDATABASE} \
--pgsql-user=${PGUSER} \
--pgsql-password=${PGPASSWORD} \
--pgsql-port=${PGPORT} \
--oltp-tables-count=250 \
--oltp-table-size=450000 \
--max-requests=0 \
--forced-shutdown \
--report-interval=60 \
--oltp_simple_ranges=0 \
--oltp-distinct-ranges=0 \
--oltp-sum-ranges=0 \
--oltp-order-ranges=0 \
--oltp-point-selects=0 \
--rand-type=uniform \
--max-time=600 \
--num-threads=1000 \
run

And the results:

sysbench 0.5:  multi-threaded system evaluation benchmark

Running the test with following options:
Number of threads: 1000
Report intermediate results every 60 second(s)
Random number generator seed is 0 and will be ignored

Forcing shutdown in 630 seconds

Initializing worker threads...

Threads started!

[  60s] threads: 1000, tps: 1320.25, reads: 0.00, writes: 5312.62, response time: 1484.54ms (95%), errors: 0.00, reconnects:  0.00
[ 120s] threads: 1000, tps: 1486.77, reads: 0.00, writes: 5944.30, response time: 1290.87ms (95%), errors: 0.00, reconnects:  0.00
[ 180s] threads: 1000, tps: 1143.62, reads: 0.00, writes: 4585.67, response time: 1649.50ms (95%), errors: 0.02, reconnects:  0.00
[ 240s] threads: 1000, tps: 1498.23, reads: 0.00, writes: 5993.06, response time: 1269.03ms (95%), errors: 0.00, reconnects:  0.00
[ 300s] threads: 1000, tps: 1520.53, reads: 0.00, writes: 6058.57, response time: 1439.90ms (95%), errors: 0.02, reconnects:  0.00
[ 360s] threads: 1000, tps: 1234.57, reads: 0.00, writes: 4958.08, response time: 1550.39ms (95%), errors: 0.02, reconnects:  0.00
[ 420s] threads: 1000, tps: 1722.25, reads: 0.00, writes: 6890.98, response time: 1132.25ms (95%), errors: 0.00, reconnects:  0.00
[ 480s] threads: 1000, tps: 2306.25, reads: 0.00, writes: 9233.84, response time: 842.11ms (95%), errors: 0.00, reconnects:  0.00
[ 540s] threads: 1000, tps: 1432.85, reads: 0.00, writes: 5720.15, response time: 1709.83ms (95%), errors: 0.02, reconnects:  0.00
[ 600s] threads: 1000, tps: 1332.93, reads: 0.00, writes: 5347.10, response time: 1443.78ms (95%), errors: 0.02, reconnects:  0.00
OLTP test statistics:
   queries performed:
      read:                            0
      write:                           3603595
      other:                           1801795
      total:                           5405390
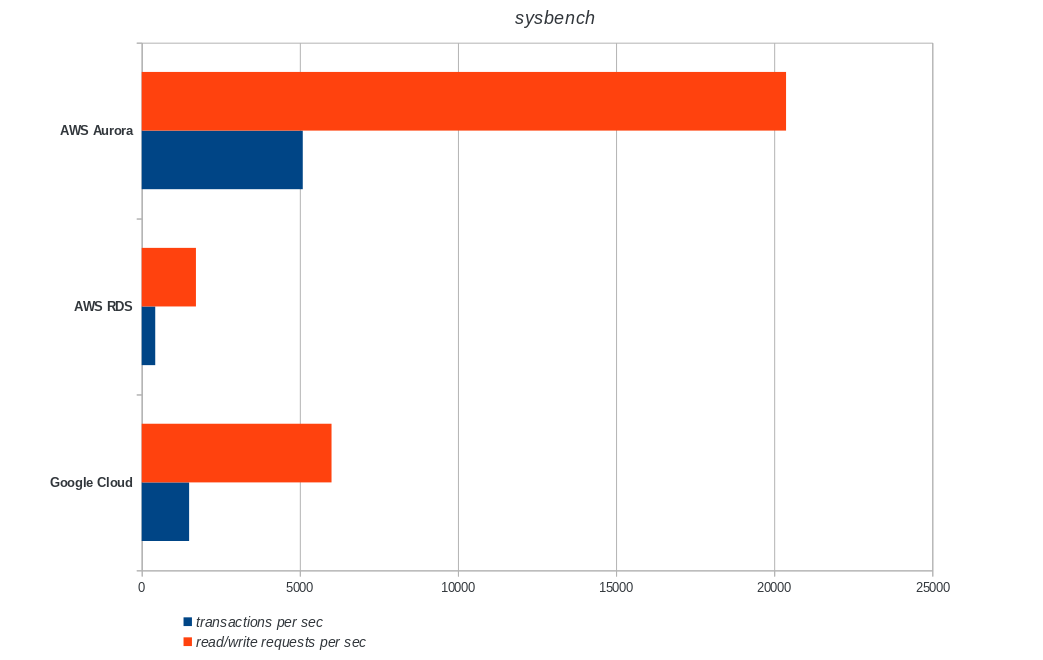
   transactions:                        900895 (1500.68 per sec.)
   read/write requests:                 3603595 (6002.76 per sec.)
   other operations:                    1801795 (3001.38 per sec.)
   ignored errors:                      5      (0.01 per sec.)
   reconnects:                          0      (0.00 per sec.)

General statistics:
   total time:                          600.3231s
   total number of events:              900895
   total time taken by event execution: 600164.2510s
   response time:
         min:                                  6.78ms
         avg:                                666.19ms
         max:                               4218.55ms
         approx.  95 percentile:            1397.02ms

Threads fairness:
   events (avg/stddev):           900.8950/14.19
   execution time (avg/stddev):   600.1643/0.10
Download the Whitepaper Today
 
PostgreSQL Management & Automation with ClusterControl
Learn about what you need to know to deploy, monitor, manage and scale PostgreSQL

Benchmark Metrics

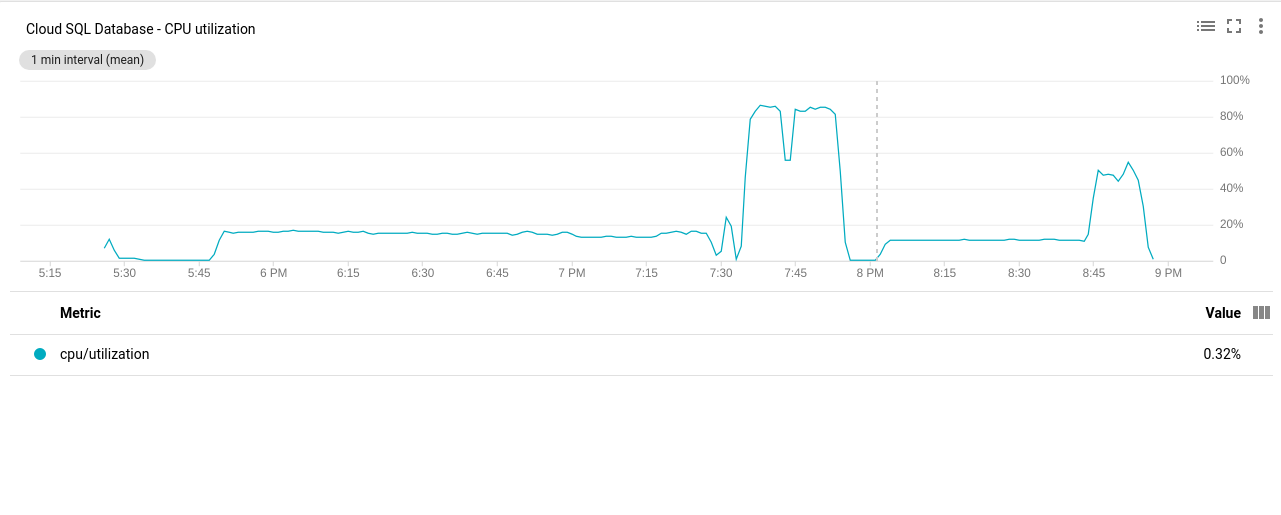
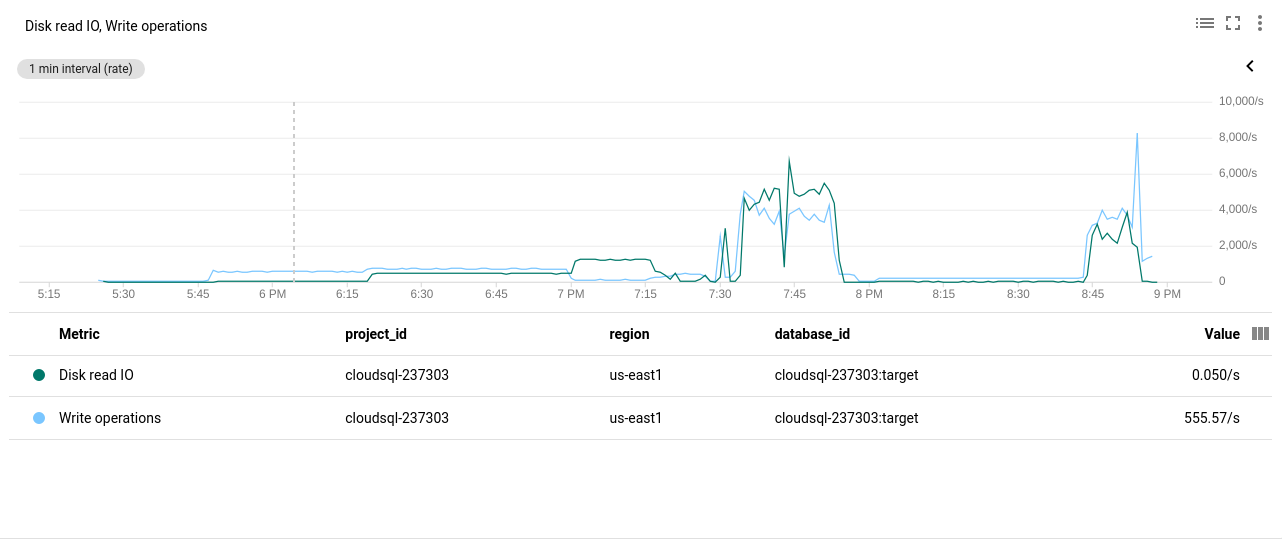
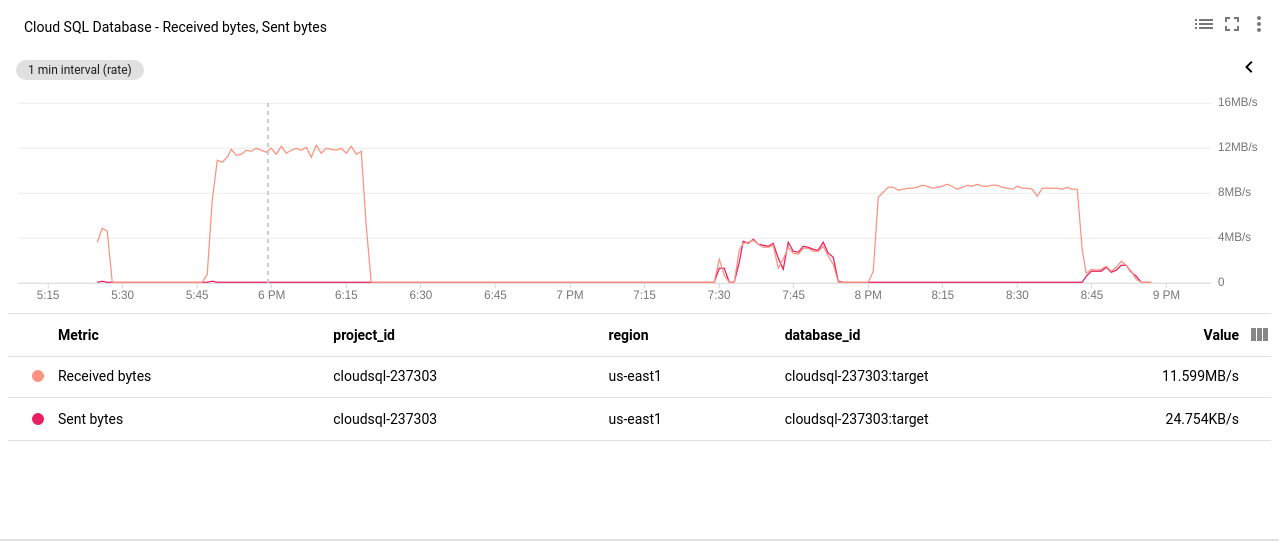
The PostgreSQL plugin for Stackdriver has been deprecated as of February 28th, 2019. While Google recommends Blue Medora, for the purpose of this article I chose to do away with creating an account and to rely on available Stackdriver metrics.

  • CPU Utilization:
    Google Cloud SQL: PostgreSQL CPU Utilization
    Photo author
    Google Cloud SQL: PostgreSQL CPU Utilization
  • Disk Read/Write operations:
    Google Cloud SQL: PostgreSQL Disk Read/Write operations
    Photo author
    Google Cloud SQL: PostgreSQL Disk Read/Write operations
  • Network Sent/Received Bytes:
    Google Cloud SQL: PostgreSQL Network Sent/Received bytes
    Photo author
    Google Cloud SQL: PostgreSQL Network Sent/Received bytes
  • PostgreSQL Connections Count:
    Google Cloud SQL: PostgreSQL Connections Count
    Photo author
    Google Cloud SQL: PostgreSQL Connections Count

Benchmark Results

pgbench Initialization

AWS Aurora, AWS RDS, Google Cloud SQL: PostgreSQL pgbench initialization results

pgbench run

AWS Aurora, AWS RDS, Google Cloud SQL: PostgreSQL pgbench run results

sysbench

AWS Aurora, AWS RDS, Google Cloud SQL: PostgreSQL sysbench results

Conclusion

Amazon Aurora comes first by far in write heavy (sysbench) tests, while being at par with Google Cloud SQL in the pgbench read/write tests. The load test (pgbench initialization) puts Google Cloud SQL in the first place, followed by Amazon RDS. Based on a cursory look at the pricing models for AWS Aurora and Google Cloud SQL, I would hazard to say that out of the box Google Cloud is a better choice for the average user, while AWS Aurora is better suited for high performance environments. More analysis will follow after completing all the benchmarks.

The next and last part of this benchmark series will be on Microsoft Azure PostgreSQL.

Thanks for reading and please comment below if you have feedback.

Andreas 'ads' Scherbaum: PGConf.EU 2019 - Call for Papers and Call for Sponsorships

$
0
0

PostgreSQL Conference Europe 2019 takes place in Milan, Italy, on October 15-18. Our Call for Papers is now open.

We are accepting proposals for talks in English. Each session will last 45 minutes, and may be on any topic related to PostgreSQL. The submission deadline is July 15th. Selected speakers will be notified before August 10th, 2019.

Please submit your proposals by going to 2019.pgconf.eu/callforpapers/ and following the instructions.

The proposals will be considered by committee who will produce a schedule to be published nearer the conference date. The members of the committee are listed on the website linked above.

All selected speakers will get free entry to the conference (excluding training sessions). We do not in general cover travel and accommodations for speakers, but may be able to do so in limited cases. If you require assistance with funding to be able to attend, please make a note of this in the submission notes field or contact us separately before the submission deadline.

And finally, our Call for Sponsorship is also open. Take your chance to present your services or products to the PostgreSQL community - or see it as a give back opportunity. All sponsorship levels also include one or more free entrance tickets, depending on the level. Please head to 2019.pgconf.eu/becomesponsor/ for more details.

Please note that the hotel room situation in Milan is tense, we advise you to book your room as early as possible. We are working with hotels around the venue to provide more options.

As usual, if you have any questions, don't hesitate to contact us at contact@pgconf.eu.

We look forward to seeing you in Milan in October!

Viewing all 9665 articles
Browse latest View live


<script src="https://jsc.adskeeper.com/r/s/rssing.com.1596347.js" async> </script>