Quantcast
Channel: Planet PostgreSQL
Viewing all 9724 articles
Browse latest View live

Peter Bengtsson: How much faster is Redis at storing a blob of JSON compared to PostgreSQL?

$
0
0

tl;dr; Redis is 16 times faster and reading these JSON blobs.*

In Song Search when you've found a song, it loads some affiliate links to Amazon.com. (In case you're curious it's earning me lower double-digit dollars per month). To avoid overloading the Amazon Affiliate Product API, after I've queried their API, I store that result in my own database along with some metadata. Then, the next time someone views that song page, it can read from my local database. With me so far?

Example view of affiliate links

The other caveat is that you can't store these lookups locally too long since prices change and/or results change. So if my own stored result is older than a couple of hundred days, I delete it and fetch from the network again. My current implementation uses PostgreSQL (via the Django ORM) to store this stuff. The model looks like this:

classAmazonAffiliateLookup(models.Model,TotalCountMixin):song=models.ForeignKey(Song,on_delete=models.CASCADE)matches=JSONField(null=True)search_index=models.CharField(max_length=100,null=True)lookup_seconds=models.FloatField(null=True)created=models.DateTimeField(auto_now_add=True,db_index=True)modified=models.DateTimeField(auto_now=True)

At the moment this database table is 3GB on disk.

Then, I thought, why not use Redis for this. Then I can use Redis's "natural" expiration by simply setting as expiry time when I store it and then I don't have to worry about cleaning up old stuff at all.

The way I'm using Redis in this project is as a/the cache backend and I have it configured like this:

CACHES={"default":{"BACKEND":"django_redis.cache.RedisCache","LOCATION":REDIS_URL,"TIMEOUT":config("CACHE_TIMEOUT",500),"KEY_PREFIX":config("CACHE_KEY_PREFIX",""),"OPTIONS":{"COMPRESSOR":"django_redis.compressors.zlib.ZlibCompressor","SERIALIZER":"django_redis.serializers.msgpack.MSGPackSerializer",},}}

The speed difference

Perhaps unrealistic but I'm doing all this testing here on my MacBook Pro. The connection to Postgres (version 11.4) and Redis (3.2.1) are both on localhost.

Reads

The reads are the most important because hopefully, they happen 10x more than writes as several people can benefit from previous saves.

I changed my code so that it would do a read from both databases and if it was found in both, write down their time in a log file which I'll later summarize. Results are as follows:

PG:
median: 8.66ms
mean  : 11.18ms
stdev : 19.48ms

Redis:
median: 0.53ms
mean  : 0.84ms
stdev : 2.26ms

(310 measurements)

It means, when focussing on the median, Redis is 16 times faster than PostgreSQL at reading these JSON blobs.

Writes

The writes are less important but due to the synchronous nature of my Django, the unlucky user who triggers a look up that I didn't have, will have to wait for the write before the XHR request can be completed. However, when this happens, the remote network call to the Amazon Product API is bound to be much slower. Results are as follows:

PG:
median: 8.59ms
mean  : 8.58ms
stdev : 6.78ms

Redis:
median: 0.44ms
mean  : 0.49ms
stdev : 0.27ms

(137 measurements)

It means, when focussing on the median, Redis is 20 times faster than PostgreSQL at writing these JSON blobs.

Conclusion and discussion

First of all, I'm still a PostgreSQL fan-boy and have no intention of ceasing that. These times are made up of much more than just the individual databases. For example, the PostgreSQL speeds depend on the Django ORM code that makes the SQL and sends the query and then turns it into the model instance. I don't know what the proportions are between that and the actual bytes-from-PG's-disk times. But I'm not sure I care either. The tooling around the database is inevitable mostly and it's what matters to users.

Both Redis and PostgreSQL are persistent and survive server restarts and crashes etc. And you get so many more "batch related" features with PostgreSQL if you need them, such as being able to get a list of the last 10 rows added for some post-processing batch job.

I'm currently using Django's cache framework, with Redis as its backend, and it's a cache framework. It's not meant to be a persistent database. I like the idea that if I really have to I can just flush the cache and although detrimental to performance (temporarily) it shouldn't be a disaster. So I think what I'll do is store these JSON blobs in both databases. Yes, it means roughly 6GB of SSD storage but it also potentially means loading a LOT more into RAM on my limited server. That extra RAM usage pretty much sums of this whole blog post; of course it's faster if you can rely on RAM instead of disk. Now I just need to figure out how RAM I can afford myself for this piece and whether it's worth it.


Shawn Wang: Key Management

$
0
0

Key management consists of four parts: key generation, key preservation, key exchange, and key rotation.

Key Generation

Only for the study of symmetric encryption, so I mainly introduce symmetric encryption.
The symmetric password generation method is:

  • A random number is a key
  • Password-based key generation
  • HKDF (HMAC-based extraction and extended key derivation)

A random number is a key

Random number as a key: Using a powerful random number generator to generate the key, this is easy to understand.

Password-based key generation

Password-based key generation: A method of generating a key based on a user password and using it for encryption and decryption. The specific method is as follows:

  1. A user enters a password;
  2. The system generates a random number, performs a hash calculation with the user password, and obtains a key encryption key;
  3. Store the key encryption key to a secure location;
  4. The system generates a random number as a data encryption key;
  5. The key encryption key encrypts the data key and the encrypted data key is also stored in a secure place;
  6. Use data encryption keys to encrypt and decrypt data.

HKDF


The Key Derivation Function (KDF) is an essential part of the cryptosystem. Its goal is to obtain some initial key material and derive one or more keys that are very strong in security.

  1. Extracting, using strong random numbers and input information, using the HMAC method for hashing;
  2. Extend, through multiple hash calculations, extend the above results to the length we need.

Key Preservation

The generation of keys, whether random or password-based, is partially difficult to remember, so it is necessary to store the key (maybe it is a salt).
The key cannot be stored in the same location as the data, otherwise, it is equal to the key hanging on the door, meaning nothing.
We generally need to store the key in a file and put it in a secure storage location such as a secure key distribution center.
When the number of keys reached a certain amount, we needed another key — KEK (Key encryption key).
This is because if the data key is not encrypted, the stealer can easily decrypt the data using the key after stealing. Also, managing multiple keys is much more difficult than a single key.
So you can consider a way to use KEK to save keys, of course, KEK also needs to be stored in a secure location.

Key Exchange

There are currently four types of key exchanges: pre-shared keys, public-key ciphers, key distribution centers, and Diffie-Hellman key exchange methods.
Here’s a quick description of the four methods:

Pre-shared Keys

The two sides exchange keys by secure means before encryption, but in the database, the two sides are in the same area as the server and the disk, that is, the key and the disk are insecure, so the database does not consider this way.

Public-key Ciphers

Since we use symmetric encryption system here, we do not consider the public key. But this can be used as part of key exchange.

Key Distribution Center

Store the key to a trusted third party and through it to obtain the key. When a key is needed, communication is made to a third party, a session key is generated, and the session key is used to encrypt the key to transmit the key.

Diffie-Hellman key exchange

Diffie-Hellman was an algorithm invented in 1976 by Whitfield Diffie and Martin Hellman. The algorithm generate shared secret numbers by exchanging information that can be disclosed, so as to achieve the purpose of sharing keys. The process is as follows:

  1. The DB server sends two prime numbers P, G to the Key server (hereinafter referred to as D and K);
  2. D generates a random number A;
  3. K generates a random number B;
  4. D sends G^A mod P to K;
  5. K sends G^B mod P to D;
  6. D uses the number B’ sent by K to calculate B’ mod P, which is the data encryption key;
  7. K uses the number A’ sent by D to calculate A’ mod P, which is equal to the encryption key calculated by D;

Of course, when you add it to the database, you also need to use a secure third party as the information exchange, but this reduces the possibility of the key being eavesdropped.

Key Rotation

The key rotation is divided into two parts: key update and invalidation.
Key update can improve the difficulty of key brute force cracking. Secondly, even if the past key is cracked, the current data cannot be obtained.
The key invalidated. After the update, the key should be invalidated in time. The invalidation here refers not only to the deletion but also make the key can not be able to restore the key.

Shawn Wang

Shawn Wang is a developer of PostgreSQL Database Core. He has been working in HighGo Software for about eight years.
He did some work for Full Database encryption,  Oracle Compatible function, Monitor tool for PostgreSQL, Just in time for PostgreSQL and so on.

Now he has joined the HighGo community team and hopes to make more contributions to the community in the future.

Shawn Wang: The Transparent data encryption in PostgreSQL

$
0
0

I have been working with the PostgreSQL community recently to develop TDE (Transparent Data Encryption). During this time, I studied some cryptography-related knowledge and used it to combine with the database. I will introduce the TDE in PostgreSQL by the following three dimensions.

  1. The current threat model of the database
  2. Encryption policy description and current design status of the current PostgreSQL community
  3. Future data security

What is TDE?

Transparent Data Encryption (often abbreviated to TDEis a technology employed by MicrosoftIBM and Oracle to encrypt database filesTDE offers encryption at file levelTDE solves the problem of protecting data at restencrypting databases both on the hard drive and consequently on backup media.

–Transparent_Data_Encryption

When it comes to cryptography-related topics, we must first understand what security threats are facing.

Security Threat Modes

  1. Inappropriate permissions
    Many applications or software are often used to give unnecessary privileges to users because of the convenience of use. Secondly, if users are not cleaned up in time (for example, resigned employees), information leakage will also occur.
    Most applications don’t impose too many restrictions on DBAs and developers, which also carries the risk of data loss.
    Authority-giving strategies, separation of powers, or database auditing are all important ways to prevent such threats.
  2. SQL injection attack
    SQL injection attacks have always been one of the major risks facing databases. With the development of B/S mode application development, more and more programmers use this mode to write applications. However, due to the level of programmers and experience, a considerable number of programmers do not judge the legitimacy of user input data when writing code, which makes the application security risk. The user can submit a database query code and obtain some data he wants to know based on the results returned by the program.
    Reasonable software architecture design and legal SQL auditing are effective ways to prevent such threats.
  3. Attack on purpose
    An attacker can affect the database through network eavesdropping, Trojan attack, etc., resulting in data loss risks. Many vendors often fail to enable network transmission encryption due to performance or resources, which causes data eavesdropping risks.
    Secondly, a malicious attacker can infect a legitimate user device through measures such as a Trojan virus, thereby stealing data and causing data loss.
    Improve security measures, such as turning on the firewall, enabling network transmission encryption, etc. Secondly, strengthening database auditing can be used to combat such threats.
  4. Weak audit trail
    Due to resource consumption and performance degradation, many vendors turn off or turn on less-functional audit trails, which can lead to malicious administrators hacking data.
    Secondly, because the restricted operation after auditing is more difficult to implement, for example, it is difficult to distinguish between operation of DBAs and trespassing, which makes it difficult to defend against attacks after auditing.
    Network equipment auditing is currently the most effective auditing program.
  5. Unsafe storage medium
    The storage medium stores the risk of stealing, and secondly, the backup storage security setting is lower, which causes data loss.
    Enhance the protection of physical media, encrypt user data, and enforce security settings for all data stores to protect against such threats.
  6. Unsafe third party
    With the advent of the cloud era and 5G, more vendors are storing data in the cloud. This actually has third-party trust issues. If a third party has a malicious administrator, illegally stealing or reading sensitive data, or providing a server with a security risk, this will result in data loss.
    By selecting a trusted third party and encrypting user data, you can avoid unsafe third-party threats.
  7. Database vulnerability or incorrect configuration
    With the increase of the functions of modern database software, complex programs are likely to have security vulnerabilities, and many manufacturers are reluctant to upgrade the version in order to ensure the stability of the system. The same data faces a large risk of leakage.
    Second, there are also high risks associated with inadequate security settings. The security configuration here does not only refer to the database level but also needs to strengthen the security configuration at the operating system level.
    Regularly fix database vulnerabilities and enhance security configuration.
  8. Limited security expertise and education
    According to statistics, about 30% of data breaches are caused by human error, so safety education needs to be strengthened.
    Regular safety knowledge lectures to raise awareness of safety precautions.

In summary, the current data encryption can deal with threats with insecure storage media, insecure third parties.
And we know that the database not only needs security considerations, but also needs to balance performance, stability, and ease of use.
So how do you design data encryption?

Encryption Level

First, let’s review the overall architecture of PostgreSQL:

Through the overall architecture, we can divide the encryption into 6 levels.
As can be seen from the above figure, the client and the server interact, and the user data is received by the server from the client, written to the server cache, and then flushed into the disk.
The physical structure of PostgreSQL storage is: cluster –> table space –> database –> relationship object.
From this we can divide the database into six levels for encryption, client-side encryption, server-side encryption, cluster-level encryption, table-space-level encryption, database-level encryption, and table-level or object-level encryption.
The following six levels are explained separately:

  1. Client -level encryption, which generates a key by the user and encrypts the segment;
    1. Advantages: It can defend DBA and developers to a certain extent; the encryption granularity is small, and the amount of encrypted data is controllable. The existing encryption plug-in pgcrypto can be used for client data encryption.
    2. Disadvantages: The use cost is high, the existing application system needs to be adjusted, and the data insertion statement is modified; secondly, since the encryption is started from the data generation, it is equal to the cache level encryption, the performance is poor, and the index cannot be used.
  2. The server encrypts, establishes an encryption type, and encrypts the segment;
    1. Advantages: The use cost is relative to the encrypted copy of the client, only need to adjust the database, no need to modify the application, the encryption granularity is small, and the amount of encrypted data is controllable.
    2. Disadvantages, the same is cache-level encryption, poor performance, the index can not be used.
  3. Cluster-level encryption, encrypting the entire cluster, and determining whether the cluster is encrypted during initialization;
    1. Advantages: simple architecture, low cost of use, operating system cache level encryption (data cache brushing, encryption, and decryption when reading disk), performance is relatively better;
    2. Disadvantages, the encryption is fine-grained, and all cluster internal objects are encrypted, which will cause performance degradation.
  4. Tablespace-level encryption, setting encryption attributes for a certain table space, all encrypted inside the encrypted tablespace;
    1. Advantages: simple architecture, low cost of use, operating system cache level encryption, relatively better performance, reduced fine-grained encryption, better control of the amount of encrypted data, and favorable data encryption efficiency;
    2. Disadvantages: The concept of the tablespace in PostgreSQL is not clear enough, users are easily misunderstood, and secondly, the cost of use in backup management is higher.
  5. Database-level encryption, specifying a library as an encryption library, and all objects in the encryption library are replaced with encryption;
    1. Advantages: simple architecture, low cost of use, operating system cache level encryption, reduced fine-grained encryption, high data encryption efficiency;
    2. Disadvantages: The encryption fine-grained is relatively broken.
  6. Table-level encryption or file-level encryption, specifying an object to be encrypted;
    1. Advantages: simple architecture, low cost of use, operating system cache level encryption, lower and lower encryption granularity, and high data encryption efficiency;
    2. Disadvantages: The key management cost is reduced and the development complexity is higher. Secondly, when the object to be encrypted is vertical, the use cost is high.

The following explains why the cache level encryption cannot be indexed:
The purpose of indexing is to improve the efficiency of data construction, and the reason for encryption is to protect sensitive data.

  • Then if we encrypt at the cache level, if we build an index, we need to divide it into two cases, based on plain text indexing or indexing based on the ciphertext.
  • Based on the plaintext index, the plaintext needs to be decrypted, the index is built, and the index is encrypted. However, if the number of encryption and decryption is too high, the performance will be degraded, and the order of the index itself will cause certain information leakage.
  • Based on the ciphertext document index, the index cannot effectively sort the data, and it is difficult to continuously decelerate continuously.
  • If you do not encrypt the index, it will gradually affect the data security.
  • Of course, if you do not use the index after encryption, it will have no effect.

The above-mentioned cache level and file system level encryption are next seen from the storage architecture:

As can be seen from the above figure, we can be divided into three levels, database cache level, operating system cache level, and file system level:

Database cache level encryption: Levels 1 and 2 above are encrypted when data is written to the cache, cache level encryption, and decryption during data retrieval, with the worst performance;
Operating system cache level: Levels 3, 4, 5, and 6 are all encrypted in PostgreSQL data flashing, decrypted when data is loaded, and performance is relatively good; File system level: The database itself cannot be implemented, and file system encryption is required.

File system level: The database itself cannot be implemented, and file system encryption is required.

So how to choose for the database?
Although encryption is a good means of data security protection, how to join the database requires a holistic consideration.
When we strengthen the database, we need to consider

  • Development costs;
  • safety;
  • performance;
  • Ease of use.

After many discussions in the community, cluster-level encryption has been chosen as the first solution for TDE.

We all know that commonly used encryption currently has three types: streaming encryption, packet encryption, and public-key encryption.
When using encryption algorithms, you should pay attention to:

  • The encryption method consists of two parts, a key, and an encryption algorithm. Usually, we recommend the use of internationally public, certified encryption algorithms.
  • The protection of the key is equivalent to the protection of the plaintext.

So how to encrypt it will be divided into two parts: the choice of an encryption algorithm and the management of the key.

Encryption algorithm selection

First, analyze the three encryption methods:

  1. The feature of streaming-encryption is that the key length is consistent with the length of the plaintext data, which is difficult to implement in the database, so it is not considered here.
  2. The biggest advantage of public-key encryption is that it is divided into public and private keys. The public key can be publicized, which reduces the problem of key management, but its encryption performance is too poor. The packet encryption algorithm is hundreds of public-key encryption. Double, so I don’t think about it here.
  3. Block cipher is the current mainstream encryption algorithm with the best performance and the widest application.

The current internationally recognized block cipher algorithm is AES.
Let’s briefly introduce AES.
The packet encryption algorithm first needs to be grouped. The AES encryption length is 128 bits, which is 16 bytes.
Has 3 key lengths, 128, 192 and 256.
AES has 5 encryption modes:

ECB mode: electronic codebook mode
CBC mode: cipher block link mode
CFB mode: password feedback mode
OFB mode: output feedback mode
CTR mode: counter mode

If you want to get the detail of this five-mode you can see: The difference in five modes in the AES encryption algorithm and The performance test on the AES modes.

After discussion, we chose the CTR mode as the TDE encryption algorithm mode.

Key Management

Key management consists of four parts: key generation, key preservation, key exchange, and key rotation.

If you want to get the detail of Key management you can see: Key Management.

I recommend to the community that password-based key generation, using KEK storage keys, Diffie-Hellman key exchange scheme.

After several rounds of discussions in the current community, there are currently two schemes of Layer 2 key management and Layer 3 key management.

2 tier Key Management

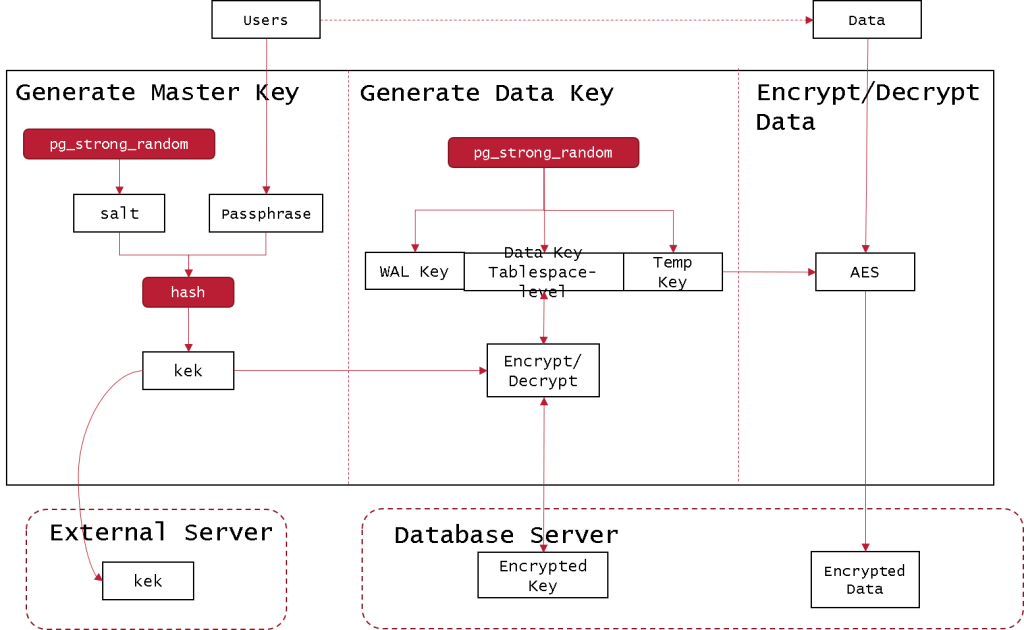
2 tier key management uses a combination of password-based key generation, KEK storage key, and key distribution center. The architecture is as follows:

  1. A user enters a password;
  2. The system generates a random number, performs a hash calculation with the user password, and obtains a key encryption key;
  3. Store the key encryption key to a secure location;
  4. The system generates a random number as a data encryption key;
  5. The key encryption key encrypts the data key and the encrypted data key is also stored in a database server;
  6. Use data encryption keys to encrypt and decrypt data.

3 tier key management

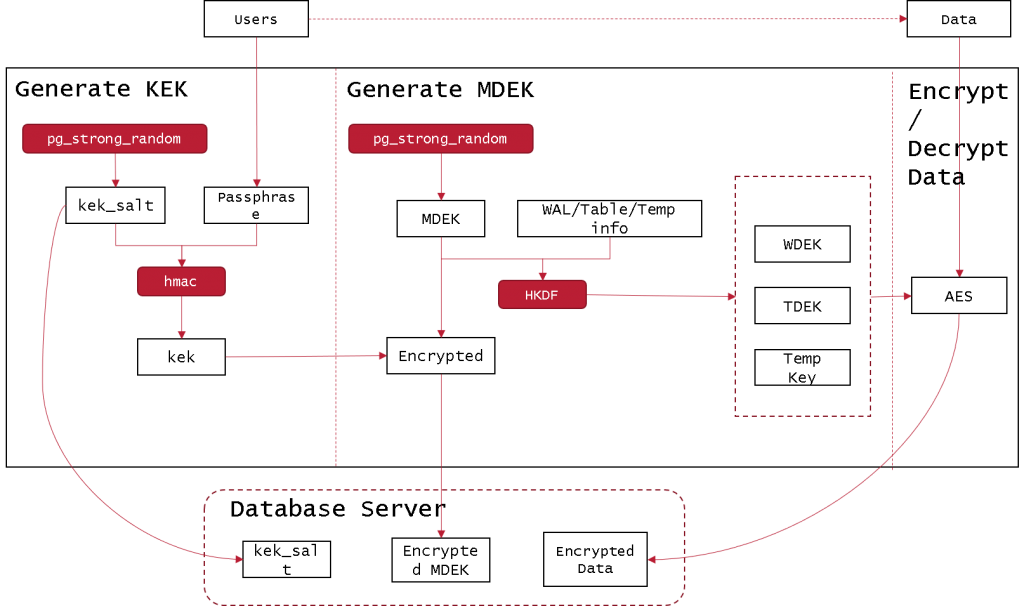
3 tier key management uses a combination of the password-based key generation, HKDF, the use of KEK storage key and the use of the key distribution center 4, the architecture is as follows:

  1. The user enters a password;
  2. The system generates a random number, performs a hash calculation with the user password, and obtains a key encryption key;
  3. Store the random number to a safe place;
  4. The system generates a random number as MDEK (master data encryption key) and stores it in a secure place;
  5. Use MDEK and encrypted file information to get the data encryption key;
  6. Encrypt and decrypt the data using a data encryption key.

At present, there is still some controversy about key management. I personally agree with the second method to prepare for the finer granularity of later encryption.

Future data security

Now with the advent of 5G, the advent of the cloud era, I think the future of IT architecture, more are cloud-based design. More data is stored in the cloud, so if cloud vendors steal and analyze user data, it will seriously violate our privacy.
The malicious DBAs and developers who were also mentioned in the threat model often have higher database permissions. Even if they don’t have permission, if they have the method of reading the cache, the data will also be leaked.
So how do we protect our data?

Homomorphic encryption

Homomorphic encryption is a form of encryption that allows computations to be carried out on ciphertextthus generating an encrypted result whichwhen decryptedmatches the result of operations performed on the plaintext.

Homomorphic_encryption

Homomorphic Encryption is an Open Problem that was proposed by the cryptography community a long time ago. As early as 1978, Ron Rivest, Leonard Adleman, and Michael L. Dertouzos proposed this concept in the context of banking.

The general encryption scheme focuses on data storage security. That is, I have to send someone an encrypted thing, or to save something on a computer or other server, I have to encrypt the data and then send or store it. A user without a key cannot obtain any information about the original data from the encrypted result. Only the user who owns the key can decrypt it correctly and get the original content. We have noticed that in this process, the user cannot perform any operations on the encryption result, and can only store and transmit. Any action on the result of the encryption will result in incorrect decryption and even decryption. The most interesting aspect of the homomorphic encryption scheme is that it focuses on data processing security. Homomorphic encryption provides a means of processing encrypted data. That is, others can process the encrypted data, but the process does not reveal any original content. At the same time, after the user who owns the key decrypts the processed data, it is exactly the result of the processing.

If you don’t understand its concept very well, then we can look at the following picture:

DBAs and developers or malicious cloud administrators are like operators (attackers) who must handle the gold in a locked box (encryption algorithm) with no gloves. They don’t the key(data key) can’t open the box, so they can’t steal gold (data).

How-to-use Homomorphic Encryption?

Alice’s processing data with Homomorphic Encryption (hereafter referred to as HE) using Cloud is roughly like this:

  1. Alice encrypts the data. And send the encrypted data to the Cloud;
  2. Alice submits data processing methods to Cloud, which is represented by function f;
  3. Cloud processes the data under function f and sends the processed result to Alice;
  4. Alice decrypts the data and gets the result.

So why are there no large-scale applications yet? According to the IBM team’s research, until 2016, the technology still has performance bottlenecks, and the huge performance overhead is extremely helpless.
The inventor of homomorphic encryption, Craig Gentry, led a team of IBM researchers to conduct a series of homomorphic encryption attempts. In the beginning, the data processing speed of plaintext operation was “100 trillion times faster” than the homomorphic encryption. Later, it was executed on a 16-core server, and the speed was increased by 2 million times, but it was still much slower than the plaintext operation. As a result, IBM continues to improve HElib, and its latest release on GitHub re-implements a homomorphic linear transformation with dramatic performance improvements that are 15-75 times faster. In a paper by the International Cryptography Research Association, Shai Halevi of the IBM Cryptographic Research Team and Victor Shoup, a professor at the Coulometric Institute of Mathematics at New York University, also worked on IBM Zurich research experiments. Room describes the method of speed improvement.

Therefore, the performance of current homomorphic encryption cannot meet normal needs. If it is commercialized to the database level, I think it needs further research by cryptographers. Please look forward to it.

In the End

All of the above methods are software-scale operations. Currently, there are many hardware solutions for data encryption, like FPGA card encryption/decryption to improve its performance; and Intel’s Trusted Execution Environment Technology (TEE, Trusted Execution Environment) Trusted computing and so on.
Encryption is only a small part of database security. More content requires everyone’s joint efforts and hopes to see more people in the database security field in the future.

Reference

  1. http://raghavt.blogspot.ca/2011/04/postgresql-90-architecture.html
  2. Computer Security — NIST
  3. RFC 5869 – HMAC-based Extrac-and-Expand Key Derivation Function.pdf
  4. https://www.zhihu.com/question/27645858/answer/37598506
  5. https://zhuanlan.zhihu.com/p/82191749
  6. https://www.postgresql.org/message-id/flat/CAD21AoAB5%2BF0RAb5gHNV74CXrBYfQrvTPGx86MrEfVM%3Dx4iPbQ%40mail.gmail.com#321a08844300a49c89590cbf12ccb12a
  7. https://wiki.postgresql.org/wiki/Transparent_Data_Encryption
  8. https://www.slideshare.net/masahikosawada98/transparent-data-encryption-in-postgresql

Shawn Wang

Shawn Wang is a developer of PostgreSQL Database Core. He has been working in HighGo Software for about eight years.
He did some work for Full Database encryption,  Oracle Compatible function, Monitor tool for PostgreSQL, Just in time for PostgreSQL and so on.

Now he has joined the HighGo community team and hopes to make more contributions to the community in the future.

Peter Bengtsson: Update to speed comparison for Redis vs PostgreSQL storing blobs of JSON

$
0
0

Last week, I blogged about "How much faster is Redis at storing a blob of JSON compared to PostgreSQL?". Judging from a lot of comments, people misinterpreted this. (By the way, Redis is persistent). It's no surprise that Redis is faster.

However, it's a fact that I have do have a lot of blobs stored and need to present them via the web API as fast as possible. It's rare that I want to do relational or batch operations on the data. But Redis isn't a slam dunk for simple retrieval because I don't know if I trust its integrity with the 3GB worth of data that I both don't want to lose and don't want to load all into RAM.

But is it entirely wrong to look at WHICH database to get the best speed?

Reviewing this corner of Song Search helped me rethink this. PostgreSQL is, in my view, a better database for storing stuff. Redis is faster for individual lookups. But you know what's even faster? Nginx

Nginx??

The way the application works is that a React web app is requesting the Amazon product data for the sake of presenting an appropriate affiliate link. This is done by the browser essentially doing:

constresponse=awaitfetch('https://songsear.ch/api/song/5246889/amazon');

Internally, in the app, what it does is that it looks this up, by ID, on the AmazonAffiliateLookup ORM model. Suppose it wasn't there in the PostgreSQL, it uses the Amazon Affiliate Product Details API, to look it up and when the results come in it stores a copy of this in PostgreSQL so we can re-use this URL without hitting rate limits on the Product Details API. Lastly, in a piece of Django view code, it carefully scrubs and repackages this result so that only the fields used by the React rendering code is shipped between the server and the browser. That "scrubbed" piece of data is actually much smaller. Partly because it limits the results to the first/best match and it deletes a bunch of things that are never needed such as ProductTypeName, Studio, TrackSequence etc. The proportion is roughly 23x. I.e. of the 3GB of JSON blobs stored in PostgreSQL only 130MB is ever transported from the server to the users.

Again, Nginx?

Nginx has a built in reverse HTTP proxy cache which is easy to set up but a bit hard to do purges on. The biggest flaw, in my view, is that it's hard to get a handle of how much RAM this it's eating up. Well, if the total possible amount of data within the server is 130MB, then that is something I'm perfectly comfortable to let Nginx handle cache in RAM.

Good HTTP performance benchmarking is hard to do but here's a teaser from my local laptop version of Nginx:

▶ hey -n 10000 -c 10 https://songsearch.local/api/song/1810960/affiliate/amazon-itunes

Summary:
  Total:    0.9882 secs
  Slowest:  0.0279 secs
  Fastest:  0.0001 secs
  Average:  0.0010 secs
  Requests/sec: 10119.8265


Response time histogram:
  0.000 [1] |
  0.003 [9752]  |■■■■■■■■■■■■■■■■■■■■■■■■■■■■■■■■■■■■■■■■
  0.006 [108]   |
  0.008 [70]    |
  0.011 [32]    |
  0.014 [8] |
  0.017 [12]    |
  0.020 [11]    |
  0.022 [1] |
  0.025 [4] |
  0.028 [1] |


Latency distribution:
  10% in 0.0003 secs
  25% in 0.0006 secs
  50% in 0.0008 secs
  75% in 0.0010 secs
  90% in 0.0013 secs
  95% in 0.0016 secs
  99% in 0.0068 secs

Details (average, fastest, slowest):
  DNS+dialup:   0.0000 secs, 0.0001 secs, 0.0279 secs
  DNS-lookup:   0.0000 secs, 0.0000 secs, 0.0026 secs
  req write:    0.0000 secs, 0.0000 secs, 0.0011 secs
  resp wait:    0.0008 secs, 0.0001 secs, 0.0206 secs
  resp read:    0.0001 secs, 0.0000 secs, 0.0013 secs

Status code distribution:
  [200] 10000 responses

10,000 requests across 10 clients at rougly 10,000 requests per second. That includes doing all the HTTP parsing, WSGI stuff, forming of a SQL or Redis query, the deserialization, the Django JSON HTTP response serialization etc. The cache TTL is controlled by simply setting a Cache-Control HTTP header with something like max-age=86400.

Now, repeated fetches for this are cached at the Nginx level and it means it doesn't even matter how slow/fast the database is. As long as it's not taking seconds, with a long Cache-Control, Nginx can hold on to this in RAM for days or until the whole server is restarted (which is rare).

Conclusion

If you the total amount of data that can and will be cached is controlled, putting it in a HTTP reverse proxy cache is probably order of magnitude faster than messing with chosing which database to use.

Dave Cramer: PostgreSQL Change Data Capture With Debezium

$
0
0

As you can see from my previous blogs (A Guide to Building an Active-Active PostgreSQL Cluster) I’m interested in the ways that we can replicate data in PostgreSQL. For this post, I've decided to write about a product that enabled replicating heterogeneous databases.

Through my involvement in the PostgreSQL JDBC project, I’ve had the opportunity to help out the folks in the Debezium project. Debezium is more than just another heterogeneous replication solution.

Debezium is built upon the Apache Kafka project and uses Kafka to transport the changes from one system to another. So let’s look at how this works.

The most interesting aspect of Debezium is that at the core it is using Change Data Capture (CDC) to capture the data and push it into Kafka. The advantage of this is that the source database remains untouched in the sense that we don’t have to add triggers or log tables. This is a huge advantage as triggers and log tables degrade performance.

Laurenz Albe: Tracking view dependencies in PostgreSQL

$
0
0

Edgar Allan Poe on view dependencies


We all know that in PostgreSQL we cannot drop an object if there are view dependencies on it:

CREATE TABLE t (id integer PRIMARY KEY);

CREATE VIEW v AS SELECT * FROM t;

DROP TABLE t;
ERROR:  cannot drop table t because other objects depend on it
DETAIL:  view v depends on table t
HINT:  Use DROP ... CASCADE to drop the dependent objects too.

ALTER TABLE t DROP id;
ERROR:  cannot drop column id of table t because other objects depend on it
DETAIL:  view v depends on column id of table t
HINT:  Use DROP ... CASCADE to drop the dependent objects too.

Some people like it because it keeps the database consistent; some people hate it because it makes schema modifications more difficult. But that’s the way it is.

In this article I want to explore the mechanics behind view dependencies and show you how to track what views depend on a certain PostgreSQL object.

Why would I need that?

Imagine you want to modify a table, e.g. change a column’s data type from integer to bigint because you realize you will need to store bigger numbers.
However, you cannot do that if there are views that use the column. You first have to drop those views, then change the column and then run all the CREATE VIEW statements to create the views again.

As the example shows, editing tables can be quite a challenge if there is a deep hierarchy of views, because you have to create the views in the correct order. You cannot create a view unless all the objects it requires are present.

Best practices with views

Before I show you how to untangle the mess, I’d like to tell you what mistakes to avoid when you are using views in your database design (excuse my switching to teacher mode; I guess holding courses has that effect on you).

Views are good for two things:

  • They allow you to have a recurring SQL query or expression in one place for easy reuse.
  • They can be used as an interface to abstract from the actual table definitions, so that you can reorganize the tables without having to modify the interface.

Neither of these applications require  you to “stack” views, that is, define views over views.

There are two patterns of using views that tend to be problematic, and they both stem from the mistaken idea that a view works exactly like a table, just because it looks like one:

  • Defining many layers of views so that your final queries look deceptively simple.
    However, when you try to unravel the views, for example by looking at the execution plan, the query turns out to be so complicated that it is almost impossible to understand what is really going on and how to improve it.
  • Defining a denormalized “world view” which is just a join of all your database tables and using that for all of your queries.
    People who do that tend to be surprised when certain WHERE conditions work well, but others take impossibly long.

Never forget that a view is just a “crystallized” SQL statement and gets replaced by its definition when the query is executed.

How are views stored in PostgreSQL?

A view in PostgreSQL is not that different from a table: it is a “relation”, that is “something with columns”.
All such objects are stored in the catalog table pg_class.

As the documentation states, a view is almost the same as a table, with a few exceptions:

  • it has no data file (because it holds no data)
  • its relkind is “v” rather than “r
  • it has an ON SELECT rule called “_RETURN

This “query rewrite rule” contains the definition of the view and is stored in the ev_action column of the pg_rewrite catalog table.

Note that the view definition is not stored as a string, but in the form of a “query parse tree”. Views are parsed when they are created, which has several consequences:

  • Object names are resolved during CREATE VIEW, so the current setting of search_path applies.
  • Objects are referred to by their internal immutable “object ID” rather than by their name. Consequently, it is no problem to rename an object or column used in a view definition.
  • PostgreSQL knows exactly which objects are used in the view definition, so it can add dependencies on them.

Note that the way PostgreSQl handles views quite different from the way PostgreSQL handles functions: function bodies are stored as strings and not parsed when they are created. Consequently, PostgreSQL cannot know on which objects a given function depends.

How are the dependencies stored?

All dependencies (except those on “shared objects”) are stored in the catalog table pg_depend:

  • classidstores the object ID of the catalog table containing the dependent object
  • objidstores the ID of the dependent object
  • objsubid stores the column number if the dependency is for a column
  • refobjid, objid and objsubid are like the three columns above, but describe the object referenced by the dependency
  • deptype describes the kind of dependency

It is important to notice that there is no direct dependency of a view on the objects it uses: the dependent object is actually the view’s rewrite rule. That adds another layer of indirection.

A simple example

In the following, I’ll use this schema to test my queries:

CREATE TABLE t1 (
   id integer PRIMARY KEY,
   val text NOT NULL
);

INSERT INTO t1 VALUES
   (1, 'one'),
   (2, 'two'),
   (3, 'three');

CREATE FUNCTION f() RETURNS text
   LANGUAGE sql AS 'SELECT ''suffix''';

CREATE VIEW v1 AS
SELECT max(id) AS id
FROM t1;

CREATE VIEW v2 AS
SELECT t1.val
FROM t1 JOIN v1 USING (id);

CREATE VIEW v3 AS
SELECT val || f()
FROM t1;

I have thrown in a function, just to show that a view can depend on objects other than tables.

In the following I will concentrate on tables and columns, but the queries will work for functions too, if you replace the catalog pg_class that contains tables with the catalog pg_proc that contains functions.

Finding direct view dependencies on a table

To find out which views directly depend on table t1, you would query like this:

SELECT v.oid::regclass AS view
FROM pg_depend AS d      -- objects that depend on the table
   JOIN pg_rewrite AS r  -- rules depending on the table
      ON r.oid = d.objid
   JOIN pg_class AS v    -- views for the rules
      ON v.oid = r.ev_class
WHERE v.relkind = 'v'    -- only interested in views
  -- dependency must be a rule depending on a relation
  AND d.classid = 'pg_rewrite'::regclass
  AND d.refclassid = 'pg_class'::regclass
  AND d.deptype = 'n'    -- normal dependency
  AND d.refobjid = 't1'::regclass;

 view 
------
 v2
 v1
 v3
 v2
(4 rows)

To find views with direct dependencies on the function f, simply replace “d.refclassid = 'pg_class'::regclass” with “d.refclassid = 'pg_proc'::regclass” and “refobjid = 't1'::regclass” with “refobjid = 'f'::regproc”.

Actually, the views will usually not depend on the table itself, but on the columns of the table (the exception is if a so-called “whole-row reference” is used in the view). That is why the view v2 shows up twice in the above list. You can remove those duplicates using DISTINCT.

Finding direct dependencies on a table column

We can modify the above query slightly to find those views that depend on a certain table column, which can be useful if you are planning to drop a column (adding a column to the base table is never a problem).

The following query finds the views that depend on the column val of table t1:

SELECT v.oid::regclass AS view
FROM pg_attribute AS a   -- columns for the table
   JOIN pg_depend AS d   -- objects that depend on the column
      ON d.refobjsubid = a.attnum AND d.refobjid = a.attrelid
   JOIN pg_rewrite AS r  -- rules depending on the column
      ON r.oid = d.objid
   JOIN pg_class AS v    -- views for the rules
      ON v.oid = r.ev_class
WHERE v.relkind = 'v'    -- only interested in views
  -- dependency must be a rule depending on a relation
  AND d.classid = 'pg_rewrite'::regclass
  AND d.refclassid = 'pg_class'::regclass 
  AND d.deptype = 'n'    -- normal dependency
  AND a.attrelid = 't1'::regclass
  AND a.attname = 'val';

 view 
------
 v3
 v2
(2 rows)

Recursively finding all dependent views

Now if you haven’t heeded the advice I gave above and you went ahead and defined a complicated hierarchy of views, it doesn’t stop with direct dependencies.
Rather, you need to recursively go through the whole hierarchy.

For example, let’s assume that you want to DROP and re-create the table t1 from our example and you need the CREATE VIEW statements to re-create the views once you are done (dropping them won’t be a problem if you use DROP TABLE t1 CASCADE).

Then you need to use the above queries in a recursive “common table expression” (CTE). The CTE is for tracking recursive view dependencies and can be reused for all such requirements; the only difference will be in the main query.

WITH RECURSIVE views AS (
   -- get the directly depending views
   SELECT v.oid::regclass AS view,
          1 AS level
   FROM pg_depend AS d
      JOIN pg_rewrite AS r
         ON r.oid = d.objid
      JOIN pg_class AS v
         ON v.oid = r.ev_class
   WHERE v.relkind = 'v'
     AND d.classid = 'pg_rewrite'::regclass
     AND d.refclassid = 'pg_class'::regclass
     AND d.deptype = 'n'
     AND d.refobjid = 't1'::regclass
UNION ALL
   -- add the views that depend on these
   SELECT v.oid::regclass,
          views.level + 1
   FROM views
      JOIN pg_depend AS d
         ON d.refobjid = views.view
      JOIN pg_rewrite AS r  
         ON r.oid = d.objid
      JOIN pg_class AS v    
         ON v.oid = r.ev_class
   WHERE v.relkind = 'v'    
     AND d.classid = 'pg_rewrite'::regclass
     AND d.refclassid = 'pg_class'::regclass
     AND d.deptype = 'n'    
     AND v.oid <> views.view  -- avoid loop
)
SELECT format('CREATE VIEW %s AS%s',
              view,
              pg_get_viewdef(view))
FROM views
GROUP BY view
ORDER BY max(level);

                  format                   
-------------------------------------------
 CREATE VIEW v3 AS SELECT (t1.val || f()) +
    FROM t1;
 CREATE VIEW v1 AS SELECT max(t1.id) AS id+
    FROM t1;
 CREATE VIEW v2 AS SELECT t1.val          +
    FROM (t1                              +
      JOIN v1 USING (id));
(3 rows)

We need the GROUP BY because a view may depend on an object in more than one ways: in our example, v2 depends on t1 twice: once directly, and once indirectly via v1.

Have questions? Need PostgreSQL support? You can reach us here.

The post Tracking view dependencies in PostgreSQL appeared first on Cybertec.

Pavel Stehule: pspg 2.0.2 is out

$
0
0
there is just one new feature - sort is supported on all columns, not only on numeric columns.

Fabien Coelho: Data Loading Performance of Postgres and TimescaleDB

$
0
0

Postgres is the leading feature-full independent open-source relational database, steadily increasing its popularity for the past 5 years. TimescaleDB is a clever extension to Postgres which implements time-series related features, including under the hood automatic partioning, and more.

Because he knows how I like investigate Postgres (among other things) performance, Simon Riggs (2ndQuadrant) prompted me to look at the performance of loading a lot of data into Postgres and TimescaleDB, so as to understand somehow the degraded performance reported in their TimescaleDB vs Postgres comparison. Simon provided support, including provisioning 2 AWS VMs for a few days each.

Summary

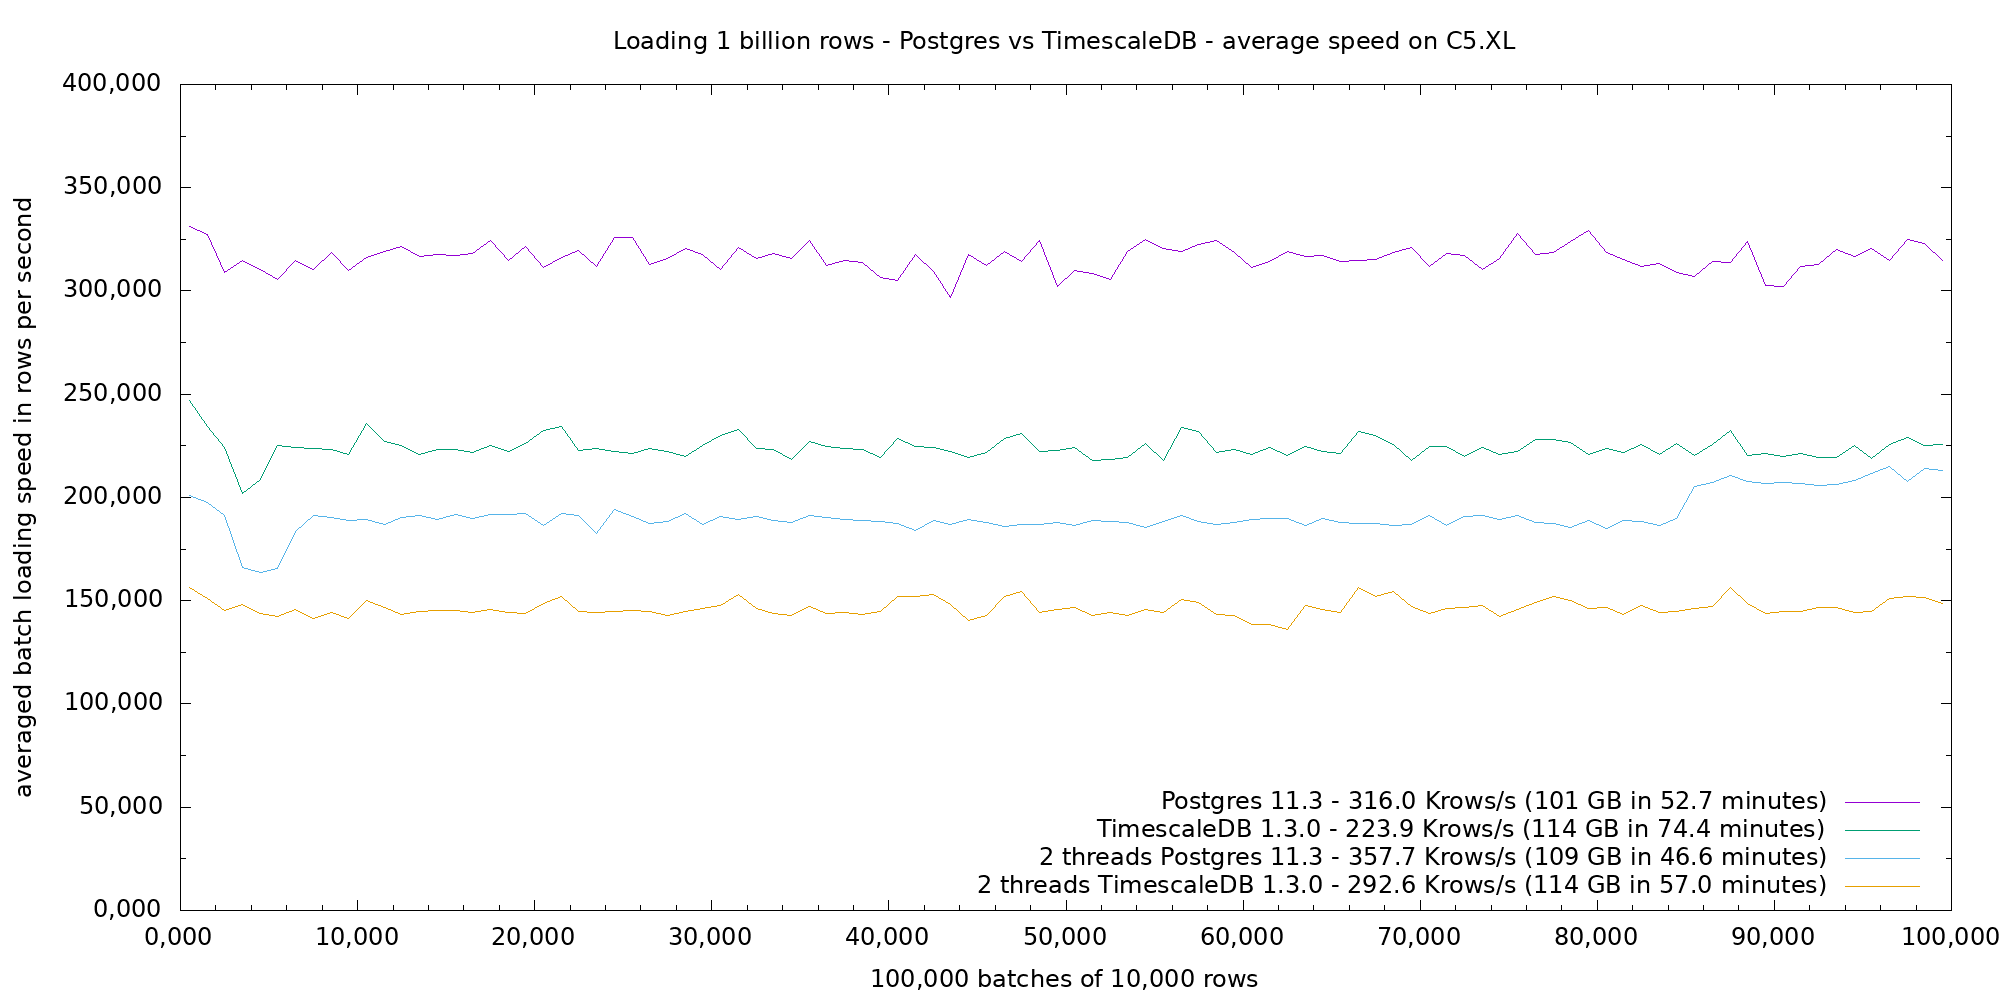
The short summary for the result-oriented enthousiast is that for the virtual hardware (AWS r5.2xl and c5.xl) and software (Pg 11.[23] and 12dev, TsDB 1.2.2 and 1.3.0) investigated, the performance of loading up to 4 billion rows in standard and partioned tables is great, with Postgres leading as it does not have the overhead of managing dynamic partitions and has a smaller storage footprint to manage. A typical loading speed figure on the c5.xl VM with 5 data per row is over 320 Krows/s for Postgres and 225 Krows/s for TimescaleDB. We are talking about bites of 100 GB ingested per hour.

The longer summary for the performance testing enthousiast is that such investigation is always much more tricky than it looks. Although you are always measuring something, what it is really is never that obvious because it depends on what actually limits the performance: the CPU spent on Postgres processes, the disk IO bandwidth or latency… or even the process of generating fake data. Moreover, performance on a VM with the underlying hardware systems shared between users tend to vary, so that it is hard to get definite and stable measures, with significant variation (about 16%) from one run to the next the norm.

Test Scenario

I basically reused the TimescaleDB scenario where many devices frequently send timespamped data points which are inserted by batch of 10,000 rows into a table with an index on the timestamp.

All programs used for these tests are available on GitHub.

CREATETABLEconditions(timeTIMESTAMPTZ,dev_idINT,data1FLOAT8,,dataXFLOAT8);CREATEINDEXconditions_time_idxONconditions(time);

I used standard tables and tables partitioned per week or month. Although the initial scenario inserts X=10 data per row, I used X=5 for most tests so as to emphasize index and partioning overheads.

For filling the tables, three approaches have been used:

  • a dedicated perl script that outputs a COPY, piped into psql: piping means that data generation and insertion work in parallel, but generation may possibly be too slow to saturate the system.

  • a C program that does the same, although about 3.5 times faster.

  • a threaded load-balanced libpq C program which connects to the database and fills the target with a COPY. Although generation and insertion are serialized in each thread, several connections run in parallel.

Performances

All in all I ran 140 over-a-billion row loadings: 17 in the r5.2xl AWS instance and 123 on the c5.xl instance; 112 runs loaded 1 billion rows, 4 runs loaded 2 billion rows and 24 runs loaded 4 billion rows.

First Tests on a R5.2XL Instance

The first serie of tests used a r5.2xl memory-optimized AWS instance (8 vCPU, 64 GiB) with a 500 GB EBS (Elastic Block Store) gp2 (General Purpose v2) SSD-based volume attached.

The rational for this choice, which will be proven totally wrong, was that the database loading would be limited by holding the table index in memory, because if it was spilled on disk the performance would suffer. I hoped to see the same performance degradation depicted in the TimescaleDB comparison when the index would reach the available memory size, and I wanted that not too soon.

The VM ran Ubuntu 18.04 with Postgres 11.2 and 12dev installed from apt.postgresql.org and TimescaleDB 1.2.2 from their ppa. Postgres default configuration was tune thanks to timescaledb-tune, on which I added a checkpoint_timeout:

shared_preload_libraries = 'timescaledb'
shared_buffers = 15906MB
effective_cache_size = 47718MB
maintenance_work_mem = 2047MB
work_mem = 40719kB
timescaledb.max_background_workers = 4
max_worker_processes = 15
max_parallel_workers_per_gather = 4
max_parallel_workers = 8
wal_buffers = 16MB
min_wal_size = 4GB
max_wal_size = 8GB
default_statistics_target = 500
random_page_cost = 1.1
checkpoint_completion_target = 0.9
max_connections = 50
max_locks_per_transaction = 512
effective_io_concurrency = 200
checkpoint_timeout = 1h

Then I started to load 1 to 4 billion rows with fill.pl ... | psql. Although it means that the producer and consummer run on the same host thus can interfere one with the other, I wanted to avoid running on two boxes and have potential network bandwidth issues between these.

For 1 billion rows, the total size is 100 GB (79 GB table and 21 GB index) on Postgres with standard or partitioned (about 11 weeks filled) tables, and 114 GB for TimescaleDB. For 4 billion rows we reach 398 GB (315 GB table + 84 GB index over memory) for standard Postgres and 457 GB (315 GB table + 142 GB index) for TimescaleDB. TimescaleDB storage requires 15% more space, the addition being used for the index.

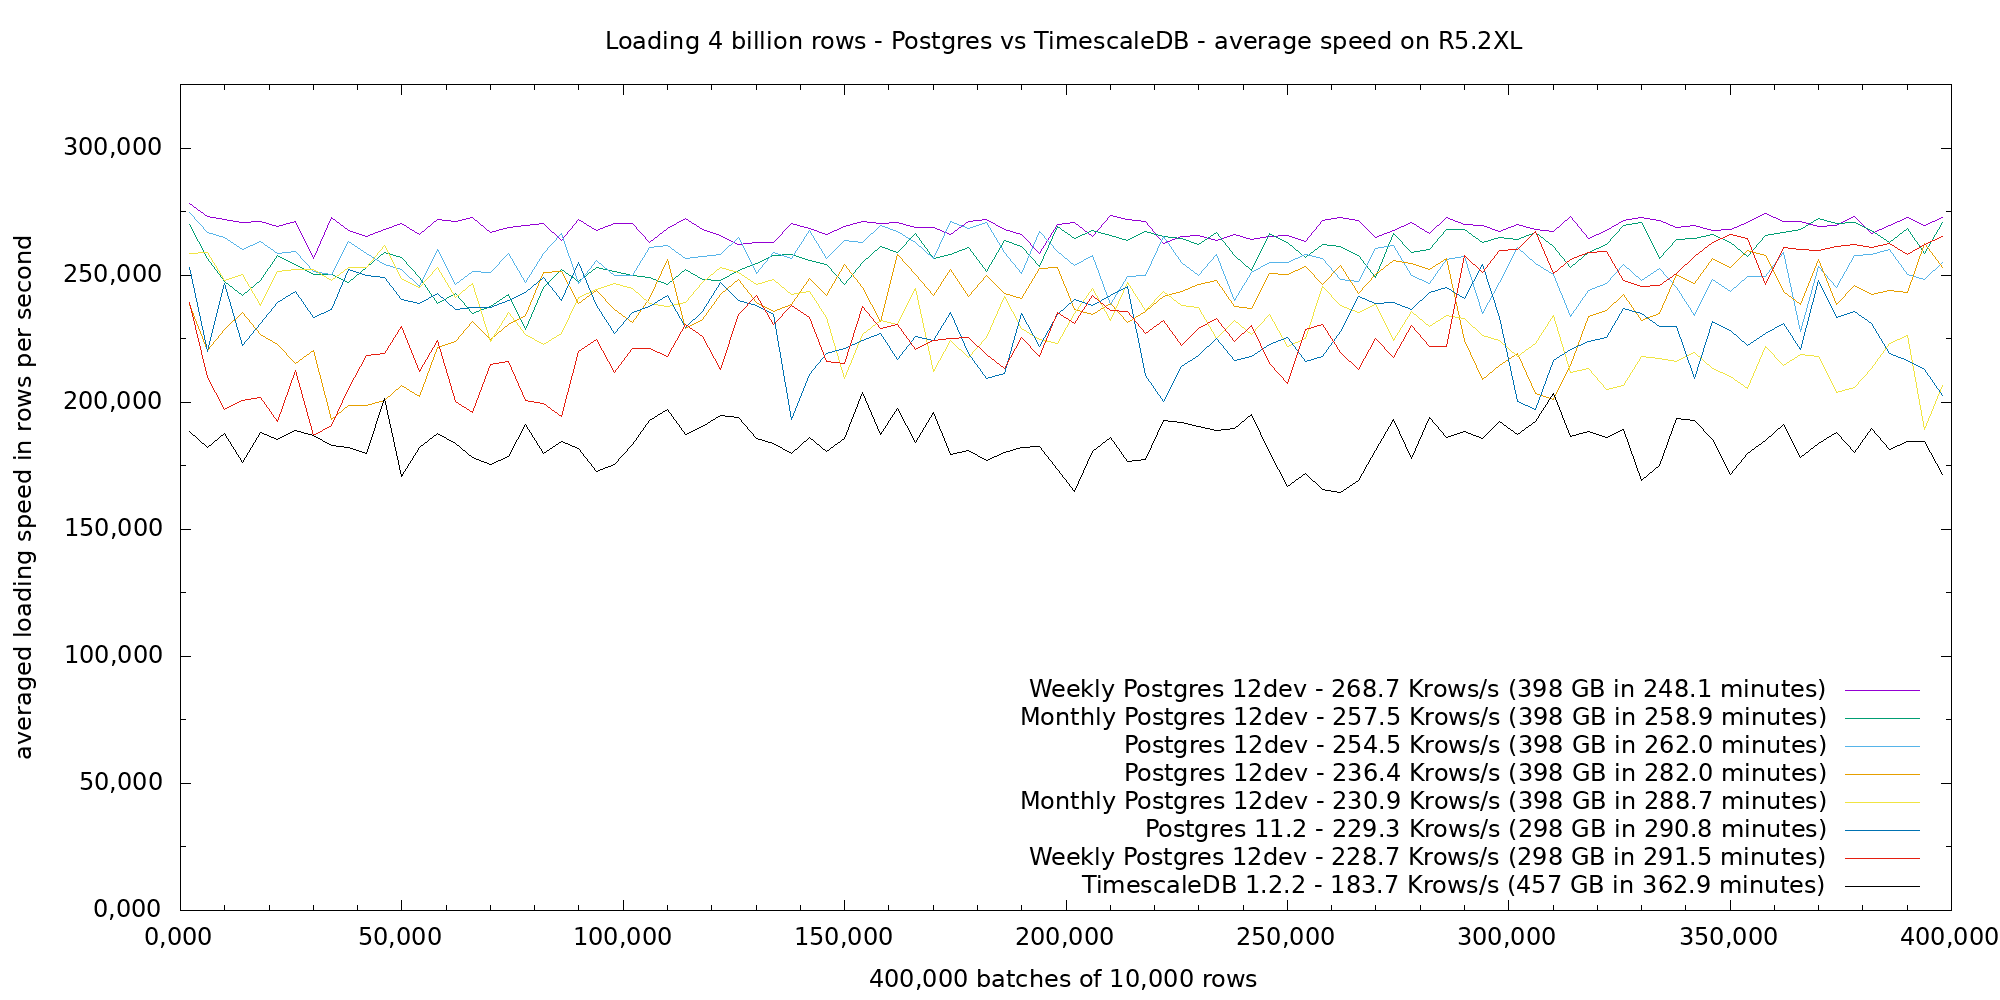
The next image shows the average speed of loading 4 billion rows in 400,000 batches of 10,000 rows on the r5.2xl VM with the psql-piping approach. All Postgres (standard, weekly or monthly partitions) tests load between 228 and 268 Krows/s, let us say an average of 248 Krows/s, while TimescaleDB loads at 183 Krows/s. TimescaleDB loads performance is about 26% below Postgres, which shows no sign of heavily decreasing performance over time.

Postgres vs TimescaleDB average loading speed

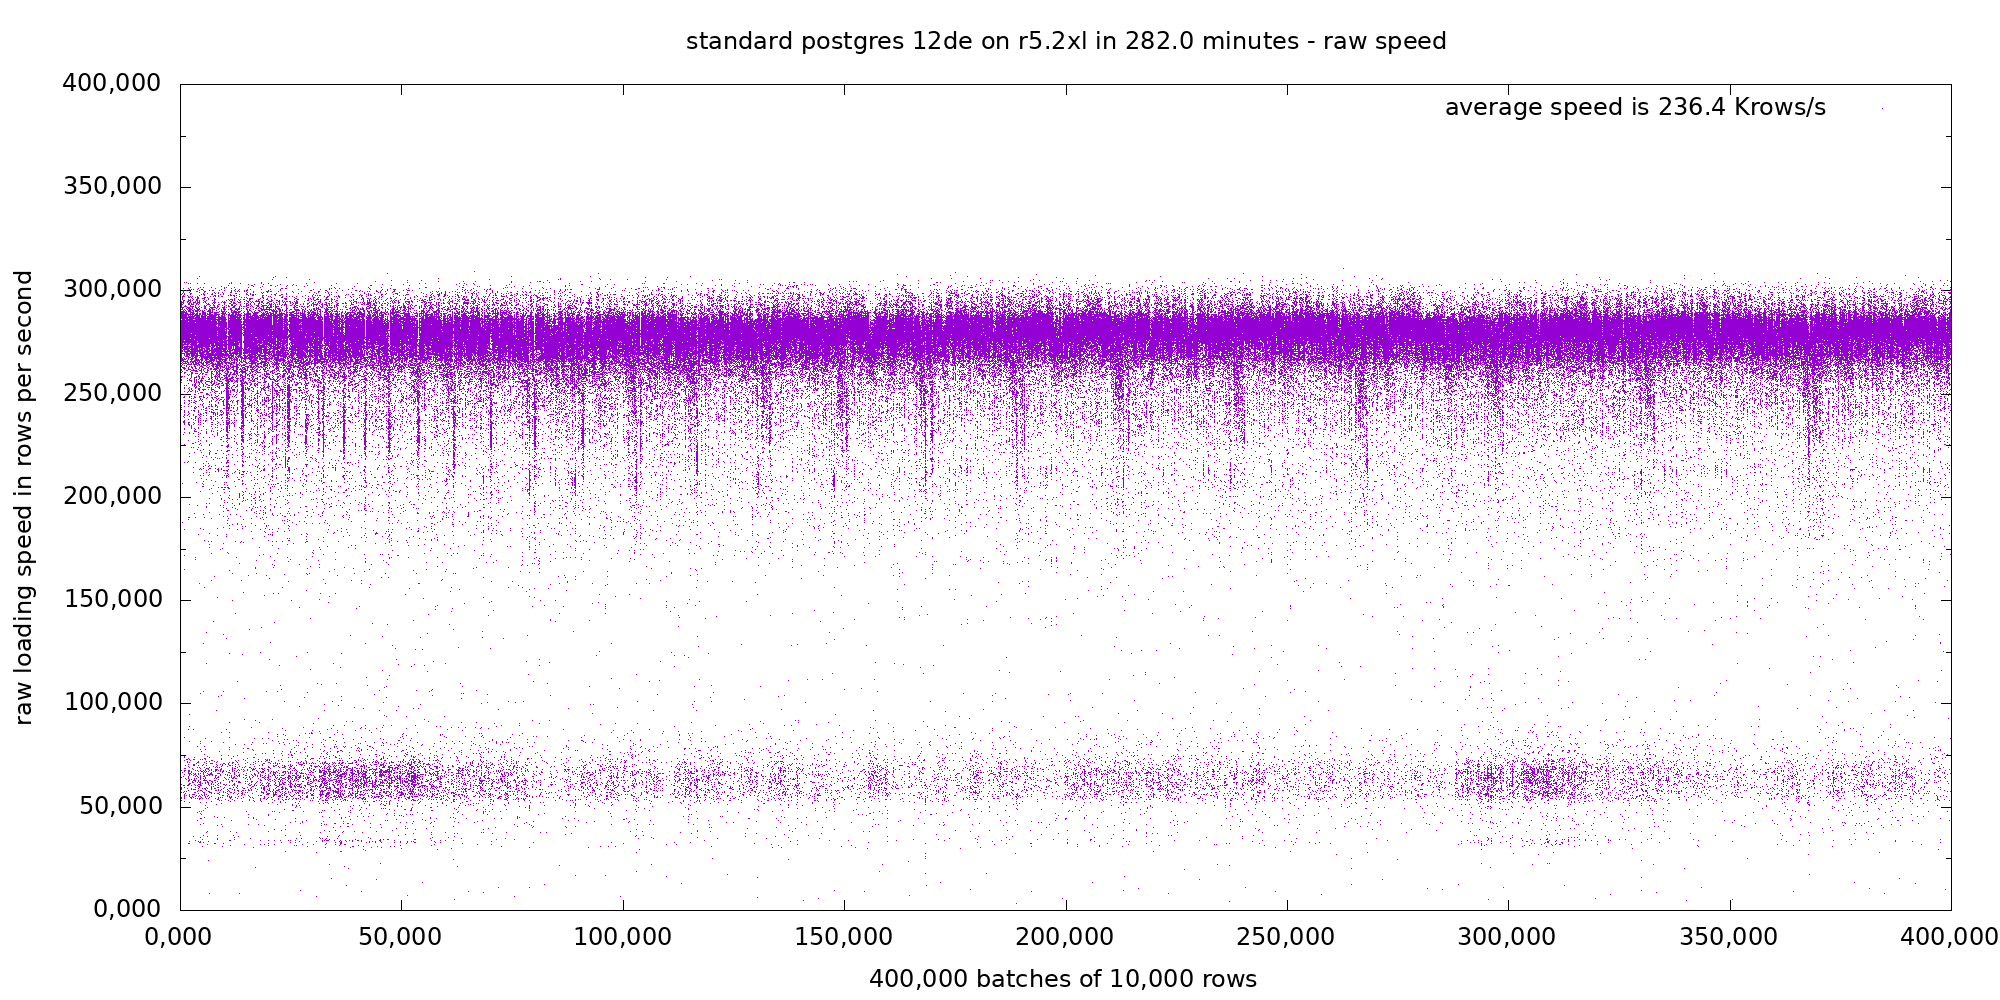
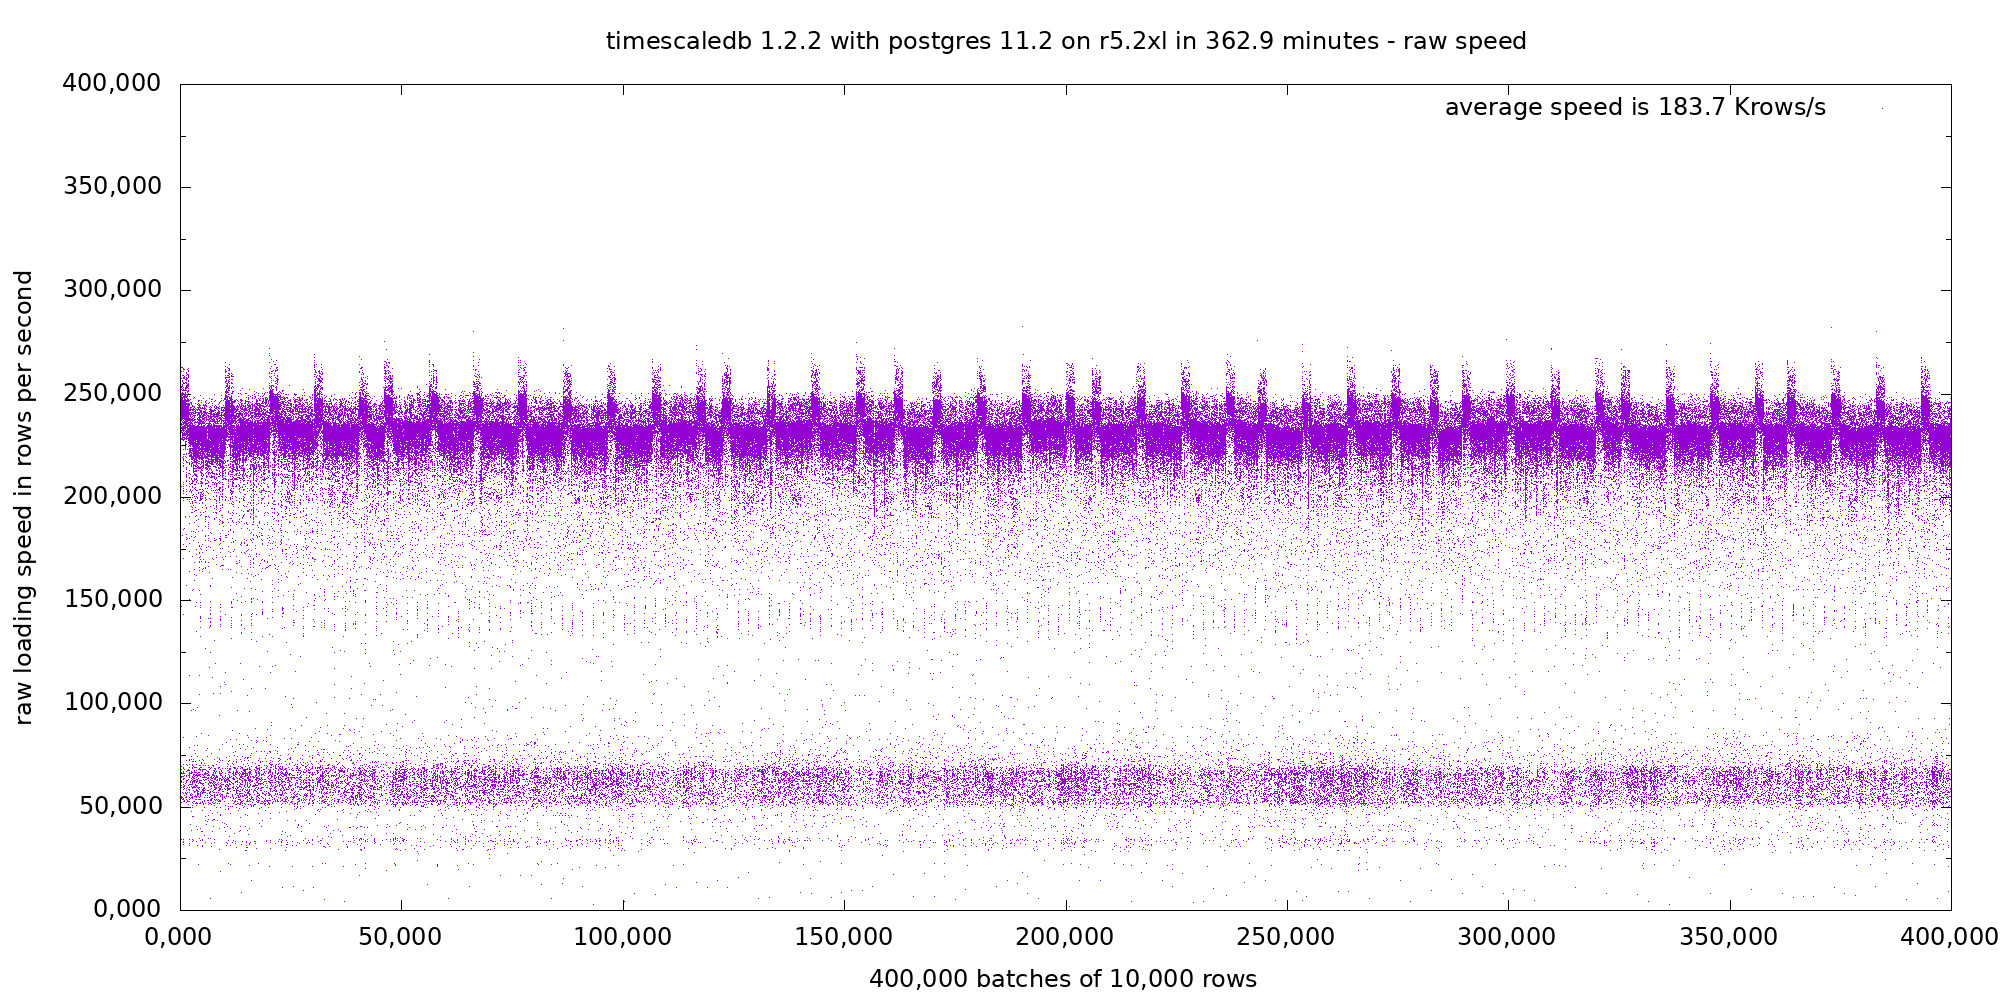
I could have left it at that, job done, round of applause. However, I like digging. Let us have a look at the detailed loading speed for the first Postgres 12dev standard tables run and for the TimescaleDB run.

Postgres raw loading speed

TimescaleDB raw loading speed

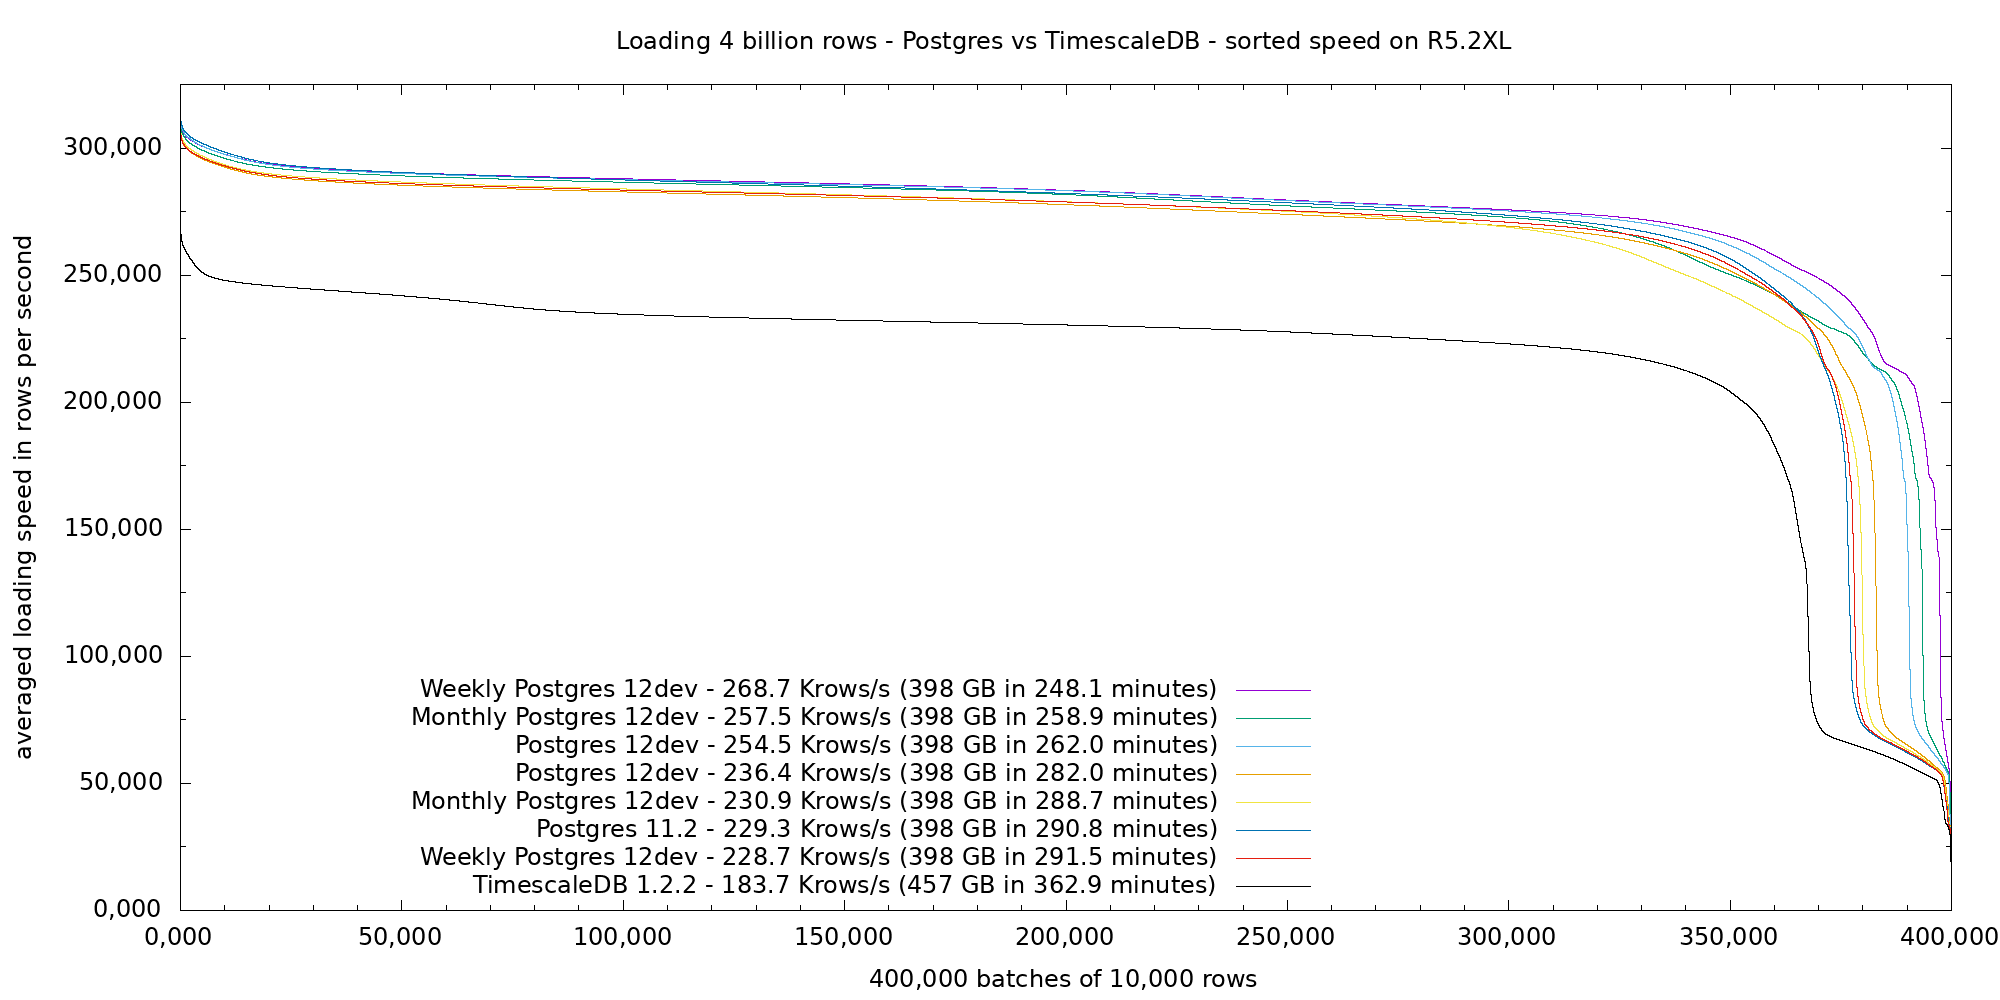
In both runs we can see two main modes: One dense high speed mode with pseudo-periodic upward or downward spikes, and a second sparse low speed mode around 65 Krows/s. The average is between these two modes. In order to get a (hopefully) clearer view, the next figures shows the sorted raw loading speed performance of all the presented runs.

Postgres vs TimescaleDB sorted loading speed

We can clearly see the two main modes: one long hight speed flat line encompassing 92 to 99% of each run, and a dwidling low-performance performance for 8 to 1% of in the end, with most measures around 65 Krows/s. For the high speed part, all Postgres runs perform consistently at about 280 Krows/s. TimescaleDB run performs at 245 Krows/s, a 13% gap: this is about the storage gap, as Postgres has 15% less data to process and store, thus the performance is 18% better on this part. For the low speed part, I think that it is mostly related to index storage (page eviction and checkpoint) which interrupts the normal high speed flow. As the TimescaleDB index is 69% larger, more batches are concerned, this explain the larger low speed mode in the end and explains the further 10% performance gap. Then you can add some unrelated speed variations (we are on a VM with other processes running and doing IOs), which add +- 8% on our measures, and we have a global explanation for the figures.

Now, some depressing news: although the perl script was faster than loading (I checked that fill.pl > /dev/null was running a little faster than when piped to psql), the margin was small, and you have to take into account how piping works, with processes interrupted and restarted based on the filling and consumption of the intermediate buffer, so that it is possible that I was running a partly data-generation CPU-bound test.

I rewrote the perl script in C and started again on a smaller box, which will give… better performance.

Second Tests on a C5.XL Instance

The second serie used a c5.xl CPU-optimized AWS instance (4 vCPU, 8 GiB), with the same volume attached. The rational for this choice is that I did not encounter any performance issue in the previous test when the index reached the memory size, so I did not really need a memory-enhanced instance in the first place, but I was possibly limited by CPU, so the faster the CPU the better.

Otherwise the installation followed the same procedure as described in the previous section, which resulted in updated versions (pg 11.3 et ts 1.3.0) and these configuration changes to adapt settings to the much smaller box:

shared_buffers = 1906MB
effective_cache_size = 5718MB
maintenance_work_mem = 976000kB
work_mem = 9760kB
max_worker_processes = 11
max_parallel_workers_per_gather = 2
max_parallel_workers = 4
max_locks_per_transaction = 64

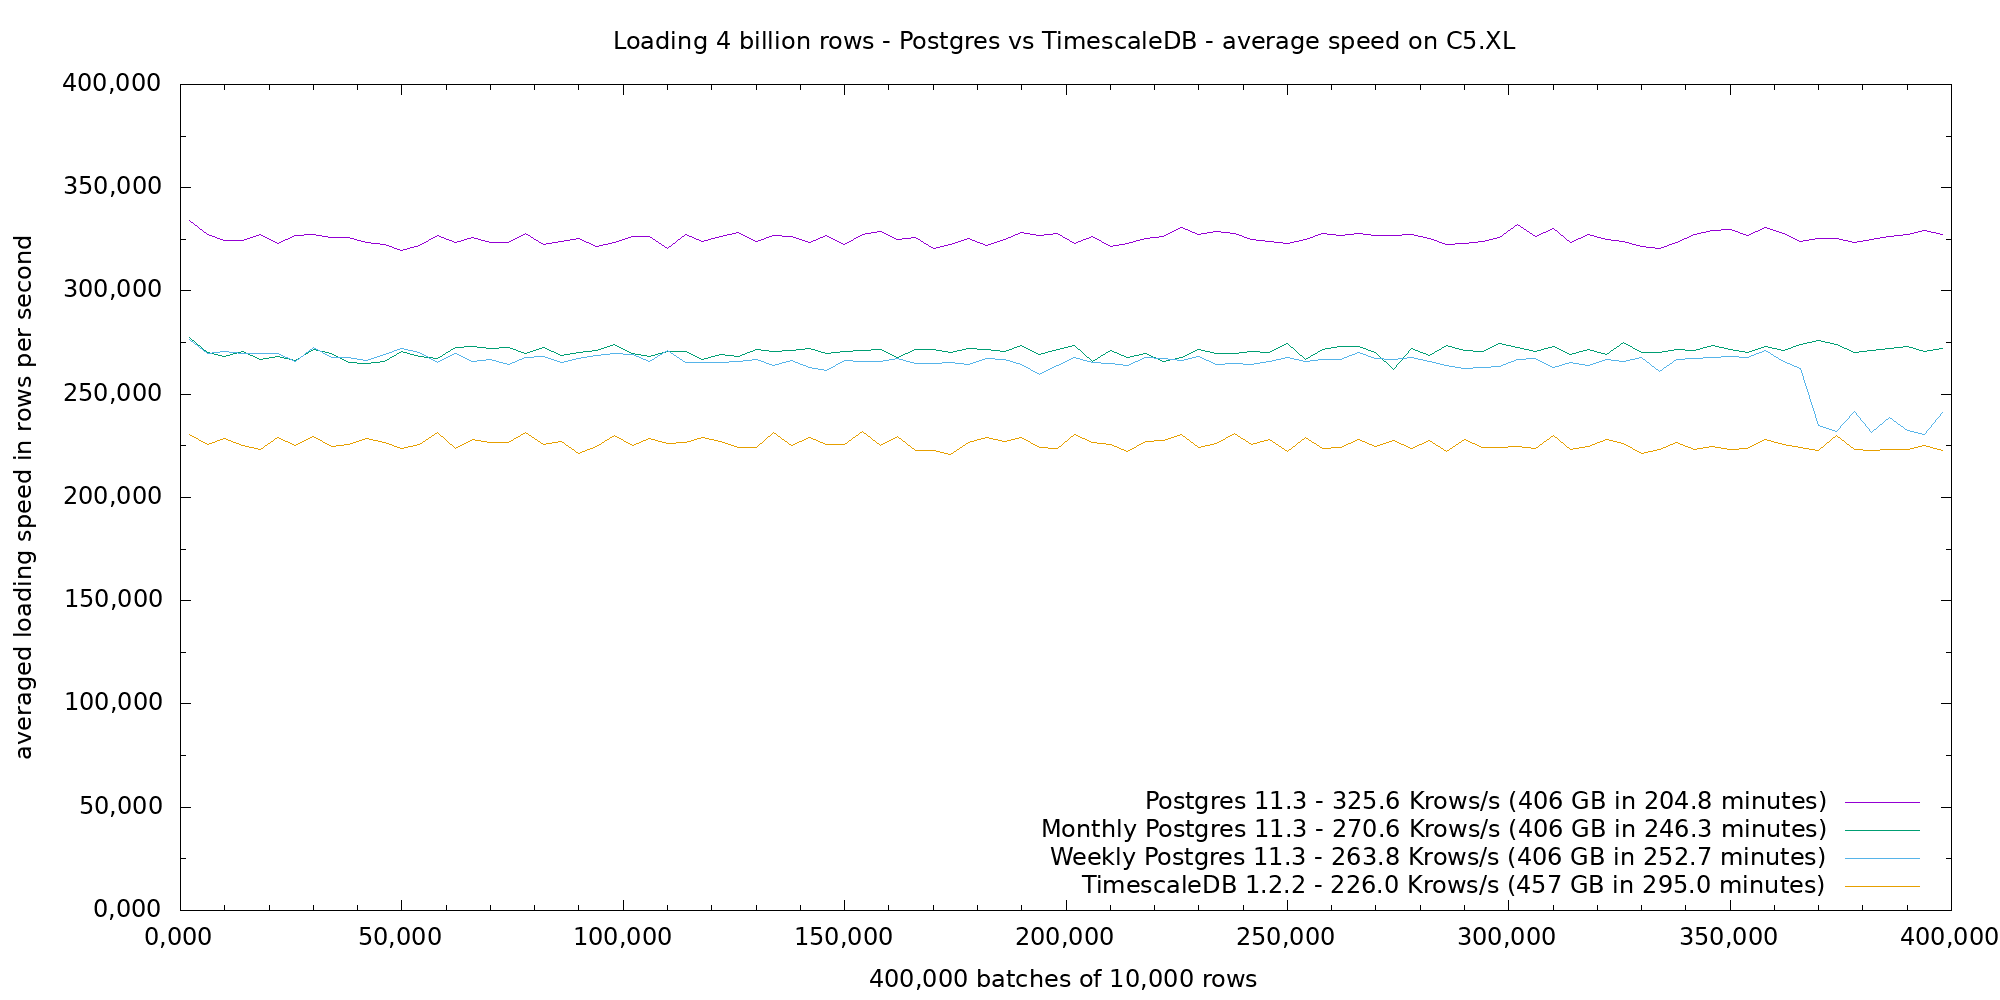
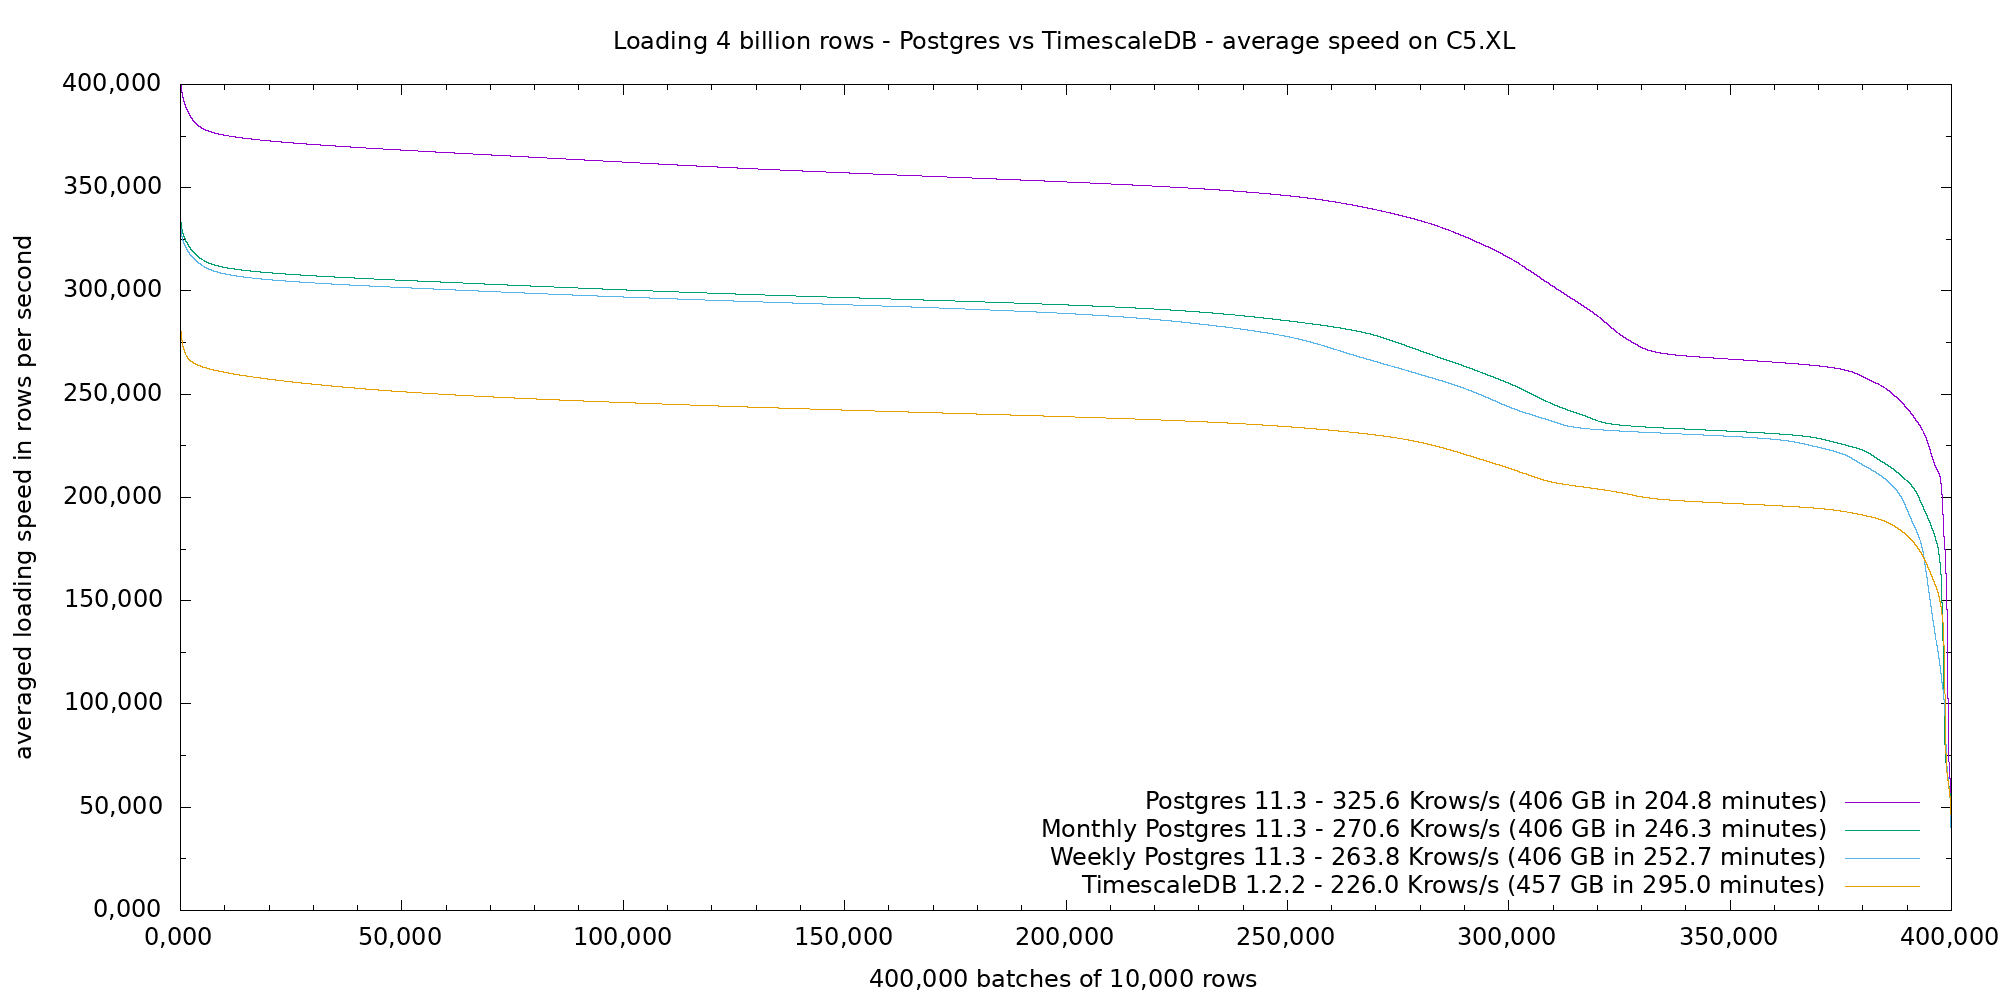
The next two figures shows average and sorted loading speed for 4 billion data on the C5.XL instance, with Postgres 11.3 and TimescaleDB 1.1.2. Postgres performance leads at 325 Krow/s, then both Postgres weekly and monthly partitioned tables around 265 Krows/s, then finally TimescaleDB which takes about 44% more time than Postgres at 226 Krows/s.

Postgres vs TimescaleDB average loading speed

Postgres vs TimescaleDB sorted loading speed

I implemented a threaded libpq-based generator, initially without load balance and then with load balancing, which allows to charge The next figure shows the averaged loading performance with the psql-pipe approach compared to two threads, which gave the best overall performance on the 4 vCPU VM.

Postgres vs TimescaleDB average loading speed

The upper lines show the loading speed of batches for Postgres vs TimescaleDB. The lower lines show the same with the two thread loading approach. Although the performance per batch is lower, two batches are running in parallel, hence the overall better performance. The end of Postgres parallel run shows a bump, which is due to the lack of load balancing of the version used in this run. It is interesting to note that Postgres incurs a size penalty, which is on the index, when the load is parallel.

Conclusion

It is the first time I ran a such precise data loading benchmark, trying to replicate results advertised in TimescaleDB documentation which shows Postgres loading performance degrading quickly.

I failed to achieve that: both tools perform consistently well, with Postgres v11 and v12 leading the way in raw loading performance, but also without the expected advantages of timeseries optimizations.

I’m used to run benches on bare metal, using a VM was a first. It is harder to interpret results because you do not really know what is going on, which is a pain.


Luca Ferrari: New Release of PL/Proxy

$
0
0

There is a new release of PL/Proxy out there!

New Release of PL/Proxy

There is a new exciting release of PL/Proxy: version 2.9 has been released a few hours ago!

This is an important release because it adds support for upcoming PostgreSQL 12. The main problem with PostgreSQL 12 has been that Oid is now a regular column, meaning that HeapTupleGetOid`` is no longer a valid macro. I first proposed a patch that was based on the C preprocessor to get rid of older PostgreSQL version.


The solution implemented by Marko Kreen is of course much more elegant and is based on defining helper functions that are pre-processed depending on the PostgreSQL version.

Enjoy proxying!

Hans-Juergen Schoenig: Fixing track_activity_query_size in postgresql.conf

$
0
0

Many of you might have wondered why some system views and monitoring statistics in PostgreSQL can contain incomplete query strings. The answer is that in PostgreSQL, it’s a configuration parameter that determines when a query will be cut off: track_activity_query_size. This blog post explains what this parameter does and how it can be used to its greatest advantage.

Why PostgreSQL cuts off queries

Some system views and extensions will show you which queries are currently running (pg_stat_activity) or which ones have eaten up most  time in the past (pg_stat_statements). Those system views are super important: I can strongly encourage you to make good use of this vital information. However, many of you might have noticed that queries are sometimes cut off prematurely. There are some important reasons for premature query cut off: in PostgreSQL, the content of both views comes from a shared memory segment which is not dynamic for reasons of efficiency. Therefore PostgreSQL allocates a fixed chunk of memory which is then used. If the query you want to look at does not fit into this piece of memory, it will be cut off. There is not much you can do about it apart from simply increasing track_activity_query_size so that everything you need is there.
The question is now: What is the best value to use when adjusting track_activity_query_size? There is no clear answer to this question. As always: it depends on your needs. If you happen to use Hibernate or some other ORM, I find a value around 32k (32.786 bytes) quite useful. Some other ORMs (Object Relational Mappers) will need similar values so that PostgreSQL can expose the entire query in a useful way.


fixing track_activity_query_size


Allocating memory using track_activity_query_size

You have to keep in mind that there is no such thing as a free lunch. If you increase track_activity_query_size in postgresql.conf the database will allocate slightly more than “max_connections x track_activity_query_size” bytes at database startup time to store your queries. While increasing the memory allocation of “track_activity_query_size” is surely a good investment on most systems you still have to be aware of this issue to avoid excessive memory usage. On a big system the downside of not having the data is usually larger, however. I therefore recommend always changing this parameter in ordner to see what is going on on your servers.

track_activity_query_size: Avoiding painful restarts

As stated before PostgreSQL uses shared memory (or mapped memory depending on your system) to store these kind of statistics. For that reason, PostgreSQL cannot dynamically change the size of the memory segment. Changing track_activity_query_size therefore also requires you to restart PostgreSQL which can be pretty nasty on a busy system. That’s why it makes sense to have the parameter already correctly set when the server is deployed.

Finally …

If you are unsure how to configure postgresql.conf in general check out our config generator which is available online on our website. If you want to find out more about PostgreSQL security we also encourage you to take a look at our blog post about pg_permissions.

The post Fixing track_activity_query_size in postgresql.conf appeared first on Cybertec.

Alexey Lesovsky: Freshly baked PostgreSQL 12 and changes it brought to pgCenter

$
0
0
PostgreSQL 12 release is expected today and just by looking at the prerelease notes this release is impressive - features added in the previous versions, became more “tasty”.

As pgCenter developer I am mainly interested in features related to monitoring and activity statistics. Postgres 11 didn’t have prominent monitoring features, but the upcoming release has several of these. In this post I will review these novations and show how they were implemented in pgCenter.

As you can remember, in Postgres 10 a new progress tracking view was introduced - pg_stat_progress_vacuum - which helps track vacuum activity and get a clearer understanding of what (auto)vacuum workers do.

This feature is growing in the new release and in Postgres 12 we will get two new progress views:
  • pg_stat_progress_create_index
  • pg_stat_progress_cluster
As you can see, from their names, the first view allows tracking progress of indexes creation (and reindexes too). The second view, allows tracking the progress of CLUSTER and VACUUM FULL operations. Don’t let VACUUM FULL confuse you, because internally its code is quite close to the code of CLUSTER command.

To summarize the above, the new Postgres brings additional tools for tracking maintenance operations which performed frequently by DBAs in their routines. Of course, this progress view is now supported by pgCenter and you can track the progress much easier.

However, to implement support of these views I had to accept some tradeoffs - one of them is the change of shortcuts for switching stats. Now, there is a new hotkey for watching progress statistics. Use ‘p’ hotkey for switching between vacuum, cluster or create indexes progress stats - it works in the same way as for pg_stat_statements stats. Also, you can press ‘P’ hotkey ang get the menu with progress stats views and select the appropriate one.

But that is not all, new Postgres brings another set of improvements related to activity statistics. A couple of them are related to pg_stat_database:

Two new columns have been added - checksum_failures and checksum_last_failure - which will be useful for users, who have checksums enabled in their databases. At this moment, pgCenter supports only checksum_failures column, and I hope you will only see zeroes in this column.

The second improvement is dedicated statistics for global objects in system catalog - these statistics are stored in row with datid = 0 and these stats don’t relate to particular databases. They also shown in pgCenter by default.

Among all changes, there are some which are not supported by pgCenter. One of the them is the pg_stat_ssl. It hasn’t been implemented since I don’t use it frequently enough, so simply don’t have good examples for pg_stat_ssl usage.

Another change is related to pg_stat_replication and shows last message received from standby hosts. And finally, there is an another new view - pg_stat_gssapi which shows information about GSSAPI authentication and encryption used by client connections.

For more information see:
Can’t wait to start using the brand new PostgreSQL 12!

cary huang: A Guide to Basic Postgres Partition Table and Trigger Function

$
0
0

1. Overview

Table partitioning is introduced after Postgres version 9.4 that provides several performance improvement under extreme loads. Partitioning refers to splitting one logically large table into smaller pieces, which in turn distribute heavy loads across smaller pieces (also known as partitions).

There are several ways to define a partition table, such as declarative partitioning and partitioning by inheritance. In this article we will focus on a simple form of declarative partitioning by value range.

Later in this article, we will discuss how we can define a TRIGGER to work with a FUNCTION to make table updates more dynamic.

2. Creating a Table Partition by Range

Let’s define a use case. Say we are a world famous IT consulting company and there is a database table called salesman_performance, which contains all the sales personnel world wide and their lifetime revenue of sales. Technically it is possible to have one table containing all sales personnel in the world but as entries get much larger, the query performance may be greatly reduced.

Here, we would like to create 7 partitions, representing 7 different levels of sales (or ranks) like so:

CREATE TABLE salesman_performance (
        salesman_id int not NULL,
        first_name varchar(45),
        last_name varchar(45),
        revenue numeric(11,2),
        last_updated timestamp
) PARTITION BY RANGE (revenue);

Please note that, we have to specify that it is a partition table by using keyword “PARTITION BY RANGE”. It is not possible to alter a already created table and make it a partition table.

Now, let’s create 7 partitions based on revenue performance:

CREATE TABLE salesman_performance_chief PARTITION OF salesman_performance
        FOR VALUES FROM (100000000.00) TO (999999999.99);

CREATE TABLE salesman_performance_elite PARTITION OF salesman_performance
        FOR VALUES FROM (10000000.00) TO (99999999.99);

CREATE TABLE salesman_performance_above_average PARTITION OF salesman_performance
        FOR VALUES FROM (1000000.00) TO (9999999.99);

CREATE TABLE salesman_performance_average PARTITION OF salesman_performance
        FOR VALUES FROM (100000.00) TO (999999.99);

CREATE TABLE salesman_performance_below_average PARTITION OF salesman_performance
        FOR VALUES FROM (10000.00) TO (99999.99);

CREATE TABLE salesman_performance_need_work PARTITION OF salesman_performance
        FOR VALUES FROM (1000.00) TO (9999.99);

CREATE TABLE salesman_performance_poor PARTITION OF salesman_performance
        FOR VALUES FROM (0.00) TO (999.99);

Let’s insert some values into “salesman_performace” table with different users having different revenue performance:

INSERT INTO salesman_performance VALUES( 1, 'Cary', 'Huang', 4458375.34, '2019-09-20 16:00:00');
INSERT INTO salesman_performance VALUES( 2, 'Nick', 'Wahlberg', 340.2, '2019-09-20 16:00:00');
INSERT INTO salesman_performance VALUES( 3, 'Ed', 'Chase', 764.34, '2019-09-20 16:00:00');
INSERT INTO salesman_performance VALUES( 4, 'Jennifer', 'Davis', 33750.12, '2019-09-20 16:00:00');
INSERT INTO salesman_performance VALUES( 5, 'Johnny', 'Lollobrigida', 4465.23, '2019-09-20 16:00:00');
INSERT INTO salesman_performance VALUES( 6, 'Bette', 'Nicholson', 600.44, '2019-09-20 16:00:00');
INSERT INTO salesman_performance VALUES( 7, 'Joe', 'Swank', 445237.34, '2019-09-20 16:00:00');
INSERT INTO salesman_performance VALUES( 8, 'Fred', 'Costner', 2456789.34, '2019-09-20 16:00:00');
INSERT INTO salesman_performance VALUES( 9, 'Karl', 'Berry', 4483758.34, '2019-09-20 16:00:00');
INSERT INTO salesman_performance VALUES( 10, 'Zero', 'Cage', 74638930.64, '2019-09-20 16:00:00');
INSERT INTO salesman_performance VALUES( 11, 'Matt', 'Johansson', 655837.34, '2019-09-20 16:00:00');

Postgres will automatically distribute queries to the respective partition based on revenue range.

You may run the \d+ command to see the table and its partitions

or examine just salesman_performance, which shows partition key and range

\d+ salesman-performance

we can also use EXPLAIN ANALYZE query to see the query plan PG system makes to scan each partition. In the plan, it indicates how many rows of records exist in each partition

EXPLAIN ANALYZE SELECT * FROM salesman_performance;

There you have it. This is a very basic partition table that distributes data by value range.

One of the advantages of using partition table is that bulk loads and deletes can be done simply by adding or removing partitions (DROP TABLE). This is much faster and can entirely avoid VACUUM overhead caused by DELETE

When you make a update to an entry. Say salesman_id 1 has reached the “Chief” level of sales rank from “Above Average” rank

UPDATE salesman_performance SET revenue = 445837555.34 where salesman_id=1;

You will see that Postgres automatically put salesman_id 1 into the “salesman_performance_chief” partition and removes from “salesman_performance_above_average”

3. Delete and Detach Partition

A partition can be deleted completely simply by the “DROP TABLE [partition name]” command. This may not be desirable in some use cases.

The more recommended approach is to use “DETACH PARTITION” queries, which removes the partition relationship but preserves the data.

ALTER TABLE salesman_performance DETACH PARTITION salesman_performance_chief;

If a partition range is missing, and the subsequent insertion has a range that no other partitions contain, the insertion will fail.

INSERT INTO salesman_performance VALUES( 12, 'New', 'User', 755837555.34, current_timestamp);

=> should result in failure because no partitions contain a range for this revenue =  755837555.34

If we add back the partition for the missing range, then the above insertion will work:

ALTER TABLE salesman_performance ATTACH PARTITION salesman_performance_chief
FOR VALUES FROM (100000000.00) TO (999999999.99);

4. Create Function Using Plpgsql and Define a Trigger

In this section, we will use an example of subscriber and coupon code redemption to illustrate the use of Plpgsql function and a trigger to correctly manage the distribution of available coupon codes.

First we will have a table called “subscriber”, which store a list of users and a table called “coupon”, which stores a list of available coupons.

CREATE TABLE subscriber (
    sub_id int not NULL,
    first_name varchar(45),
    last_name varchar(45),
    coupon_code_redeemed varchar(200),
    last_updated timestamp
);

CREATE TABLE coupon (
    coupon_code varchar(45),
    percent_off int CHECK (percent_off >= 0 AND percent_off<=100),
    redeemed_by varchar(100),
    time_redeemed timestamp
);

Let’s insert some records to the above tables:

INSERT INTO subscriber (sub_id, first_name, last_name, last_updated) VALUES(1,'Cary','Huang',current_timestamp);
INSERT INTO subscriber  (sub_id, first_name, last_name, last_updated) VALUES(1,'Nick','Wahlberg',current_timestamp);
INSERT INTO subscriber  (sub_id, first_name, last_name, last_updated) VALUES(1,'Johnny','Lollobrigida',current_timestamp);
INSERT INTO subscriber  (sub_id, first_name, last_name, last_updated) VALUES(1,'Joe','Swank',current_timestamp);
INSERT INTO subscriber  (sub_id, first_name, last_name, last_updated) VALUES(1,'Matt','Johansson',current_timestamp);

INSERT INTO coupon (coupon_code, percent_off) VALUES('CXNEHD-746353',20);
INSERT INTO coupon (coupon_code, percent_off)  VALUES('CXNEHD-653834',30);
INSERT INTO coupon (coupon_code, percent_off)  VALUES('CXNEHD-538463',40);
INSERT INTO coupon (coupon_code, percent_off)  VALUES('CXNEHD-493567',50);
INSERT INTO coupon (coupon_code, percent_off)  VALUES('CXNEHD-384756',95);

The tables now look like:

Say one subscriber redeems a coupon code, we would need a FUNCTION to check if the redeemed coupon code is valid (ie. Exists in coupon table). If valid, we will update the subscriber table with the coupon code redeemed and at the same time update the coupon table to indicate which subscriber redeemed the coupon and at what time.

CREATE OR REPLACE FUNCTION redeem_coupon() RETURNS trigger AS $redeem_coupon$
    BEGIN
    IF EXISTS ( SELECT 1 FROM coupon c where c.coupon_code = NEW.coupon_code_redeemed ) THEN
        UPDATE coupon SET redeemed_by=OLD.first_name, time_redeemed='2019-09-20 16:00:00' where  coupon_code = NEW.coupon_code_redeemed;
    ELSE
        RAISE EXCEPTION 'coupon code does not exist';
    END IF;
        RETURN NEW;
    END;
$redeem_coupon$ LANGUAGE plpgsql;

we need to define a TRIGGER, which is invoked BEFORE UPDATE, to check the validity of a given coupon code.

CREATE TRIGGER redeem_coupon_trigger
  BEFORE UPDATE
  ON subscriber
  FOR EACH ROW
  EXECUTE PROCEDURE redeem_coupon();

\d+ subscriber should look like this:

Let’s have some users redeem invalid coupon codes and as expected, an exception will be raised if coupon code is not valid.

UPDATE subscriber set coupon_code_redeemed='12345678' where first_name='Cary';
UPDATE subscriber set coupon_code_redeemed='87654321' where first_name='Nick';
UPDATE subscriber set coupon_code_redeemed='55555555' where first_name='Joe';

Let’s correct the above and redeem only the valid coupon codes and there should not be any error.

UPDATE subscriber set coupon_code_redeemed='CXNEHD-493567' where first_name='Cary';
UPDATE subscriber set coupon_code_redeemed='CXNEHD-653834' where first_name='Nick';
UPDATE subscriber set coupon_code_redeemed='CXNEHD-384756' where first_name='Joe';

Now both table should look like this, and now both table have information cross-related.

And there you have it, a basic trigger function executed before each update.

5. Summary

With the support of partitioned table defined by value range, we are able to define a condition for postgres to automatically split the load of a very large table across many smaller partitions. This has a lot of benefits in terms of performance boost and more efficient data management.

Having postgres FUNCTION and TRIGGER working together as a duo, we are able to make general queries and updates more dynamic and automatic to achieve more complex operations. As some of the complex logics can be defined and handled as FUNCTION, which is then invoked at appropriate moment defined by TRIGGER, the application integrated to Postgres will have much less logics to implement.

A multi-disciplined software developer specialised in C/C++ Software development, network security, embedded software, firewall, and IT infrastructure

cary huang: A Guide to Create User-Defined Extension Modules to Postgres

$
0
0

1. Overview

Postgres is a huge database system consisting of a wide range of built-in data types, functions, features and operators that can be utilized to solve many common to complex problems. However, in the world full of complex problems, sometimes these are just not enough depending on the use case complexities.

Worry not, since Postgres version 9, it is possible to extend Postgres’s existing functionalities with the use of “extensions”

In this article, I will show you how to create your own extensions and add to Postgres.

Please note that this article is based on Postgres version 12 running on Ubuntu 18.04 and before you can create your own extensions, PG must have been built and installed first

2. Built-in Extensions

Before we jump into creating your own extensions, it is important to know that there is already a list of extensions available from the PG community included in the Postgres software distribution.

The detailed information of community supplied extensions can be found in this link: https://www.postgresql.org/docs/9.1/contrib.html

3. Build and Install PG Default Extensions

All the PG community extensions are located in the directory below. This is also where we will be adding our own extensions

[PG SOURCE DIR]/postgres/contrib 

where [PG SOURCE DIR] is the directory to your PG source code

These modules are not built automatically unless you build the ‘world’ target. To Manually build and install them, use these commands.

cd contrib
make
sudo make install

The above command will install the extensions to

$SHAREDIR/extension

and required C shared libraries to

$LIBDIR

where $SHAREDIR and $LIBDIR are the values returned by pg_config

For the extensions that utilize the C language as implementation, there will be a C shared libraries (.so) being produced by the make command. This C shared library contains all the methods supported by the extension.

With default extensions and libraries installed, we can then see the installed extensions by the following queries

SELECT pg_available_extensions();
SELECT pg_available_extension_versions();

4. Create Extension Using plpqsql Language

For this example, we will create a very simple extension that will count the number of specified character of a given string. This extension takes 2 input arguments, first being the string, and second being the desired character. It will return an integer indicating the number of occurance of the desired characters presented in the string

first, let’s navigate to the contrib directory to add our extension

cd [PG SOURCE DIR]/contrib

let’s create a new directory called char_count. This will be the name of the extension

mkdir char_count
cd char_count

create the folders for defining testcases later

mkdir sql
mkdir expected

create and an extension control file using this naming convention:

[Extension name].control

in our case, it is:

char_count.control

# char_count extension
comment = 'function to count number of specified characters'
default_version = '1.0'
module_pathname = '$libdir/char_count'
relocatable = true

create a data sql file using this naming convention:

[Extension name]--[Extension version].sql

in our case, it is:

char_count–1.0.sql

\echo Use "CREATE EXTENSION char_count" to load this file. \quit
CREATE FUNCTION char_count(TEXT, CHAR)
RETURNS INTEGER
LANGUAGE plpgsql IMMUTABLE STRICT
  AS $$
    DECLARE
      charCount INTEGER := 0;
      i INTEGER := 0;
      inputText TEXT := $1;
      targetChar CHAR := $2;
    BEGIN
    WHILE i <= length(inputText) LOOP
      IF substring( inputText from i for 1) = targetChar THEN
        charCount := charCount + 1;
      END IF;
        i := i + 1;
      END LOOP;

    RETURN(charCount);
    END;
  $$;

Please note that the first echo line enforces the function to be loaded as extension

Create a Makefile

# contrib/char_count/Makefile

EXTENSION = char_count
DATA = char_count--1.0.sql
PGFILEDESC = "char_count - count number of specified character"
REGRESS = char_count

ifdef USE_PGXS
PG_CONFIG = pg_config
PGXS := $(shell $(PG_CONFIG) --pgxs)
include $(PGXS)
else
subdir = contrib/char_count
top_builddir = ../..
include $(top_builddir)/src/Makefile.global
include $(top_srcdir)/contrib/contrib-global.mk
endif

With the files in place ,we can go ahread and run within the char_count extension folder

sudo make install 

This will install char_count extension to $SHAREDIR

Now we can connect to the PG server and make use of the new extension that we have just added:

5. Create a Test Case for the New Extension

We have already created a sql folder from previous steps, let’s create a new .sql file for our test case

char_count.sql

CREATE EXTENSION char_count;
SELECT char_count('aaaabbbbbbbcc','a');
SELECT char_count('aaaabbbbbbbcc','b');
SELECT char_count('aaaabbbbbbbcc','c');
SELECT char_count('aaaabbbbbbbcc1111222222233333335555590','x');
SELECT char_count('aaaabbbbbbbcc1111222222233333335555590','c');
SELECT char_count('aaaabbbbbbbcc1111222222233333335555590','b');
SELECT char_count('aaaabbbbbbbcc1111222222233333335555590','5');
SELECT char_count('aaaabbbbbbbcc1111222222233333335555590','3');
SELECT char_count('aaaabbbbbbbcc1111222222233333335555590','2');
SELECT char_count('aaaabbbbbbbcc1111222222233333335555590','1');
SELECT char_count('aaaabbbbbbbcc1111222222233333335555590','0');
SELECT char_count('aaaabbbbbbbcc1111222222233333335555590','asd');

Please note that in the Makefile, we have to also specifiy the name of the regression tests with this line:

REGRESS = char_count

Run the testcase and Obtain Results

make installcheck

For the first time, the regression test will fail, because we have not provided the expected output file (.out file) for the test case. A new folder “results” is created upon running the regression test, and there is a (.out) file inside containing all the output from the test case

CREATE EXTENSION char_count;
SELECT char_count('aaaabbbbbbbcc','a');
 char_count 
------------
          4
(1 row)

SELECT char_count('aaaabbbbbbbcc','b');
 char_count 
------------
          7
(1 row)

SELECT char_count('aaaabbbbbbbcc','c');
 char_count 
------------
          2
(1 row)

SELECT char_count('aaaabbbbbbbcc1111222222233333335555590','x');
 char_count 
------------
          0
(1 row)

SELECT char_count('aaaabbbbbbbcc1111222222233333335555590','c');
 char_count 
------------
          2
(1 row)

SELECT char_count('aaaabbbbbbbcc1111222222233333335555590','b');
 char_count 
------------
          7
(1 row)

SELECT char_count('aaaabbbbbbbcc1111222222233333335555590','5');
 char_count 
------------
          5
(1 row)

SELECT char_count('aaaabbbbbbbcc1111222222233333335555590','3');
 char_count 
------------
          7
(1 row)

SELECT char_count('aaaabbbbbbbcc1111222222233333335555590','2');
 char_count 
------------
          7
(1 row)

SELECT char_count('aaaabbbbbbbcc1111222222233333335555590','1');
 char_count 
------------
          4
(1 row)

SELECT char_count('aaaabbbbbbbcc1111222222233333335555590','0');
 char_count 
------------
          1
(1 row)

SELECT char_count('aaaabbbbbbbcc1111222222233333335555590','asd');
ERROR:  value too long for type character(1)
CONTEXT:  PL/pgSQL function char_count(text,character) line 7 during statement block local variable initialization

We should examine this .out file and made sure the outputs are all correct and we will copy it over to the expected folder

cp char_count/results/char_count.out char_count/expected

6. Create your Own Extension Using C Language

In the previous section, we created a extension using plpgsql function language. This is in many ways very similar to the ‘CREATE FUNCTION’ commands except that in the above example, we specifically states that the function can only be loaded through the CREATE EXTENSION command.

In most cases, the custom extensions are mostly built in C codes because of its flexibility and performance benefits.

To demonstrate this, we will create a new extension called char_count_c. Let’s repeat some of the process above:

cd [PG_SOURCE_DIR]/contrib
mkdir char_count_c
cd char_count_c
mkdir expected
mkdir sql

create a control file for (char_count_c.control):

# char_count_c extension
comment = 'c function to count number of specified characters'
default_version = '1.0'
module_pathname = '$libdir/char_count_c'
relocatable = true

create a data sql file (char_count_c–1.0.sql)

\echo Use "CREATE EXTENSION char_count" to load this file. \quit
CREATE FUNCTION char_count_c(TEXT, TEXT) RETURNS INTEGER
AS '$libdir/char_count_c'
LANGUAGE C IMMUTABLE STRICT

This is where it differs from the previous method to add extension. In here we specifically set the LANGUAGE to be C as oppose to plpgsql.

$libdir/char_count_c is important as this is the path in which the PG will try to find a corresponding C share library when char_count_c extension is loaded.

Now, create a Makefile

MODULES = char_count_c
EXTENSION = char_count_c
DATA = char_count_c--1.0.sql
PGFILEDESC = "char_count_c - count number of specified character"
REGRESS = char_count_c

ifdef USE_PGXS
PG_CONFIG = pg_config
PGXS := $(shell $(PG_CONFIG) --pgxs)
include $(PGXS)
else
subdir = contrib/char_count_c
top_builddir = ../..
include $(top_builddir)/src/Makefile.global
include $(top_srcdir)/contrib/contrib-global.mk
endif

Here we added a new line called MODULES = char_count_c. This line will actually compile your C code into a shared library (.so) file which will be used by PG when char_count_c extension is loaded.

Create a new C source file

#include "postgres.h"
#include "fmgr.h"
#include "utils/builtins.h"

PG_MODULE_MAGIC;

PG_FUNCTION_INFO_V1(char_count_c);

Datum
char_count_c(PG_FUNCTION_ARGS)
{
        int charCount = 0;
        int i = 0;
        text * inputText = PG_GETARG_TEXT_PP(0);
        text * targetChar = PG_GETARG_TEXT_PP(1);

        int inputText_sz = VARSIZE(inputText)-VARHDRSZ;
        int targetChar_sz = VARSIZE(targetChar)-VARHDRSZ;
        char * cp_inputText = NULL;
        char * cp_targetChar = NULL;

        if ( targetChar_sz > 1 )
        {
                elog(ERROR, "arg1 must be 1 char long");
        }

        cp_inputText = (char *) palloc ( inputText_sz + 1);
        cp_targetChar = (char *) palloc ( targetChar_sz + 1);
        memcpy(cp_inputText, VARDATA(inputText), inputText_sz);
        memcpy(cp_targetChar, VARDATA(targetChar), targetChar_sz);

        elog(INFO, "arg0 length is %d, value %s", (int)strlen(cp_inputText), cp_inputText );
        elog(INFO, "arg1 length is %d, value %s", (int)strlen(cp_targetChar), cp_targetChar );

        while ( i < strlen(cp_inputText) )
        {
                if( cp_inputText[i] == cp_targetChar[0] )
                        charCount++;
                i++;
        }

        pfree(cp_inputText);
        pfree(cp_targetChar);
        PG_RETURN_INT32(charCount);
}

Now we can compile the extension

make

If make is successful, there should be a new C shared library created

Let’s go ahread and install

sudo make install

This will copy the
char_count_c–1.0.sql and char_count_c.control to $SHAREDIR/extension
and char_count_c.so to $LIBDIR

Make sure char_count_c.so is indeed installed to the $LIBDIR, otherwise, PG will not be able to find it when the extension is loaded.

With the extension installed, we can connect to the PG server and use the new extension

Create a new test case in char_count_c/sql

let’s make a copy of the test case from previous “char_count” example and change the names to “char_count_c”

CREATE EXTENSION char_count_c;
SELECT char_count_c('aaaabbbbbbbcc','a');
SELECT char_count_c('aaaabbbbbbbcc','b');
SELECT char_count_c('aaaabbbbbbbcc','c');
SELECT char_count_c('aaaabbbbbbbcc1111222222233333335555590','x');
SELECT char_count_c('aaaabbbbbbbcc1111222222233333335555590','c');
SELECT char_count_c('aaaabbbbbbbcc1111222222233333335555590','b');
SELECT char_count_c('aaaabbbbbbbcc1111222222233333335555590','5');
SELECT char_count_c('aaaabbbbbbbcc1111222222233333335555590','3');
SELECT char_count_c('aaaabbbbbbbcc1111222222233333335555590','2');
SELECT char_count_c('aaaabbbbbbbcc1111222222233333335555590','1');
SELECT char_count_c('aaaabbbbbbbcc1111222222233333335555590','0');
SELECT char_count_c('aaaabbbbbbbcc1111222222233333335555590','asd');

Please note that in the Makefile, we have to also specifiy the name of the regression tests with this line:

REGRESS = char_count_c

Run the test case

make installcheck

copy the .out file to expected folder

cp char_count_c/results/char_count_c.out char_count_c/expected

7. Add the new extensions to global Makefile

If you would like to have your extensions built along with the community ones, instead of building individually, you will need to modify the global extension Makefile located in [PG SOURCE DIR]/contrib/Makefile, and add:

char_count and char_count_c in SUBDIRS parameter

8. Summary

Postgres is a very flexibile and powerful database system that provides different ways for the end users to extend existing functionalities to fulfill his or her business needs.

From the examples above, we have learned that since Postgres version 9, we are able to create new extensions using either plpgsql or C language and be able to create regression tests as part of the extension build to ensure the extensions will work as intended.

A multi-disciplined software developer specialised in C/C++ Software development, network security, embedded software, firewall, and IT infrastructure

cary huang: Trace Query Processing Internals with Debugger

$
0
0

1. Overview

In this article we will use GDB debugger to trace the internals of Postgres and observe how an input query passes through several levels of transformation (Parser -> Analyzer -> Rewriter -> Planner -> Executor) and eventually produces an output.

This article is based on PG12 running on Ubuntu 18.04, and we will use a simple SELECT query with ORDER BY , GROUP BY, and LIMIT keywords to go through the entire query processing tracing.

2. Preparation

GDB debugger is required to be installed to trace the internals of Postgres. Most recent distribution of Linux already comes with gdb pre-installed. If you do not have it, please install.

2.1 Enable Debugging and Disable Compiler Optimization on PG Build

For GDB to be useful, the postgres binaries have to be compiled with debugging symbols enabled (-g). In addition, I would suggest to turn off compiler optimization (-O0) such that while tracing we will be able to examine all memory blocks and values, and observe the execution flow properly.

Enable debugging using the ./configure utility in the Postgres source code repository

cd [PG_SOURCE_DIR]
./configure --enable-debug

This will add the (-g) parameter to the CFLAGS in the main Makefile to include debugging symbols.

Once finished, let’s disable compiler optimization by editing

src/Makefile.global

Find the line where CFLAGS is defined and changed -O2 to -O0 like this:

CFLAGS = -Wall -Wmissing-prototypes -Wpointer-arith -Wdeclaration-after-statement -Werror=vla -Wendif-labels -Wmissing-format-attribute -Wformat-security -fno-strict-aliasing -fwrapv -fexcess-precision=standard -Wno-format-truncation -g -O0

Then we need to build and install with the new Makefile

make
sudo make install
2.2 Initialize Postgres Server

For a new build, we will need to initialize a new database

initDb /home/caryh/postgresql
create user caryh
createdb carytest

For referencing purposes, I would suggest enable debug log for the Postgres server by modifying postgres.conf located in database home directory. In this case it is located in

/home/caryh/postgresql/postgres.conf

Enable the following lines in postgres.conf

log_destination = 'syslog'
syslog_facility = 'LOCAL0'
syslog_ident = 'postgres'
syslog_sequence_numbers = on
syslog_split_messages = on

debug_print_parse = on
debug_print_rewritten = on
debug_print_plan = on
debug_pretty_print = on
log_checkpoints = on
log_connections = on
log_disconnections = on
log_duration = on

Why do we enable debug log when we will be tracing postgres with gdb? This is because the output at some of the stages of query processing is represented as a complex list of structures and it is not very straightforward to print this structure unless we have written a third party print script that can help us recursively print the content of the complex structure. Postgres already has this function built-in and presented in the form of a debugging log.

2.3 Start Postgres Server and Connect with Client Tool

Start the PG database

pg_ctl -D /home/caryh/postgresql start

Connect to PG database as user

psql -d carytest -U cary
2.4 Populate Example Tables and Values
CREATE TABLE deviceinfo (
  serial_number varchar(45) PRIMARY KEY,
  manufacturer varchar(45),
  device_type int,
  password varchar(45),
  registration_time timestamp
);

CREATE TABLE devicedata (
  serial_number varchar(45) REFERENCES deviceinfo(serial_number),
  record_time timestamp,
  uptime int,
  temperature numeric(10,2),
  voltage numeric(10,2),
  power numeric(10,2),
  firmware_version varchar(45),
  configuration_file varchar(45)
);

INSERT INTO deviceinfo VALUES( 'X00001', 'Highgo Inc', 1, 'password', '2019-09-18 16:00:00');
INSERT INTO deviceinfo VALUES( 'X00002', 'Highgo Inc', 2, 'password', '2019-09-18 17:00:00');
INSERT INTO deviceinfo VALUES( 'X00003', 'Highgo Inc', 1, 'password', '2019-09-18 18:00:00');

INSERT INTO devicedata VALUES ('X00001', '2019-09-20 16:00:00', 2000, 38.23, 189.00, 456.1, 'version01', 'config01');
INSERT INTO devicedata VALUES ('X00001', '2019-09-20 17:00:00', 3000, 68.23, 221.00, 675.1, 'version01', 'config01');
INSERT INTO devicedata VALUES ('X00001', '2019-09-20 18:00:00', 4000, 70.23, 220.00, 333.1, 'version01', 'config01');
INSERT INTO devicedata VALUES ('X00001', '2019-09-20 19:00:00', 5000, 124.23, 88.00, 678.1, 'version01', 'config01');
INSERT INTO devicedata VALUES ('X00002', '2019-09-20 11:00:00', 8000, 234.23, 567.00, 456.1, 'version01', 'config01');
INSERT INTO devicedata VALUES ('X00002', '2019-09-20 12:00:00', 9000, 56.23, 234.00, 345.1, 'version01', 'config01');
INSERT INTO devicedata VALUES ('X00002', '2019-09-20 13:00:00', 3000, 12.23, 56.00, 456.1, 'version01', 'config01');
INSERT INTO devicedata VALUES ('X00002', '2019-09-20 14:00:00', 4000, 56.23, 77.00, 456.1, 'version01', 'config01');
INSERT INTO devicedata VALUES ('X00003', '2019-09-20 07:00:00', 25000, 68.23, 99.00, 43.1, 'version01', 'config01');
INSERT INTO devicedata VALUES ('X00003', '2019-09-20 08:00:00', 20600, 178.23, 333.00, 456.1, 'version01', 'config01');
INSERT INTO devicedata VALUES ('X00003', '2019-09-20 09:00:00', 20070, 5.23, 33.00, 123.1, 'version01', 'config01');
INSERT INTO devicedata VALUES ('X00003', '2019-09-20 10:00:00', 200043, 45.23, 45.00, 456.1, 'version01', 'config01');
INSERT INTO devicedata VALUES ('X00003', '2019-09-20 09:00:00', 20070, 5.23, 33.00, 123.1, 'version01', 'config01');
INSERT INTO devicedata VALUES ('X00003', '2019-09-20 10:00:00', 200043, 45.23, 45.00, 456.1, 'version01', 'config01');

3. Start gdb Debugger

Find the PID of the connecting client PG session

$ ps -ef | grep postgres
caryh     7072  1946  0 Sep26 ?        00:00:01 /usr/local/pgsql/bin/postgres -D /home/caryh/postgresql
caryh     7074  7072  0 Sep26 ?        00:00:00 postgres: checkpointer   
caryh     7075  7072  0 Sep26 ?        00:00:01 postgres: background writer   
caryh     7076  7072  0 Sep26 ?        00:00:01 postgres: walwriter   
caryh     7077  7072  0 Sep26 ?        00:00:01 postgres: autovacuum launcher   
caryh     7078  7072  0 Sep26 ?        00:00:03 postgres: stats collector   
caryh     7079  7072  0 Sep26 ?        00:00:00 postgres: logical replication launcher   
caryh     7082  7072  0 Sep26 ?        00:00:00 postgres: cary carytest [local] idle

In this case it is the last line of the ps output as both my client and server reside in the same machine. Yours may be different.

caryh     7082  7072  0 Sep26 ?        00:00:00 postgres: cary carytest [local] idle

Now we can run gdb with the postgres binary

sudo gdb /usr/local/pgsql/bin/postgres
GNU gdb (Ubuntu 8.1-0ubuntu3) 8.1.0.20180409-git
Copyright (C) 2018 Free Software Foundation, Inc.
License GPLv3+: GNU GPL version 3 or later <http://gnu.org/licenses/gpl.html>
This is free software: you are free to change and redistribute it.
There is NO WARRANTY, to the extent permitted by law.  Type "show copying"
and "show warranty" for details.
This GDB was configured as "x86_64-linux-gnu".
Type "show configuration" for configuration details.
For bug reporting instructions, please see:
<http://www.gnu.org/software/gdb/bugs/>.
Find the GDB manual and other documentation resources online at:
<http://www.gnu.org/software/gdb/documentation/>.
For help, type "help".
Type "apropos word" to search for commands related to "word"...
Reading symbols from /usr/local/pgsql/bin/postgres...done.
(gdb)

Now, we can attach gdb to the PID identified in previous step

(gdb) attach 7082
Attaching to program: /usr/local/pgsql/bin/postgres, process 7082
Reading symbols from /lib/x86_64-linux-gnu/libpthread.so.0...Reading symbols from /usr/lib/debug/.build-id/28/c6aade70b2d40d1f0f3d0a1a0cad1ab816448f.debug...done.
done.
[Thread debugging using libthread_db enabled]
Using host libthread_db library "/lib/x86_64-linux-gnu/libthread_db.so.1".
Reading symbols from /lib/x86_64-linux-gnu/librt.so.1...Reading symbols from /usr/lib/debug//lib/x86_64-linux-gnu/librt-2.27.so...done.
done.
Reading symbols from /lib/x86_64-linux-gnu/libdl.so.2...Reading symbols from /usr/lib/debug//lib/x86_64-linux-gnu/libdl-2.27.so...done.
done.
Reading symbols from /lib/x86_64-linux-gnu/libm.so.6...Reading symbols from /usr/lib/debug//lib/x86_64-linux-gnu/libm-2.27.so...done.
done.
Reading symbols from /lib/x86_64-linux-gnu/libc.so.6...Reading symbols from /usr/lib/debug//lib/x86_64-linux-gnu/libc-2.27.so...done.
done.
Reading symbols from /lib64/ld-linux-x86-64.so.2...Reading symbols from /usr/lib/debug//lib/x86_64-linux-gnu/ld-2.27.so...done.
done.
Reading symbols from /lib/x86_64-linux-gnu/libnss_files.so.2...Reading symbols from /usr/lib/debug//lib/x86_64-linux-gnu/libnss_files-2.27.so...done.
done.
0x00007fce71eafb77 in epoll_wait (epfd=4, events=0x5633194c87e0, maxevents=1, timeout=-1)
    at ../sysdeps/unix/sysv/linux/epoll_wait.c:30
30  ../sysdeps/unix/sysv/linux/epoll_wait.c: No such file or directory.
(gdb)

Upon attach, Postgres process will be put on a break and we are able to issue breakpoints command from here

4. Start Tracing with gdb

exec_simple_query is the function that will trigger all stages of query processing. Let’s put a breakpoint here.

(gdb) b exec_simple_query
Breakpoint 1 at 0x56331899a43b: file postgres.c, line 985.
(gdb) c
Continuing.

Now, let’s type in a SELECT query with ORDER BY keywords on the postgres client connection terminal to trigger break point

carytest=> select serial_number, count(serial_number) from devicedata GROUP BY serial_number ORDER BY count DESC LIMIT 2;

Breakpoint should be triggered

Breakpoint 1, exec_simple_query (
    query_string=0x56331949cf00 "select * from devicedata order by serial_number desc;") at postgres.c:985
(gdb) 

Let’s do a backtrace bt command to see how the control got here.

(gdb) bt
#0  exec_simple_query (query_string=0x56331949cf00 "select * from devicedata order by serial_number desc;") at postgres.c:985
#1  0x000056331899f01c in PostgresMain (argc=1, argv=0x5633194c89c8, dbname=0x5633194c8890 "carytest", username=0x5633194c8878 "cary") at postgres.c:4249
#2  0x00005633188fba97 in BackendRun (port=0x5633194c0f60) at postmaster.c:4431
#3  0x00005633188fb1ba in BackendStartup (port=0x5633194c0f60) at postmaster.c:4122
#4  0x00005633188f753e in ServerLoop () at postmaster.c:1704
#5  0x00005633188f6cd4 in PostmasterMain (argc=3, argv=0x5633194974c0) at postmaster.c:1377
#6  0x000056331881a10f in main (argc=3, argv=0x5633194974c0) at main.c:228

As you can see, PostmasterMain process is one of the early process to be started and this is where it will spawn all the backend processes and initialize the ‘ServerLoop’ to listen for client connections. When a client connets and issues some queries, the handle will be passed from the backend to PostgresMain and this is where the query processing will begine.

5. Parser Stage

Parser Stage is the first stage in query processing, which will take an input query string and produce a raw un-analyzed parse tree. The control will eventually come to the raw_parser function, so let’s set a break point there and do a backtrace:

(gdb)  b raw_parser
Breakpoint 2 at 0x5633186b5bae: file parser.c, line 37.
(gdb)  c
Continuing.

Breakpoint 2, raw_parser (str=0x56331949cf00 "select * from devicedata order by serial_number desc;") at parser.c:37

(gdb) bt
#0  raw_parser (str=0x56331949cf00 "select * from devicedata order by serial_number desc;") at parser.c:37
#1  0x000056331899a03e in pg_parse_query ( query_string=0x56331949cf00 "select * from devicedata order by serial_number desc;") at postgres.c:641
#2  0x000056331899a4c9 in exec_simple_query ( query_string=0x56331949cf00 "select * from devicedata order by serial_number desc;") at postgres.c:1037
#3  0x000056331899f01c in PostgresMain (argc=1, argv=0x5633194c89c8, dbname=0x5633194c8890 "carytest",  username=0x5633194c8878 "cary") at postgres.c:4249
#4  0x00005633188fba97 in BackendRun (port=0x5633194c0f60) at postmaster.c:4431
#5  0x00005633188fb1ba in BackendStartup (port=0x5633194c0f60) at postmaster.c:4122
#6  0x00005633188f753e in ServerLoop () at postmaster.c:1704
#7  0x00005633188f6cd4 in PostmasterMain (argc=3, argv=0x5633194974c0) at postmaster.c:1377
#8  0x000056331881a10f in main (argc=3, argv=0x5633194974c0) at main.c:228

In raw_parser, 2 things will happen, first to scan the query with flex-based scanner to check keyword validity and second to do the actual parsing with bison-based parser. In the end, it will return a parse tree for next stage.

(gdb) n
43    yyscanner = scanner_init(str, &yyextra.core_yy_extra,
(gdb) n
47    yyextra.have_lookahead = false;
(gdb) n
50    parser_init(&yyextra);
(gdb) 
53    yyresult = base_yyparse(yyscanner);
(gdb) 
56    scanner_finish(yyscanner);
(gdb) 
58    if (yyresult)       /* error */
(gdb) 
61    return yyextra.parsetree;

It is not very straight-forward to examine the content of the parse tree stored in yyextra.parsetree as above. This is why we enabled postgres debug log so that we can utilize it to recursively print the content of the parse tree. The parse tree illustrated by yyextra.parsetree can be visualized as this image below:

6.0 Analyzer Stage

Now we have a list of parse trees, size 1 in this example, PG will need to feed each item in the list into anaylzer and rewriter functions. Let’s set a break point at parse_analyze function

(gdb)  b parse_analyze
Breakpoint 3 at 0x56331867d608: file analyze.c, line 104.
(gdb) c
Continuing.

Breakpoint 3, parse_analyze (parseTree=0x56331949dd50,  sourceText=0x56331949cf00 "select * from devicedata order by serial_number desc;", paramTypes=0x0, numParams=0, queryEnv=0x0) at analyze.c:104
104   ParseState *pstate = make_parsestate(NULL);
(gdb) bt

#0  parse_analyze (parseTree=0x56331949dd50, sourceText=0x56331949cf00 "select * from devicedata order by serial_number desc;", paramTypes=0x0, numParams=0, queryEnv=0x0) at analyze.c:104
#1  0x000056331899a0a8 in pg_analyze_and_rewrite (parsetree=0x56331949dd50, 
    query_string=0x56331949cf00 "select * from devicedata order by serial_number desc;", 
    paramTypes=0x0, numParams=0, queryEnv=0x0) at postgres.c:695
#2  0x000056331899a702 in exec_simple_query (
    query_string=0x56331949cf00 "select * from devicedata order by serial_number desc;")
    at postgres.c:1140
#3  0x000056331899f01c in PostgresMain (argc=1, argv=0x5633194c89c8, 
    dbname=0x5633194c8890 "carytest", username=0x5633194c8878 "cary") at postgres.c:4249
#4  0x00005633188fba97 in BackendRun (port=0x5633194c0f60) at postmaster.c:4431
#5  0x00005633188fb1ba in BackendStartup (port=0x5633194c0f60) at postmaster.c:4122
#6  0x00005633188f753e in ServerLoop () at postmaster.c:1704
#7  0x00005633188f6cd4 in PostmasterMain (argc=3, argv=0x5633194974c0) at postmaster.c:1377
#8  0x000056331881a10f in main (argc=3, argv=0x5633194974c0) at main.c:228

The above backtrace shows how the control gets to parse_analyze function, and 2 vital imputs are parseTree (type RawStmt) and (const char) sourceText

Let’s traverse to the end of parse_analyze

(gdb) n
109   pstate->p_sourcetext = sourceText;
(gdb) 
111   if (numParams > 0)
(gdb) 
114   pstate->p_queryEnv = queryEnv;
(gdb) 
116   query = transformTopLevelStmt(pstate, parseTree);
(gdb) 
118   if (post_parse_analyze_hook)
(gdb) 
121   free_parsestate(pstate);
(gdb) 
123   return query;

At analyzer stage, it produces a result of type Query and it is in fact the data type return from the parser stage as a List of Query. This structure will be fed into the rewriter stage.

7.0 Rewriter Stage

Rewriter is the next stage following analyzer, let’s create a break point at pg_rewrite_query and do a backtrace:

(gdb) b pg_rewrite_query
Breakpoint 4 at 0x56331899a1c1: file postgres.c, line 773
(gdb) c
Continuing.

Breakpoint 4, pg_rewrite_query (query=0x56331949dee0) at postgres.c:773
773   if (Debug_print_parse)
(gdb) bt
#0  pg_rewrite_query (query=0x56331949dee0) at postgres.c:773
#1  0x000056331899a0cf in pg_analyze_and_rewrite (parsetree=0x56331949dd50, 
    query_string=0x56331949cf00 "select * from devicedata order by serial_number desc;", 
    paramTypes=0x0, numParams=0, queryEnv=0x0) at postgres.c:704
#2  0x000056331899a702 in exec_simple_query (
    query_string=0x56331949cf00 "select * from devicedata order by serial_number desc;")
    at postgres.c:1140
#3  0x000056331899f01c in PostgresMain (argc=1, argv=0x5633194c89c8, 
    dbname=0x5633194c8890 "carytest", username=0x5633194c8878 "cary") at postgres.c:4249
#4  0x00005633188fba97 in BackendRun (port=0x5633194c0f60) at postmaster.c:4431
#5  0x00005633188fb1ba in BackendStartup (port=0x5633194c0f60) at postmaster.c:4122
#6  0x00005633188f753e in ServerLoop () at postmaster.c:1704
#7  0x00005633188f6cd4 in PostmasterMain (argc=3, argv=0x5633194974c0) at postmaster.c:1377
#8  0x000056331881a10f in main (argc=3, argv=0x5633194974c0) at main.c:228
(gdb)

Rewriter takes the output of the previou stage and returns a querytree_list of type List*. Let’s trace the function to the end and print the output

773     if (Debug_print_parse)
(gdb) n
774     elog_node_display(LOG, "parse tree", query,
(gdb) 
777   if (log_parser_stats)
(gdb) 
780   if (query->commandType == CMD_UTILITY)
(gdb) 
788     querytree_list = QueryRewrite(query);
(gdb) 
791   if (log_parser_stats)
(gdb) 
848   if (Debug_print_rewritten)
(gdb) 
849     elog_node_display(LOG, "rewritten parse tree", querytree_list,
(gdb) 
852   return querytree_list;

the line 774 elog_node_display and line 849 elog_node_display are the debug print function provided by postgres to recursively print the content of Query before and after rewriter stage. After examining the output query tree, we found that in this example, the rewriter does not make much modification to the origianl query tree and it can be visualized as:

8.0 Planner Stage

Planner is the next stage immediately following the previous. The main planner function entry point is pg_plan_query and it takes the output from previous stage as input. Let’s create a breakpoint and do a backtrace again

(gdb) b pg_plan_queries
Breakpoint 5 at 0x56331899a32d: file postgres.c, line 948.
(gdb) c
Continuing.

Breakpoint 5, pg_plan_queries (querytrees=0x563319558558, cursorOptions=256, boundParams=0x0)
    at postgres.c:948
948   List     *stmt_list = NIL;
(gdb) bt
#0  pg_plan_queries (querytrees=0x563319558558, cursorOptions=256, boundParams=0x0) at postgres.c:948
#1  0x000056331899a722 in exec_simple_query ( query_string=0x56331949cf00 "select * from devicedata order by serial_number desc;") at postgres.c:1143
#2  0x000056331899f01c in PostgresMain (argc=1, argv=0x5633194c89c8, dbname=0x5633194c8890 "carytest", username=0x5633194c8878 "cary") at postgres.c:4249
#3  0x00005633188fba97 in BackendRun (port=0x5633194c0f60) at postmaster.c:4431
#4  0x00005633188fb1ba in BackendStartup (port=0x5633194c0f60) at postmaster.c:4122
#5  0x00005633188f753e in ServerLoop () at postmaster.c:1704
#6  0x00005633188f6cd4 in PostmasterMain (argc=3, argv=0x5633194974c0) at postmaster.c:1377
#7  0x000056331881a10f in main (argc=3, argv=0x5633194974c0) at main.c:228
(gdb) 

Now, we are here, let’s trace the function until the end. Please note that for each content block in the input querytree list, the function will call a helper plan function called pg_plan_query and it will perform the real plan operation there and return the result in plannedStmt data type

(gdb) n
951   foreach(query_list, querytrees)
(gdb) n
953     Query    *query = lfirst_node(Query, query_list);
(gdb) n
956     if (query->commandType == CMD_UTILITY)
(gdb) n
968       stmt = pg_plan_query(query, cursorOptions, boundParams);
(gdb) s
pg_plan_query (querytree=0x56331949dee0, cursorOptions=256, boundParams=0x0) at postgres.c:866
866   if (querytree->commandType == CMD_UTILITY)
(gdb) n
874   if (log_planner_stats)
(gdb) 
878   plan = planner(querytree, cursorOptions, boundParams);
(gdb) n
880   if (log_planner_stats)
(gdb) 
929   if (Debug_print_plan)
(gdb) 
930     elog_node_display(LOG, "plan", plan, Debug_pretty_print);
(gdb) 
934   return plan;

Line 930 elog_node_display will print the content of PlannedStmt recursively to syslog and it can be visualized as:

The above plan tree corresponds to the output of EXPLAIN ANALYZE on the same query.

carytest=> EXPLAIN ANALYZE SELECT serial_number, COUNT(serial_number) from devicedata GROUP BY serial_number ORDER BY count DESC LIMIT 2;
                                                       QUERY PLAN                             

------------------------------------------------------------------------------------
 Limit  (cost=1.32..1.33 rows=2 width=15) (actual time=0.043..0.044 rows=2 loops=1)
   ->  Sort  (cost=1.32..1.33 rows=3 width=15) (actual time=0.042..0.042 rows=2 loops=1)
         Sort Key: (count(serial_number)) DESC
         Sort Method: quicksort  Memory: 25kB
         ->  HashAggregate  (cost=1.27..1.30 rows=3 width=15) (actual time=0.033..0.035 rows=3
 loops=1)
               Group Key: serial_number
               ->  Seq Scan on devicedata  (cost=0.00..1.18 rows=18 width=7) (actual time=0.01
3..0.016 rows=18 loops=1)
 Planning Time: 28.541 ms
 Execution Time: 0.097 ms
(9 rows)

Line 878 plan = planner(querytree, cursorOptions, boundParams); in the above trace is the real planner logic and it is a complex stage. Inside this function, it will compute the initial cost and run time cost of all possible queries and in the end, it will choose a plan that is the least expensive.

with the plannedStmt produced, we are ready to enter the next stage of query processing.

9.0 Executor Stage

In addition to planner, executor is also one of the complex stages of query processing. This module is responsible for executing the query plan produced from previous stage and sending the query results back to the connecting client.

Executor is invoked and managed with a wrapper called portal and portal is an object representing the execution state of a query and providing memory management services but it does not actually run the executor. In the end, the portal will invoke one of the four executor routines as below

-ExecutorStart()
-ExecutorRun()
-ExecutorFinish()
-ExecutorEnd()

Before we can use the above routines, the portal needs to be initialized first. In the previous stage, the control is left at exec_simple_query at line 1147, let’s continue tracing from here to enter portal initialization

Let’s create a break point for each executor routine and do a back trace on each as we continue

(gdb) b ExecutorStart
Breakpoint 6 at 0x5633187ad797: file execMain.c, line 146.
(gdb) b ExecutorRun
Breakpoint 7 at 0x5633187ada1e: file execMain.c, line 306.
(gdb) b ExecutorFinish
Breakpoint 8 at 0x5633187adc35: file execMain.c, line 405.
(gdb) b ExecutorEnd
Breakpoint 9 at 0x5633187add1e: file execMain.c, line 465.
9.1 Executor Start

The main purpose of ExecutorStart routine is to prepare the query plan, allocate storage and prepare rule manager. Let’s continue the tracing and do a backtrace.

Breakpoint 6, ExecutorStart (queryDesc=0x5633195712e0, eflags=0) at execMain.c:146
146   if (ExecutorStart_hook)
(gdb) bt
#0  ExecutorStart (queryDesc=0x564977500190, eflags=0) at execMain.c:146
#1  0x0000564975eb87e0 in PortalStart (portal=0x5649774a18d0, params=0x0, eflags=0, snapshot=0x0)
    at pquery.c:518
#2  0x0000564975eb27b5 in exec_simple_query (
    query_string=0x564977439f00 "select serial_number, count(serial_number) from devicedata GROUP BY serial_number ORDER BY count DESC LIMIT 2;") at postgres.c:1176
#3  0x0000564975eb701c in PostgresMain (argc=1, argv=0x564977465a08, 
    dbname=0x5649774658d0 "carytest", username=0x5649774658b8 "cary") at postgres.c:4249
#4  0x0000564975e13a97 in BackendRun (port=0x56497745dfa0) at postmaster.c:4431
#5  0x0000564975e131ba in BackendStartup (port=0x56497745dfa0) at postmaster.c:4122
#6  0x0000564975e0f53e in ServerLoop () at postmaster.c:1704
#7  0x0000564975e0ecd4 in PostmasterMain (argc=3, argv=0x5649774344c0) at postmaster.c:1377
#8  0x0000564975d3210f in main (argc=3, argv=0x5649774344c0) at main.c:228

(gdb)
9.2 Executor Run

ExecutorRun is the main routine of executor module, and its main task is to execute the query plan, this routing will call the ExecutePlan function to actually execute the plan. In the end, before return, the result of query will be stored in Estate structure called estate and inside there is a count of how many tutples have been processed by the executor

(gdb) c
Continuing.

Breakpoint 7, ExecutorRun (queryDesc=0x5633195712e0, direction=ForwardScanDirection, count=0, 
    execute_once=true) at execMain.c:306
306   if (ExecutorRun_hook)
(gdb) bt
#0  ExecutorRun (queryDesc=0x564977500190, direction=ForwardScanDirection, count=0, 
    execute_once=true) at execMain.c:306
#1  0x0000564975eb915c in PortalRunSelect (portal=0x5649774a18d0, forward=true, count=0, 
    dest=0x564977539460) at pquery.c:929
#2  0x0000564975eb8db6 in PortalRun (portal=0x5649774a18d0, count=9223372036854775807, 
    isTopLevel=true, run_once=true, dest=0x564977539460, altdest=0x564977539460, 
    completionTag=0x7ffff0b937d0 "") at pquery.c:770
#3  0x0000564975eb28ad in exec_simple_query (
    query_string=0x564977439f00 "select serial_number, count(serial_number) from devicedata GROUP BY serial_number ORDER BY count DESC LIMIT 2;") at postgres.c:1215
#4  0x0000564975eb701c in PostgresMain (argc=1, argv=0x564977465a08, 
    dbname=0x5649774658d0 "carytest", username=0x5649774658b8 "cary") at postgres.c:4249
#5  0x0000564975e13a97 in BackendRun (port=0x56497745dfa0) at postmaster.c:4431
#6  0x0000564975e131ba in BackendStartup (port=0x56497745dfa0) at postmaster.c:4122
#7  0x0000564975e0f53e in ServerLoop () at postmaster.c:1704
#8  0x0000564975e0ecd4 in PostmasterMain (argc=3, argv=0x5649774344c0) at postmaster.c:1377
#9  0x0000564975d3210f in main (argc=3, argv=0x5649774344c0) at main.c:228
(gdb) 

Continue tracing the ExecutorRun to the end.

306   if (ExecutorRun_hook)
(gdb) n
309     standard_ExecutorRun(queryDesc, direction, count, execute_once);
(gdb) s
standard_ExecutorRun (queryDesc=0x564977500190, direction=ForwardScanDirection, count=0, 
    execute_once=true) at execMain.c:325
325   estate = queryDesc->estate;
(gdb) n
333   oldcontext = MemoryContextSwitchTo(estate->es_query_cxt);
(gdb) n
336   if (queryDesc->totaltime)
(gdb) n
342   operation = queryDesc->operation;
(gdb) 
343   dest = queryDesc->dest;
(gdb) 
348   estate->es_processed = 0;
(gdb) 
350   sendTuples = (operation == CMD_SELECT ||
(gdb) 
353   if (sendTuples)
(gdb) 
354     dest->rStartup(dest, operation, queryDesc->tupDesc);
(gdb) 
359   if (!ScanDirectionIsNoMovement(direction))
(gdb) 
361     if (execute_once && queryDesc->already_executed)
(gdb) 
363     queryDesc->already_executed = true;
(gdb) 
365     ExecutePlan(estate,
(gdb) 
367           queryDesc->plannedstmt->parallelModeNeeded,
(gdb) 
365     ExecutePlan(estate,
(gdb) 
379   if (sendTuples)
(gdb) 
380     dest->rShutdown(dest);
(gdb) 
382   if (queryDesc->totaltime)
(gdb) 
385   MemoryContextSwitchTo(oldcontext);
(gdb) p estate
$6 = (EState *) 0x56497751fbb0
(gdb) p estate->es_processed
$7 = 2
9.3 Executor Finish

ExecutorFinish must be called after the last ExecutorRun, its main task is to perform necessary clearn up actions and also fire up after Triggers. Let’s trace a little further.

(gdb) c
Continuing.

Breakpoint 8, ExecutorFinish (queryDesc=0x5633195712e0) at execMain.c:405
405   if (ExecutorFinish_hook)
(gdb) bt
#0  ExecutorFinish (queryDesc=0x564977500190) at execMain.c:405
#1  0x0000564975c5b52c in PortalCleanup (portal=0x5649774a18d0) at portalcmds.c:300
#2  0x0000564976071ba4 in PortalDrop (portal=0x5649774a18d0, isTopCommit=false) at portalmem.c:499
#3  0x0000564975eb28d3 in exec_simple_query (
    query_string=0x564977439f00 "select serial_number, count(serial_number) from devicedata GROUP BY serial_number ORDER BY count DESC LIMIT 2;") at postgres.c:1225
#4  0x0000564975eb701c in PostgresMain (argc=1, argv=0x564977465a08, 
    dbname=0x5649774658d0 "carytest", username=0x5649774658b8 "cary") at postgres.c:4249
#5  0x0000564975e13a97 in BackendRun (port=0x56497745dfa0) at postmaster.c:4431
#6  0x0000564975e131ba in BackendStartup (port=0x56497745dfa0) at postmaster.c:4122
#7  0x0000564975e0f53e in ServerLoop () at postmaster.c:1704
#8  0x0000564975e0ecd4 in PostmasterMain (argc=3, argv=0x5649774344c0) at postmaster.c:1377
#9  0x0000564975d3210f in main (argc=3, argv=0x5649774344c0) at main.c:228

Continue tracing the ExecutorFinish to the end.

405   if (ExecutorFinish_hook)
(gdb) n
408     standard_ExecutorFinish(queryDesc);
(gdb) s
standard_ExecutorFinish (queryDesc=0x564977500190) at execMain.c:420
420   estate = queryDesc->estate;
(gdb) n
429   oldcontext = MemoryContextSwitchTo(estate->es_query_cxt);
(gdb) 
432   if (queryDesc->totaltime)
(gdb) 
436   ExecPostprocessPlan(estate);
(gdb) 
439   if (!(estate->es_top_eflags & EXEC_FLAG_SKIP_TRIGGERS))
(gdb) 
442   if (queryDesc->totaltime)
(gdb) 
445   MemoryContextSwitchTo(oldcontext);
(gdb) 
447   estate->es_finished = true;
(gdb) 
448 }
9.4 Executor End

This routing basically resets and releases some of the state variables in QueryDesc used during execution. ExecutorEnd is the last routine to be called and before entry, the PortalCleanup and PortalDrop are invoked first. So as we are in this routine the outer Portal object is also performing the cleanup process.

Breakpoint 9, ExecutorEnd (queryDesc=0x5633195712e0) at execMain.c:465
465   if (ExecutorEnd_hook)
(gdb) bt
#0  ExecutorEnd (queryDesc=0x564977500190) at execMain.c:465
#1  0x0000564975c5b538 in PortalCleanup (portal=0x5649774a18d0) at portalcmds.c:301
#2  0x0000564976071ba4 in PortalDrop (portal=0x5649774a18d0, isTopCommit=false) at portalmem.c:499
#3  0x0000564975eb28d3 in exec_simple_query (
    query_string=0x564977439f00 "select serial_number, count(serial_number) from devicedata GROUP BY serial_number ORDER BY count DESC LIMIT 2;") at postgres.c:1225
#4  0x0000564975eb701c in PostgresMain (argc=1, argv=0x564977465a08, 
    dbname=0x5649774658d0 "carytest", username=0x5649774658b8 "cary") at postgres.c:4249
#5  0x0000564975e13a97 in BackendRun (port=0x56497745dfa0) at postmaster.c:4431
#6  0x0000564975e131ba in BackendStartup (port=0x56497745dfa0) at postmaster.c:4122
#7  0x0000564975e0f53e in ServerLoop () at postmaster.c:1704
#8  0x0000564975e0ecd4 in PostmasterMain (argc=3, argv=0x5649774344c0) at postmaster.c:1377
#9  0x0000564975d3210f in main (argc=3, argv=0x5649774344c0) at main.c:228

(gdb) 

Let’s Continue tracing ExecutorEnd to the end.

465   if (ExecutorEnd_hook)
(gdb) n
468     standard_ExecutorEnd(queryDesc);
(gdb) s
standard_ExecutorEnd (queryDesc=0x564977500190) at execMain.c:480
480   estate = queryDesc->estate;
(gdb) n
495   oldcontext = MemoryContextSwitchTo(estate->es_query_cxt);
(gdb) 
497   ExecEndPlan(queryDesc->planstate, estate);
(gdb) 
500   UnregisterSnapshot(estate->es_snapshot);
(gdb) 
501   UnregisterSnapshot(estate->es_crosscheck_snapshot);
(gdb) 
506   MemoryContextSwitchTo(oldcontext);
(gdb) 
512   FreeExecutorState(estate);
(gdb) 
515   queryDesc->tupDesc = NULL;
(gdb) 
516   queryDesc->estate = NULL;
(gdb) 
517   queryDesc->planstate = NULL;
(gdb) 
518   queryDesc->totaltime = NULL;
(gdb) 
519 }

This routine marks the end of the query processing stages, the control will be passed back to exec_simple_query to finish the transaction and present result back to the client.

10.0 Presenting the Result Back to Client

With the transaction ended, the send_ready_for_query flag will be set, and the control is now able to enter ReadyForQuery to present the result to client.

(gdb) b ReadyForQuery
Breakpoint 10 at 0x56331899811d: file dest.c, line 251.
(gdb) c
Continuing.

Breakpoint 10, ReadyForQuery (dest=DestRemote) at dest.c:251
251 {
(gdb) bt
#0  ReadyForQuery (dest=DestRemote) at dest.c:251
#1  0x0000564975eb6eee in PostgresMain (argc=1, argv=0x564977465a08, 
    dbname=0x5649774658d0 "carytest", username=0x5649774658b8 "cary") at postgres.c:4176
#2  0x0000564975e13a97 in BackendRun (port=0x56497745dfa0) at postmaster.c:4431
#3  0x0000564975e131ba in BackendStartup (port=0x56497745dfa0) at postmaster.c:4122
#4  0x0000564975e0f53e in ServerLoop () at postmaster.c:1704
#5  0x0000564975e0ecd4 in PostmasterMain (argc=3, argv=0x5649774344c0) at postmaster.c:1377
#6  0x0000564975d3210f in main (argc=3, argv=0x5649774344c0) at main.c:228

(gdb) n
252   switch (dest)
(gdb) 
257       if (PG_PROTOCOL_MAJOR(FrontendProtocol) >= 3)
(gdb) 
261         pq_beginmessage(&buf, 'Z');
(gdb) 
262         pq_sendbyte(&buf, TransactionBlockStatusCode());
(gdb) 
263         pq_endmessage(&buf);
(gdb) p dest
$90 = DestRemote
(gdb)  n
268       pq_flush();
(gdb) 
269       break;
(gdb) 
282 }
(gdb) 

as pq_flush() is called, the result of the query will be returned back to the client at remote destination.

10.1 Client Results

Client will now see the output below as a result of the query

carytest=> select serial_number, count(serial_number) from devicedata GROUP BY serial_number ORDER BY count DESC LIMIT 2;
 serial_number | count 
---------------+-------
 X00002        |     8
 X00003        |     6
(2 rows)

11 Summary

So far, we have traced through severl stags of query processing. Namely

  • Parser
  • Analyzer
  • Rewritter
  • Planner
  • Executor

To summarize all the above, I have created a simple call hierarchy ( or a list of breakpoints) below that outlines the important core functions that will be called while stepping through the above stages. The ‘b’ in front of each function name corresponds to the break point command of gdb.

## Main Entry ##
b exec_simple_query

  ## Parser ##
  b pg_parse_query            -> returns (List* of Query)
    b raw_parser              -> returns (List* of Query)
      b base_yyparse          -> returns (List* of Query)

  ## Analzyer and Rewritter ##
  b pg_analyze_and_rewrite    -> returns (List*)
    b parse_analyze           -> returns (Query*)
    b pg_rewrite_query        -> returns (List* of Query)   
      b QueryRewrite          -> returns (List* of Query)   

  ## Planner ##
  b pg_plan_queries           -> returns (List* of plannedStmt)
    b pg_plan_query           -> returns (PlannedStmt*)
      b planner               -> returns (PlannedStmt*)

  ## Executor ##
  b PortalStart               -> returns void
    b ExecutorStart           -> returns void

  b PortalRun                 -> returns bool
    b PortalRunSelect         -> returns uint64 
      b ExecutorRun           -> returns void

  b PortalDrop                -> returns void
    b PortalCleanup           -> returns void
      b ExecutorFinish        -> returns void
      b ExecutorEnd           -> returns void

  ## Present Result ##
b ReadyForQuery               -> returns void
  b pq_flush                  -> returns void

A multi-disciplined software developer specialised in C/C++ Software development, network security, embedded software, firewall, and IT infrastructure

Hans-Juergen Schoenig: How PostgreSQL estimates parallel queries

$
0
0

Parallel queries were introduced back in PostgreSQL 9.6, and the feature has been extended ever since. In PostgreSQL 11 and PostgreSQL 12, even more functionality has been added to the database engine. However, there remain some questions related to parallel queries which often pop up during training and which definitely deserve some clarification.

Estimating the cost of a sequential scan

To show you how the process works, I have created a simple table containing just two columns:

test=# CREATE TABLE t_test AS
  SELECT id AS many, id % 2 AS few
  FROM generate_series(1, 10000000) AS id;
SELECT 10000000

test=# ANALYZE;
ANALYZE

The “many” column contains 10 million different entries. The “few” column will contain two different ones. However, for the sake of this example, all reasonably large tables will do.

The query we want to use to show how the PostgreSQL optimizer works is pretty simple:

test=# SET max_parallel_workers_per_gather TO 0;
SET
test=# explain SELECT count(*) FROM t_test;
                                 QUERY PLAN
------------------------------------------------------------------------
 Aggregate (cost=169248.60..169248.61 rows=1 width=8)
   -> Seq Scan on t_test (cost=0.00..144248.48 rows=10000048 width=0)
 (2 rows)

The default configuration will automatically make PostgreSQL go for a parallel sequential scan; we want to prevent it from doing that in order to make things easier to read.

Turning off parallel queries can be done by setting the max_parallel_workers_per_gather variable to 0. As you can see in the execution plan, the cost of the sequential scan is estimated to be 144.248. The cost of the total query is expected to be 169.248. But how does PostgreSQL come up with this number? Let’s take a look at the following listings:

test=# SELECT pg_relation_size('t_test') AS size,
              pg_relation_size('t_test') / 8192 AS blocks;
  size     | blocks 
-----------+--------
 362479616 | 44248
(1 row)

The t_test table is around 350 MB and consists of 44.248 blocks. Each block has to be read and processed sequentially. All rows in those blocks have to be counted to create the final results. The following formula will be used by the optimizer to estimate the costs:

test=# SELECT current_setting('seq_page_cost')::numeric * 44248
            + current_setting('cpu_tuple_cost')::numeric * 10000000
            + current_setting('cpu_operator_cost')::numeric * 10000000;

  ?column?
-------------
 169248.0000
(1 row)

As you can see, a couple of parameters are being used here: seq_page_cost tells the optimizer the cost of reading a block sequentially. On top of that, we have to account for the fact that all those rows have to travel through the CPU (cpu_tuple_cost) before they are finally counted. cpu_operator_cost is used because counting is basically the same as calling “+1” for every row. The total cost of the sequential scan is therefore 169.248 which is exactly what we see in the plan.

Estimating parallel sequential scans

The way PostgreSQL estimates sequential scans is often a bit obscure to peoplend during database training here at Cybertec many people ask about this topic. Let’s therefore take a look at the execution plan and see what happens:

test=# SET max_parallel_workers_per_gather TO default;
SET
test=# explain SELECT count(*) FROM t_test;
                                  QUERY PLAN
------------------------------------------------------------------------------------
 Finalize Aggregate (cost=97331.80..97331.81 rows=1 width=8)
 -> Gather (cost=97331.58..97331.79 rows=2 width=8)
    Workers Planned: 2
    -> Partial Aggregate (cost=96331.58..96331.59 rows=1 width=8)
       -> Parallel Seq Scan on t_test (cost=0.00..85914.87 rows=4166687 width=0)
(5 rows)

As you can see, PostgreSQL decided on using two CPU cores. But how did PostgreSQL
come up with this part? “rows=4166687”

The answer lies in the following formula:

10000048.0 / (2 + (1 – 0.3 * 2)) = 4166686.66 rows

10.000.048 rows is the number of rows PostgreSQL expects to be in the table (as
determined by ANALYZE before). The next thing is that PostgreSQL tries to
determine how much work has to be done by one core. But what does the formula
actually mean?

estimate = estimated_rows / (number_of_cores + (1 – leader_contribution * number_of_cores)

How-Postgres-estimates-parallel-queries

The leader process often spends quite some effort contributing to the result.
However, we assume that the leader spends around 30% of its time servicing the
worker processes. Therefore the contribution of the leader will go down as the
number of cores grows. If there are 4 or more cores at work, the leader will not
make a meaningful contribution to the scan anymore– so PostgreSQL will simply
calculate the size of the tables by the number of cores, instead of using the
formula just shown.

Other parallel operations

Other parallel operations will use similar divisors to estimate the amount of
effort needed for those operations. Bitmap scans and so on work the same way.
If you want to learn more about PostgreSQL and if you want to know how to speed
up CREATE INDEX, consider checking out our blog post.

The post How PostgreSQL estimates parallel queries appeared first on Cybertec.


Dimitri Fontaine: The Art of PostgreSQL: The Transcript, part I

$
0
0

This article is a transcript of the conference I gave at Postgres Open 2019, titled the same as the book: The Art of PostgreSQL. It’s availble as a video online at Youtube if you want to watch the slides and listen to it, and it even has a subtext!

Some people still prefer to read the text, so here it is.

Dimitri Fontaine: The Art of PostgreSQL: The Transcript, part II

$
0
0

This article is a transcript of the conference I gave at Postgres Open 2019, titled the same as the book: The Art of PostgreSQL. It’s availble as a video online at Youtube if you want to watch the slides and listen to it, and it even has a subtext!

Some people still prefer to read the text, so here it is. This text is the second part of the transcript of the video. The first part is available at The Art of PostgreSQL: The Transcript, part I .

Dimitri Fontaine: The Art of PostgreSQL: The Transcript, part III

$
0
0

This article is a transcript of the conference I gave at Postgres Open 2019, titled the same as the book: The Art of PostgreSQL. It’s availble as a video online at Youtube if you want to watch the slides and listen to it, and it even has a subtext!

Some people still prefer to read the text, so here it is. This text is the third part of the transcript of the video.

The first part is available at The Art of PostgreSQL: The Transcript, part I.

The second part is available at The Art of PostgreSQL: The Transcript, part II.

Dimitri Fontaine: Why Postgres?

$
0
0

Photo by Emily Morter unsplash-logoEmily Morter

That’s a very popular question to ask these days, it seems. The quick answer is easy and is the slogan of PostgreSQL, as seen on the community website for it: “PostgreSQL: The World’s Most Advanced Open Source Relational Database”. What does that mean for you, the developer?

In my recent article The Art of PostgreSQL: The Transcript, part I you will read why I think it’s interesting to use Postgres in your application’s stack. My conference talk addresses the main area where I think many people get it wrong:

Postgres is a RDBMS

RDBMS are not a storage solution

Do not use Postgres to solve a storage problem!

Ian Barwick: Replication configuration changes in PostgreSQL 12

$
0
0
Historically, PostgreSQL’s replication configuration has been managed via a configuration parameters stored in a dedicated configuration file, recovery.conf, which has been present in PostgreSQL since the introduction of archive recovery in PostgreSQL 8.0. One of the major changes in PostgreSQL 12, co-authored by 2ndQuadrant is the replacement of recovery.conf and the re-implementation of replication-specific parameters […]
Viewing all 9724 articles
Browse latest View live


<script src="https://jsc.adskeeper.com/r/s/rssing.com.1596347.js" async> </script>