Quantcast
Channel: Planet PostgreSQL
Viewing all 9673 articles
Browse latest View live

Jean-Jerome Schmidt: How to Secure your PostgreSQL Database - 10 Tips

$
0
0

Once you have finished the installation process of your PostgreSQL database server it is necessary to protect it before going into production. In this post, we will show you how to harden the security around your database to keep your data safe and secure.

1. Client Authentication Control

When installing PostgreSQL a file named pg_hba.conf is created in the database cluster's data directory. This file controls client authentication.

From the official postgresql documentation we can define the pg_hba.conf file as a set of records, one per line, where each record specifies a connection type, a client IP address range (if relevant for the connection type), a database name, a user name, and the authentication method to be used for connections matching these parameters.The first record with a matching connection type, client address, requested database, and user name is used to perform authentication.

So the general format will be something like this:

# TYPE  DATABASE        USER            ADDRESS                 METHOD

An example of configuration can be as follows:

# Allow any user from any host with IP address 192.168.93.x to connect
# to database "postgres" as the same user name that ident reports for
# the connection (typically the operating system user name).
#
# TYPE  DATABASE        USER            ADDRESS                 METHOD
 host     postgres              all             192.168.93.0/24         ident
# Reject any user from any host with IP address 192.168.94.x to connect
# to database "postgres
# TYPE  DATABASE        USER            ADDRESS                 METHOD
 host     postgres              all             192.168.94.0/24         reject

There are a lot of combinations you can make to refine the rules (the official documentation describes each option in detail and has some great examples), but remember to avoid rules that are too permissive, such as allowing access for lines using DATABASE all or ADDRESS 0.0.0.0/0.

For ensuring security, even if you are forgetting to add a rule, you can add the following row at the bottom:

# TYPE  DATABASE        USER            ADDRESS                 METHOD
 host     all              all             0.0.0.0/0         reject

As the file is read from top to bottom to find matching rules, in this way you ensure that for allowing permission you will need to explicitly add the matching rule above.

2. Server Configuration

There are some parameters on the postgresql.conf that we can modify to enhance security.

You can use the parameter listen_address to control which ips will be allowed to connect to the server. Here is a good practice to allow connections only from the known ips or your network, and avoid general values like “*”,”0.0.0.0:0” or “::”, which will tell PostgreSQL to accept connection from any IP.

Changing the port that postgresql will listen on (by default 5432) is also an option. You can do this by modifying the value of the port parameter.

Parameters such as work_mem, maintenance_work_mem, temp_buffer , max_prepared_transactions, temp_file_limit are important to keep in mind in case you have a denial of service attack. These are statement/session parameters that can be set at different levels (db, user, session), so managing these wisely can help us minimize the impact of the attack.

3. User and Role Management

The golden rule for security regarding user management is to grant users the minimum amount of access they need.

Managing this is not always easy and it can get really messy if not done well from the beginning.

A good way of keeping the privileges under control is to use the role, group, user strategy.

In postgresql everything is considered a role, but we are going to make some changes to this.

In this strategy you will create three different types or roles:

  • role role (identified by prefix r_)
  • group role (identified by prefix g_)
  • user role (generally personal or application names)

The roles (r_ roles) will be the ones having the privileges over the objects. The group roles ( g_ roles ) will be granted with the r_ roles , so they will be a collection of r_ roles. And finally, the user roles will be granted with one or more group roles and will be the ones with the login privilege.

Let's show an example of this. We will create a read only group for the example_schema and then grant it to a user:

We create the read only role and grant the object privileges to it

CREATE ROLE r_example_ro NOSUPERUSER INHERIT NOCREATEDB NOCREATEROLE NOREPLICATION;
GRANT USAGE ON SCHEMA example to r_example_ro;
GRANT SELECT ON ALL TABLES IN SCHEMA example to r_example_ro;
ALTER DEFAULT PRIVILEGES IN SCHEMA example GRANT SELECT ON TABLES TO r_example_ro;

We create the read only group and grant the role to that group

CREATE ROLE g_example_ro NOSUPERUSER INHERIT NOCREATEDB NOCREATEROLE NOREPLICATION';
GRANT r_example_ro to g_example_ro;

We create the app_user role and make it "join" the read only group

CREATE ROLE app_user WITH LOGIN ;
ALTER ROLE app_user WITH PASSWORD 'somePassword' ;
ALTER ROLE app_user VALID UNTIL 'infinity' ;
GRANT g_example_ro TO app_user;

Using this method you can manage the granularity of the privileges and you can easily grant and revoke groups of access to the users. Remember to only grant object privileges to the roles instead of doing it directly for the users and to grant the login privilege only to the users.

This is a good practice to explicitly revoke public privileges on the objects, like revoke the public access to a specific database and only grant it through a role.

REVOKE CONNECT ON my_database FROM PUBLIC;
GRANT CONNECT ON my_database TO r_example_ro;

Restrict SUPERUSER access, allow superuser connections only from localhost/unix domain.

Use specific users for different purposes, like specific app users or backup users, and limit the connections for that user only from the required ips.

4. Super User Management

Maintaining a strong password policy is a must for keeping your databases safe and avoid the passwords hacks. For a strong policy use preferentially special characters, numbers, uppercase and lowercase characters and have at least 10 characters.

There are also external authentication tools, like LDAP or PAM, that can help you ensure your password expiration and reuse policy, and also handle account locking on authentication errors.

5. Data Encryption (on connection ssl)

PostgreSQL has native support for using SSL connections to encrypt client/server communications for increased security. SSL (Secure Sockets Layer) is the standard security technology for establishing an encrypted link between a web server and a browser. This link ensures that all data passed between the web server and browsers remain private and integral.

As postgresql clients sends queries in plain-text and data is also sent unencrypted, it is vulnerable to network spoofing.

You can enable SSL by setting the ssl parameter to on in postgresql.conf.

The server will listen for both normal and SSL connections on the same TCP port, and will negotiate with any connecting client on whether to use SSL. By default, this is at the client's option, but you have the option to setup the server to require use of SSL for some or all connections using the pg_hba config file described above.

6. Data Encryption at Rest (pg_crypto)

There are two basic kinds of encryption, one way and two way. In one way you don't ever care about decrypting the data into readable form, but you just want to verify the user knows what the underlying secret text is. This is normally used for passwords. In two way encryption, you want the ability to encrypt data as well as allow authorized users to decrypt it into a meaningful form. Data such as credit cards and SSNs would fall in this category.

For one way encryption, the crypt function packaged in pgcrypto provides an added level of security above the md5 way. The reason is that with md5, you can tell who has the same password because there is no salt (In cryptography, a salt is random data that is used as an additional input to a one-way function that "hashes" data, a password or passphrase), so all people with the same password will have the same encoded md5 string. With crypt, they will be different.

For data that you care about retrieving, you don't want to know if the two pieces of information are the same, but you don't know that information, and you want only authorized users to be able to retrieve it. Pgcrypto provides several ways of accomplishing this, so for further reading on how to use it you can check the oficial postgresql documentation on https://www.postgresql.org/docs/current/static/pgcrypto.html.

7. Logging

Postgresql provides a wide variety of config parameters for controlling what, when, and where to log.

You can enable session connection/disconnections, long running queries, temp file sizes and so on. This can help you get a better knowledge of your workload in order to identify odd behaviours. You can get all the options for logging on the following link https://www.postgresql.org/docs/9.6/static/runtime-config-logging.html

For more detailed information on your workload, you can enable the pg_stat_statements module, that provides a means for tracking execution statistics of all SQL statements executed by a server. There are some security tools that can ingest the data from this table and will generate an sql whitelist, in order to help you identify queries not following the expected patterns.

For more information https://www.postgresql.org/docs/9.6/static/pgstatstatements.html.

ClusterControl
Single Console for Your Entire Database Infrastructure
Find out what else is new in ClusterControl

8. Auditing

The PostgreSQL Audit Extension (pgAudit) provides detailed session and/or object audit logging via the standard PostgreSQL logging facility.

Basic statement logging can be provided by the standard logging facility with log_statement = all. This is acceptable for monitoring and other usages but does not provide the level of detail generally required for an audit. It is not enough to have a list of all the operations performed against the database. It must also be possible to find particular statements that are of interest to an auditor. The standard logging facility shows what the user requested, while pgAudit focuses on the details of what happened while the database was satisfying the request.

9. Patching

Check PostgreSQL's security information page regularly and frequently for critical security updates and patches.

Keep in mind that OS or libraries security bugs can also lead to a database leak, so ensure you keeping the patching for these up to date.

ClusterControl provides an operational report that gives you this information and will execute the patches and upgrades for you.

10. Know Your Workload (pg_stats_statement)

In addition to the SQL-standard privilege system available through GRANT, tables can have row security policies that restrict, on a per-user basis, which rows can be returned by normal queries or inserted, updated, or deleted by data modification commands. This feature is also known as Row-Level Security.

When row security is enabled on a table all normal access to the table for selecting rows or modifying rows must be allowed by a row security policy.

Here is a simple example how to create a policy on the account relation to allow only members of the managers role to access rows, and only rows of their accounts:

CREATE TABLE accounts (manager text, company text, contact_email text);
ALTER TABLE accounts ENABLE ROW LEVEL SECURITY;
CREATE POLICY account_managers ON accounts TO managers USING (manager = current_user);

You can get more information on this feature on the oficial postgresql documentation https://www.postgresql.org/docs/9.6/static/ddl-rowsecurity.html

If you would like to learn more, here are some resources that can help you to better strengthen your database security…

Conclusion

If you follow the tips above your server will be safer, but this does not mean that it will be unbreakable.

For your own security we recommend that you use a security test tool like Nessus, to know what your main vulnerabilities are and try to solve them.

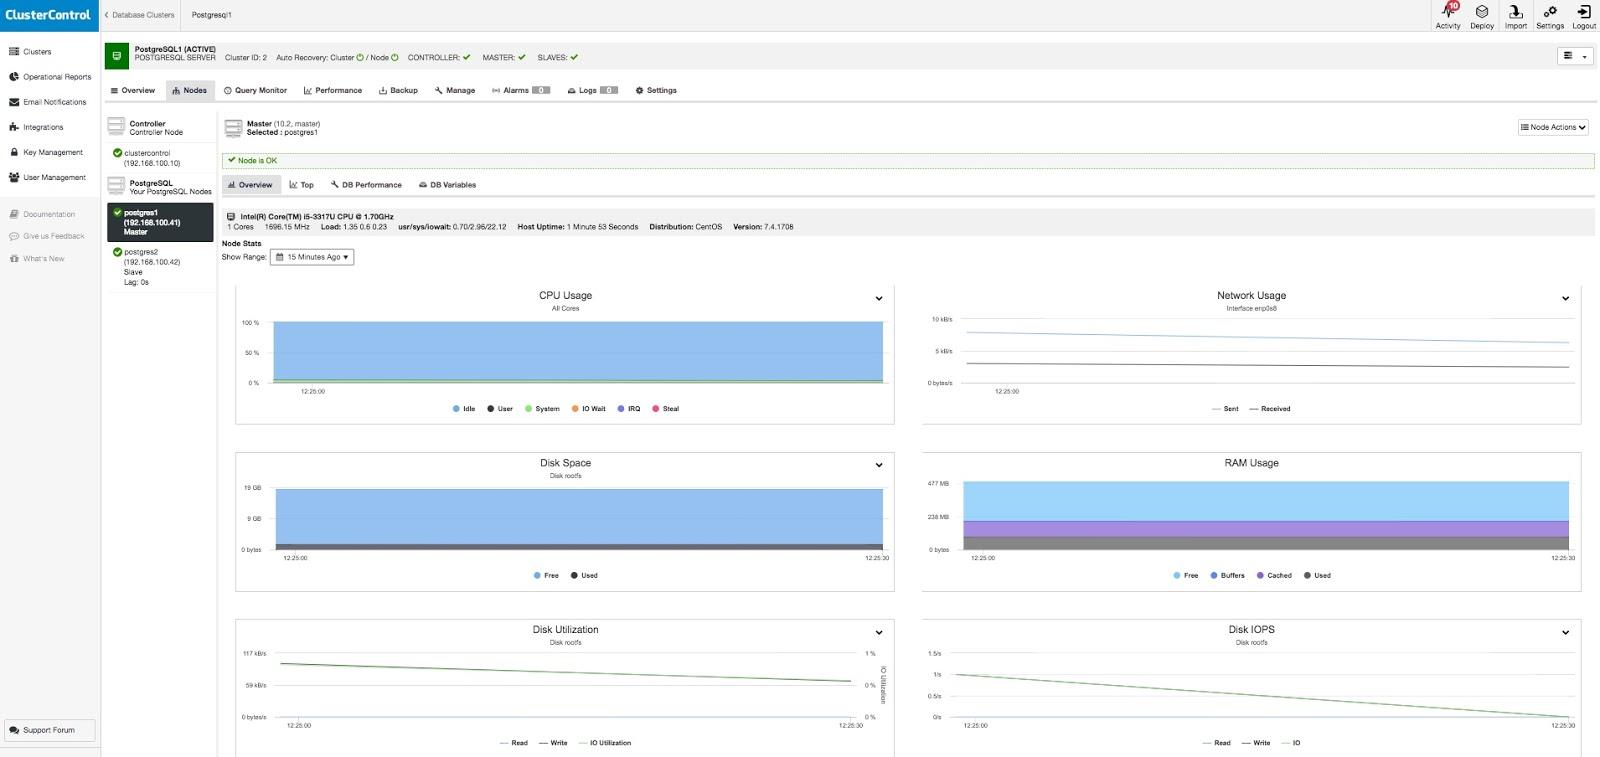
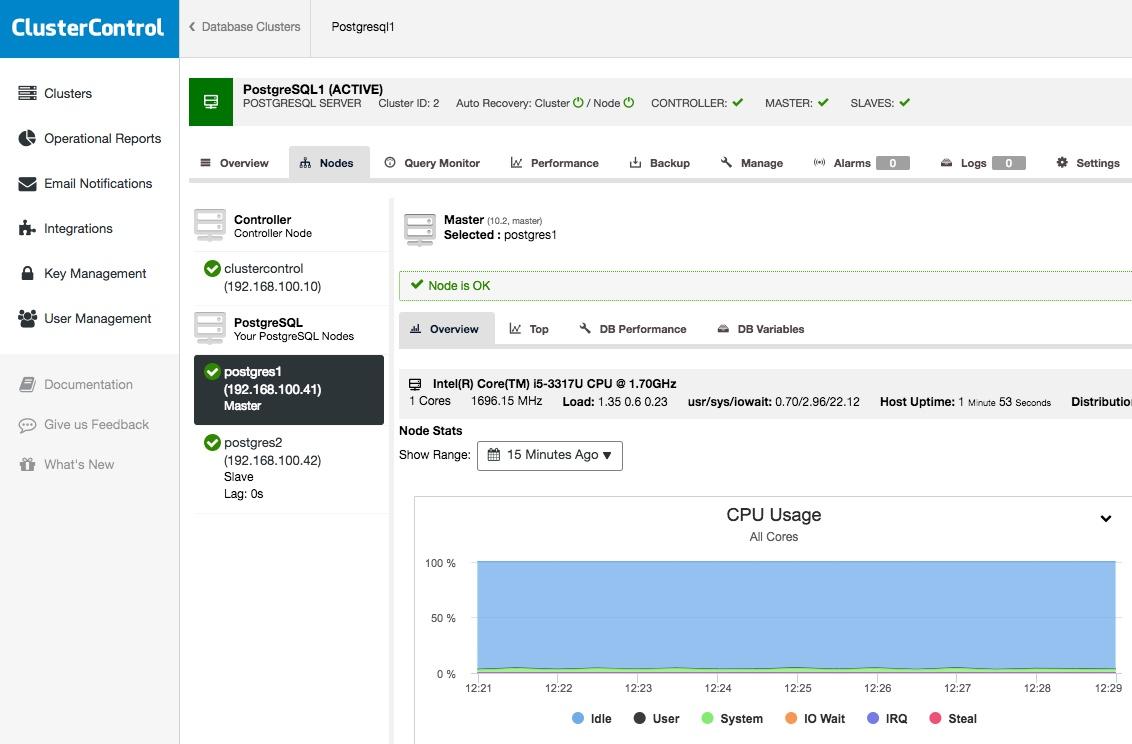
You can also monitor your database with ClusterControl. With this you can see in real time what's happening inside your database and analyze it.


Vasilis Ventirozos: Postgres10 in RDS, first impressions

$
0
0
As a firm believer of Postgres, and someone who runs Postgres 10 in production and runs RDS in production, I've been waiting for Postgres 10 on RDS to be announced ever since the release last fall. Well, today was not that day, but I was surprised to see that RDS is now sporting a "postgres10" instance you can spin up. I'm not sure if thats there on purpose, but you can be sure I jumped at the chance to get a first look at what the new Postgres 10 RDS world might look like; here is what I found..

The first thing that i wanted to test was logical replication. By default it was disabled with rds.logical_replication being set to 0. AWS console allowed me to change this, which also changed wal_level to logical so i started creating a simple table to replicate. I created a publication that included my table but thats where the party stopped. I can't create a role with replication privilege and i can't grant replication to any user :

mydb=> SELECT SESSION_USER, CURRENT_USER;
 session_user | current_user
--------------+---------------
 testuser      | rds_superuser
(1 row)

Time: 143.554 ms
omniti=> alter role testuser with replication;
ERROR:  must be superuser to alter replication users
Time: 163.823 ms

On top of that, create subscription requires superuser. Basically logical replication is there but i don't see how anyone could actually use it. It's well known that RDS replicas can't exist outside RDS. I was hoping that postgres 10 and logical replication would add more flexibility on replicating methods. I don't think this will change anytime soon but maybe they will add functionality in console menus that will control logical replication in their own terms using their rdsadmin user, who knows..

Next thing i wanted to check was parallelism. Remember how I said we run Postgres 10 in production? One thing we found is that there are significant bugs around parallel query, and the only safe way to work around them at this point is to disable.
I was surprised to not only see it enabled, but in fact they are only running 10.1, which does not include a bunch of fixes that we need in our prod instances (not to mention upcoming fixes in 10.3). Presumably they will fix this once it becomes officially released, hopefully on 10.3. For now, please be nice and don't crash their servers just because you can.

I tried a bunch of other features and it sure looked like Postgres 10. The new partitioning syntax is there and it works, as well as scram-sha-256 . Obviously this is super new and they still have work to do, but I'm really excited about the chance to get a sneak peek and looking forward to seeing this get an official release date, maybe at pgconfus later this year?

Thanks for reading
Vasilis Ventirozos

Joshua Drake: People, Postgres, Data

$
0
0

People, Postgres, Data is not just an advocacy term. It is the mission of PostgresConf.Org. It is our rule of thumb, our mantra, and our purpose. When we determine which presentations to approve, which workshops to support, which individuals to receive scholarships, which events to organize, and any task big or small, it must follow: People, Postgres, Data. It is our belief that this mantra allows us to maintain our growth and continue to advocate for the Postgres community and ecosystem in a positive and productive way.

When you attend PostgresConf the first thing you will notice is the diversity of the supported ecosystem; whether you want to discuss the finer points of contribution with the major PostgreSQL.Org sponsors such as 2ndQuadrant or EnterpriseDB, or you want to embrace the Postgres ecosystem with the Greenplum Summit or TimeScaleDB.

The following is a small sampling of content that will be presented April 16 - 20 at the Westin Jersey City Newport:

Learn to Administer Postgres with this comprehensive training opportunity:

Understand the risks of securing your data during this Regulated Industry Summit presentation:

Struggle with time management? We have professional development training such as:

Educate yourself on how to contribute back to the PostgreSQL community:

We are a community driven and volunteer organized ecosystem conference. We want to help the community become stronger, increase education about Postgres, and offer career opportunities and knowledge about the entire ecosystem. Please join us in April!

Stefan Fercot: Custom PGDATA with systemd

$
0
0

By default, on CentOS 7, the PostgreSQL v10 data directory is located in /var/lib/pgsql/10/data.

Here’s a simple trick to easily place it somewhere else without using symbolic links.


First of all, install PostgreSQL 10:

# yum install -y https://download.postgresql.org/pub/repos/yum/10/redhat/rhel-7-x86_64/pgdg-centos10-10-2.noarch.rpm# yum install -y postgresql10-server

If you wish to place your data in (e.g.) /pgdata/10/data, create the directory with the good rights:

# mkdir -p /pgdata/10/data# chown -R postgres:postgres /pgdata

Then, customize the systemd service:

# cat <<EOF > /etc/systemd/system/postgresql-10.service
.include /lib/systemd/system/postgresql-10.service

[Service]
Environment=PGDATA=/pgdata/10/data
EOF

Reload systemd:

# systemctl daemon-reload

Initialize the PostgreSQL data directory:

# /usr/pgsql-10/bin/postgresql-10-setup initdb

Start and enable the service:

# systemctl enable postgresql-10# systemctl start postgresql-10

And Voila! It’s just that simple.

Jean-Jerome Schmidt: Setting Up an Optimal Environment for PostgreSQL

$
0
0

Welcome to PostgreSQL, a powerful open source database system that can host anything from a few megabytes of customer data for a small-town-business, to hundreds of terabytes of ‘big data’ for multinational corporations. Regardless of the application, it’s likely that some setup and configuration help will be needed to get the database ready for action.

When a new server is installed, PostgreSQL’ s settings are very minimum as they are designed to run on the least amount of hardware possible. However they are very rarely optimal. Here, we will go over a basic setup for new projects, and how to set PostgreSQL up to run the most optimally on new projects.

Hosting

On-Premise Hosting

With an on-premise database, the best option is for a bare metal host, as Virtual Machines generally perform slower unless we’re talking about high end enterprise level VM’s. This also allows for tighter control over CPU, Memory, and Disk setups. This however comes with the need to have an expert on hand (or contract) to do server maintenance.

Cloud

Hosting a database in the cloud can be wonderful in some aspects, or a nightmare in others. Unless the cloud platform chosen is highly optimized (which generally means higher price), it may have trouble with higher load environments. Keep an eye out for whether or not the cloud server is shared or dedicated (dedicated allowing full performance from the server for the application), as well as the level of IOPS (Input/output Operations Per Second) provided by a cloud server. When (or if) the application grows to the point that the majority of data cannot be stored in memory, disk access speed is crucial.

General Host Setup

The main pillars needed to reliably set up PostgreSQL are based on the CPU, Memory, and Disk abilities of the host. Depending on the applications needs, a sufficient host as well as a well-tuned PostgreSQL configuration will have an amazing impact on the performance of the database system.

Choosing an Operating System

PostgreSQL can be compiled on most Unix-like operating systems, as well as Windows. However performance on Windows is not even comparable to a Unix-like system, so unless it’s for a small throw away project, sticking to an established Unix-like system will be the way to go. For this discussion, we’ll stick to Linux based systems.

The seemingly highest used Linux distribution used for hosting PostgreSQL is a Red Hat based system, such as CentOS or Scientific Linux, or even Red Hat itself. Since Red Hat and CentOS focus on stability and performance, the community behind these projects work hard to make sure important applications, such as databases, are on the most secure and most reliable build of Linux possible.

NOTE: Linux has a range of kernel versions that are not optimal for running PostgreSQL, so they are highly suggested to be avoided if possible (especially on applications where peak performance is the utmost importance). Benchmarks have shown that the number of transactions per second drop from kernel version 3.4 – 3.10, but recovers and significantly improves in kernel 3.12. This unfortunately rules out using CentOS 7 if going the CentOS route. CentOS 6 is still a valid and supported version of the Operating System, and CentOS 8 is expected to be released before 6 becomes unsupported.

Installation

Installation can be done either by source, or using repositories maintained by either the distribution of Linux chosen, or better yet, the PostgreSQL Global Development Group (PGDG), which maintains repositories for Red Hat based systems (Red Hat, Scientific Linux, CentOS, Amazon Linux AMI, Oracle Enterprise Linux, and Fedora), as well as packages for Debian and Ubuntu. Using the PGDG packages will ensure updates to PostgreSQL are available for update upon release, rather than waiting for the Linux distribution’s built in repositories to approve and provide them.

CPU

These days, it’s not hard to have multiple cores available for a database host. PostgreSQL itself has only recently started adding multi-threading capabilities on the query level, and will be getting much better in the years to come. But even without these new and upcoming improvements, PostgreSQL itself spawns new threads for each connection to the database by a client. These threads will essentially use a core when active, so number of cores required will depend on the level of needed concurrent connections and concurrent queries.

A good baseline to start out with is a 4 core system for a small application. Assuming applications do a dance between executing queries and sleeping, a 4 core system can handle a couple dozen connections before being overloaded. Adding more cores will help scale with an increasing workload. It’s not uncommon for very large PostgreSQL databases to have 48+ cores to serve many hundreds of connections.

Tuning Tips: Even if hyper-threading is available, transactions per second are generally higher when hyper-threading is disabled. For database queries that aren’t too complex, but higher in frequency, more cores is more important than faster cores.

Memory

Memory is an extremely important aspect for PostgreSQL’s overall performance. The main setting for PostgreSQL in terms of memory is shared_buffers, which is a chunk of memory allocated directly to the PostgreSQL server for data caching. The higher the likelihood of the needed data is living in memory, the quicker queries return, and quicker queries mean a more efficient CPU core setup as discussed in the previous section.

Queries also, at times, need memory to perform sorting operations on data before it’s returned to the client. This either uses additional ad-hoc memory (separate from shared_buffers), or temporary files on disk, which is much slower.

Tuning Tips: A basic starting point for setting shared_buffers is to set it to 1/4th the value of available system ram. This allows the operating system to also do its own caching of data, as well as any running processes other than the database itself.

Increasing work_mem can speed up sorting operations, however increasing it too much can force the host to run out of memory all together, as the value set can be partially or fully issued multiple times per query. If multiple queries request multiple blocks of memory for sorting, it can quickly add up to more memory than what is available on the host. Keep it low, and raise it slowly until performance is where desired.

Using the ‘free’ command (such as ‘free -h’), set effective_cache_size to a the sum of memory that’s free and cached. This lets the query planner know the level of OS caching may be available, and run better query plans.

Disk

Disk performance can be one of the more important things to consider when setting up a system. Input / Output speeds are important for large data loads, or fetching huge amounts of data to be processed. It also determines how quickly PostgreSQL can sync memory with disk to keep the memory pool optimal.

Some preparation in disks can help instantly improve potential performance, as well as future proof the database system for growth.

  • Separate disks

    A fresh install of PostgreSQL will create the cluster’s data directory somewhere on the main (and possibly only) available drive on the system.

    A basic setup using more drives would be adding a separate drive (or set of drives via RAID). It has the benefit of having all database related data transfer operating on a different I/O channel from the main operating system. It also allows the database to grow without fear of insufficient space causing issues and errors elsewhere in the operating system.

    For databases with an extreme amount of activity, the PostgreSQL Transaction Log (xlog) directory can be placed on yet another drive, separating more heavy I/O to another channel away from the main OS as well as the main data directory. This is an advanced measure that helps squeeze more performance out of a system, that may otherwise be near its limits.

  • Using RAID

    Setting up RAID for the database drives not only protects from data loss, it can also improve performance if using the right RAID configuration. RAID 1 or 10 are generally thought to be the best, and 10 offers parity and overall speed. RAID 5, however, while having higher levels of redundancy, suffers from significant performance decrease due to the way it spreads data around multiple disks. Plan out the best available option with plenty of space for data growth, and this will be a configuration that won’t need to be changed often, if at all.

  • Using SSD

    Solid State Drives are wonderful for performance, and if they meet the budget, enterprise SSD’s can make heavy data processing workloads night and day faster. Smaller to medium databases with smaller to medium workloads may be overkill, but when fighting for the smallest percentage increase on large applications, SSD can be that silver bullet.

Tuning Tips: Chose a drive setup that is best for the application at hand, and has plenty of space to grow with time as the data increases.

If using a SSD, setting random_page_cost to 1.5 or 2 (the default is 4) will be beneficial to the query planner, since random data fetching is much quicker than seen on spinning disks.

Initial Configuration Settings

When setting up PostgreSQL for the first time, there’s a handful of configuration settings that can be easily changed based on the power of the host. As the application queries the database over time, specific tuning can be done based on the application’s needs. However that will be the topic for a separate tuning blog.

Memory Settings

shared_buffers: Set to 1/4th of the system memory. If the system has less than 1 GB of total memory, set to ~ 1/8th of total system memory

work_mem: The default is 4MB, and may even be plenty for the application in question. But if temp files are being created often, and those files are fairly small (tens of megabytes), it might be worth upping this setting. A conservative entry level setting can be (1/4th system memory / max_connections). This setting depends highly on the actual behavior and frequency of queries to the database, so should be only increased with caution. Be ready to reduce it back to previous levels if issues occur.

effective_cache_size: Set to the sum of memory that’s free and cached reported by the ‘free’ command.

Checkpoint Settings

For PostgreSQL 9.4 and below:
checkpoint_segments: A number of checkpoint segments (16 megabytes each) to give the Write Ahead Log system. The default is 3, and can safely be increased to 64 for even small databases.

For PostgreSQL 9.5 and above:
max_wal_size: This replaced checkpoint_segments as a setting. The default is 1GB, and can remain here until needing further changes.

Security

listen_address: This setting determines what personal IP addresses / Network Cards to listen to connections on. In a simple setup, there will likely be only one, while more advanced networks may have multiple cards to connect to multiple networks. * Signifies listen to everything. However, if the application accessing the database is to live on the same host as the database itself, keeping it as ‘localhost’ is sufficient.

Logging

Some basic logging settings that won’t overload the logs are as follows.

log_checkpoints = on
log_connections = on
log_disconnections = on
log_temp_files = 0

Vasilis Ventirozos: Implementing a "distributed" reporting server using some of postgres10 features.

$
0
0
Today i will try to show how strong Postgres 10 is by combining different features in order to create a "distributed" reporting server. The features that i will be using are :
  • Logical Replication
  • Partitioning
  • Foreign Data Wrappers
  • Table Inheritance 
The scenario that we want to implement is the following : 
We have one central point for inserts, that we will call Bucket, bucket is partitioned by range yearly.In my example we have 3 partitions for 2016, 2017, 2018 and each partition is logically replicated to 3 data nodes, each responsible for 1 year of data. Finally we have a reporting proxy that is responsible for all selects and connects to each node through foreign data wrappers.
The setup consists in 5 docker containers that have the following roles.
  • 10.0.0.2, bucket, insert / update / delete
  • 10.0.0.3, node2016, data holder for 2016
  • 10.0.0.4, node2017, data holder for 2017
  • 10.0.0.5, node2018, data holder for 2018
  • 10.0.0.6, reporting proxy, main point for selects 


Now lets start with the bucket :


CREATETABLEdata_bucket(
idint,
datatext,
insert_timetimestampwithouttimezoneDEFAULTnow())
PARTITIONBYRANGE(insert_time);

CREATETABLEdata_p2016PARTITIONOFdata_bucket
FORVALUESFROM('2016-01-01 00:00:00')TO('2017-01-01 00:00:00');
CREATETABLEdata_p2017PARTITIONOFdata_bucket
FORVALUESFROM('2017-01-01 00:00:00')TO('2018-01-01 00:00:00');
CREATETABLEdata_p2018PARTITIONOFdata_bucket
FORVALUESFROM('2018-01-01 00:00:00')TO('2019-01-01 00:00:00');

createuniqueindexdata_p2016_uniqondata_p2016(id);
createuniqueindexdata_p2017_uniqondata_p2017(id);
createuniqueindexdata_p2018_uniqondata_p2018(id);

createindexdata_p2016_timeondata_p2016(insert_time);
createindexdata_p2017_timeondata_p2017(insert_time);
createindexdata_p2018_timeondata_p2018(insert_time);

CREATEPUBLICATIONpub_data_p2016FORTABLEdata_p2016
WITH(publish='insert,update');
CREATEPUBLICATIONpub_data_p2017FORTABLEdata_p2017
WITH(publish='insert,update');
CREATEPUBLICATIONpub_data_p2018FORTABLEdata_p2018
WITH(publish='insert,update');

Here we created a data bucket table that we will insert into, its yearly partitions, some indexes for uniqueness and for searching dates, indexes are optional, more about that later on. Last we created 3 publications that we will use in our next step. Notice that we only replicate inserts and updates not deletes. Just keep that in mind for later.

Next step is setting up the data nodes. On each container (node2016, node2017 and node2018) run the following SQL :


-- node 2016
CREATETABLEdata_p2016(
idint,
datatext,
insert_timetimestampwithouttimezone);

createuniqueindexdata_p2016_uniqondata_p2016(id);
createindexdata_p2016_timeondata_p2016(insert_time);

CREATESUBSCRIPTIONsub_data_p2016 
  CONNECTION'dbname=monkey host=10.0.0.2 user=postgres port=5432'
PUBLICATIONpub_data_p2016;

-- node 2017

CREATETABLEdata_p2017(
idint,
datatext,
insert_timetimestampwithouttimezone);

createuniqueindexdata_p2017_uniqondata_p2017(id);
createindexdata_p2017_timeondata_p2017(insert_time);

CREATESUBSCRIPTIONsub_data_p2017 
  CONNECTION'dbname=monkey host=10.0.0.2 user=postgres port=5432'
PUBLICATIONpub_data_p2017;

-- node 2018

CREATETABLEdata_p2018(
idint,
datatext,
insert_timetimestampwithouttimezone);

createuniqueindexdata_p2018_uniqondata_p2017(id);
createindexdata_p2018_timeondata_p2017(insert_time);

CREATESUBSCRIPTIONsub_data_p2018 
  CONNECTION'dbname=monkey host=10.0.0.2 user=postgres port=5432'
PUBLICATIONpub_data_p2018;

Here, for each node we create the data table, indexes and a subscription pointing to the bucket server.

Right now every row that gets into the bucket is being transferred to the appropriate node. One last thing is missing, putting everything together. For aggregating all nodes we have the reporting proxy container. In this server we need to run the following SQL statements :


createextensionifnotexistspostgres_fdw;

CREATESERVERdata_node_2016
FOREIGNDATAWRAPPERpostgres_fdw
OPTIONS(host'10.0.0.3',port'5432',dbname'monkey');
CREATESERVERdata_node_2017
FOREIGNDATAWRAPPERpostgres_fdw
OPTIONS(host'10.0.0.4',port'5432',dbname'monkey');
CREATESERVERdata_node_2018
FOREIGNDATAWRAPPERpostgres_fdw
OPTIONS(host'10.0.0.5',port'5432',dbname'monkey');

CREATEUSERMAPPINGFORpostgresSERVERdata_node_2016OPTIONS(user'postgres');
CREATEUSERMAPPINGFORpostgresSERVERdata_node_2017OPTIONS(user'postgres');
CREATEUSERMAPPINGFORpostgresSERVERdata_node_2018OPTIONS(user'postgres');

CREATETABLEreporting_table(
idint,
datatext, 
insert_timetimestampwithouttimezone);

CREATEFOREIGNTABLEdata_node_2016(
CHECK(insert_time>=DATE'2016-01-01'ANDinsert_time<DATE'2017-01-01'))
INHERITS(reporting_table)SERVERdata_node_2016
options(table_name'data_p2016');
CREATEFOREIGNTABLEdata_node_2017(
CHECK(insert_time>=DATE'2017-01-01'ANDinsert_time<DATE'2018-01-01'))
INHERITS(reporting_table)SERVERdata_node_2017options(table_name'data_p2017');
CREATEFOREIGNTABLEdata_node_2018(
CHECK(insert_time>=DATE'2018-01-01'ANDinsert_time<DATE'2019-01-01'))
INHERITS(reporting_table)SERVERdata_node_2018options(table_name'data_p2018');

We first create the Postgres foreign data wrapper extension , create remote servers and user mappings for each data node, then create the main reporting table and finally we create three foreign tables, one for each node using table inheritance.
The structure is ready, everything is now connected and we should be good for testing. But before we test this let's describe what to expect. By inserting into data_bucket data should be replicated into yearly partitions, these partitions will be replicated to their data nodes and the reporting proxy should aggregate all nodes by using foreign scans. 
Let's insert some randomly generated data by inserting into the data_bucket:


insertintodata_bucket
selectgenerate_series(1,1000000),
md5(random()::text),
timestamp'2016-01-01 00:00:00'+random()*
(timestamp'2019-01-01 00:00:00'-timestamp'2016-01-01 00:00:00');

Data should be distributed into all three nodes. Now from reporting_table we created in the reporting proxy we should be able to see everything, notice the explain plans :


monkey=#selectcount(*)fromreporting_table;
count
---------
1000000
(1row)

monkey=#selectmin(insert_time),max(insert_time)fromreporting_table;
min|max
----------------------------+----------------------------
2016-01-0100:03:17.062862|2018-12-3123:59:39.671967
(1row)

monkey=#explainanalyzeselectmin(insert_time),max(insert_time)fromreporting_table;
QUERYPLAN
--------------------------------------------------------------------------------------------------------------------------------------
Aggregate(cost=598.80..598.81rows=1width=16)(actualtime=1708.333..1708.334rows=1loops=1)
->Append(cost=0.00..560.40rows=7681width=8)(actualtime=0.466..1653.186rows=1000000loops=1)
->SeqScanonreporting_table(cost=0.00..0.00rows=1width=8)(actualtime=0.002..0.002rows=0loops=1)
->ForeignScanondata_node_2016(cost=100.00..186.80rows=2560width=8)(actualtime=0.464..544.597rows=334088loops=1)
->ForeignScanondata_node_2017(cost=100.00..186.80rows=2560width=8)(actualtime=0.334..533.149rows=332875loops=1)
->ForeignScanondata_node_2018(cost=100.00..186.80rows=2560width=8)(actualtime=0.323..534.776rows=333037loops=1)
Planningtime:0.220ms
Executiontime:1709.252ms
(8rows)

monkey=#select*fromreporting_tablewhereinsert_time='2016-06-21 17:59:44';
id|data|insert_time
----+------+-------------
(0rows)

monkey=#select*fromreporting_tablewhereinsert_time='2016-06-21 17:59:44.154904';
id|data|insert_time
-----+----------------------------------+----------------------------
150|27da6c5606ea26d4ca51c6b642547d44|2016-06-2117:59:44.154904
(1row)

monkey=#explainanalyzeselect*fromreporting_tablewhereinsert_time='2016-06-21 17:59:44.154904';
QUERYPLAN
-----------------------------------------------------------------------------------------------------------------------
Append(cost=0.00..125.17rows=7width=44)(actualtime=0.383..0.384rows=1loops=1)
->SeqScanonreporting_table(cost=0.00..0.00rows=1width=44)(actualtime=0.002..0.002rows=0loops=1)
Filter:(insert_time='2016-06-21 17:59:44.154904'::timestampwithouttimezone)
->ForeignScanondata_node_2016(cost=100.00..125.17rows=6width=44)(actualtime=0.381..0.381rows=1loops=1)
Planningtime:0.172ms
Executiontime:0.801ms
(6rows)

Some might say that ok, but we have all the data in 2 places, which is true.. but do we actually need data in the bucket? Answer is no, we don't , we only need them in case we need to update. Remember that we set logical replication to only replicate insert and updates? This means that we can delete whatever we want from either the bucket or its partitions, so we can have any custom data retention, we can even truncate them if we want to remove data fast.
Now, is this solution perfect ? No, it's not, foreign data wrappers are obviously slower and they can't perform all operations but with each Postgres version they are getting better.


Thanks for reading.
-- Vasilis Ventirozos

Pavel Stehule: pspg pager is available from Debian testing packages

Jonathan Katz: Demystifying Schemas & search_path through Examples

$
0
0

On March 1, 2018, the PostgreSQL community released version 10.3 and other supported versions of PostgreSQL.  The release centered around a disclosed security vulnerability designated CVE-2018-1058, which is related to how a user can accidentally or maliciously "create like-named objects in different schemas that can change the behavior of other users' queries."

The PostgreSQL community released a guide around what exactly CVE-2018-1058 is and how to protect your databases. However, we thought it would also be helpful to look into what schemas are in PostgreSQL, how they are used under normal operations, and how to investigate your schemas to look for and eliminate suspicious functions.


Federico Campoli: Checkpoints and wals, fantastic beasts (and where to find them)

$
0
0
Back in the days of when I was an Oracle DBA I had to solve a strange behaviour on an Oracle installation. The system for some reasons stopped accepting the writes occasionally and without an apparent reason. This behaviour appeared odd to anybody except for my team, which addressed the issue immediately. The problem was caused by a not optimal configuration on the Oracle instance. This thought led me to writing this post.

Jobin Augustine: Where Postgres Wins

$
0
0

Where Postgres Wins

PgConf India 2018 was an eye-opener both for me and my team. As testimonials to the growing popularity of Postgres, we witnessed and heard from many companies about their migration from proprietary databases, especially from Oracle, to Postgres. So it comes as no surprise why Postgres won the DB-Engines DBMS of the year 2017 award.

When a community grows, newbies expect more introductory contents and talks about the power of Postgres from Postgres experts. Unfortunately, the experts mainly concentrate on fairly advanced topics, and most of the content is delivered towards DBAs and System Administrators rather than regular users and application developers. Understanding some of the key benefits and differences is important. So I thought of blogging about some of the key features of Postgres, which gives users edge over other database systems or at par with the so-called ‘best’ in the Industry.

ACID compliant transaction capabilities for DDLs

Most of the database systems claim that they support a fully compliant ACID transaction. However, in many databases, including Oracle, this transaction capability is limited to DMLs only. The moment a DDL is executed, the transaction breaks.

In the following example, Oracle fails to rollback DDL statement

SQL> alter table t1 add id2 int;  
Table altered.

SQL> desc t1;
 Name                    Null?    Type
 ------------------- --------  ---------------
 ID                               NUMBER(38)
 ID2                              NUMBER(38)

SQL> rollback;
Rollback complete.

SQL> desc t1;
 Name                      Null?    Type
 ------------------- -------- ----------------------
 ID                                NUMBER(38)
 ID2                               NUMBER(38)

As we cab see above, even though it claims that “Rollback completed”, the DDL change is commited

To make things worse, there is no proper isolation from other sessions. All changes will be immediately visible to the other sessions.

In short, as a user we are faced with two challenges here:

  1. We cannot really test any DDL without affecting others, as there is no isolation.

  2. Before every DDL, we need to manually prepare rollback steps as another set of DDLs, which will reverse the change.

But Postgres supports DDL as part of transactions. which is of its key strength.

Simple use-cases of DDL transaction capabilities.

1. Testing of DDL.

Consider a situation where you may want to check the syntax of a DDL statement, which needs to be committed to source control, but do not want to really make that change. Postgres even provides the flexibility of having a separate schema, which will not be visible to anyone else unless you commit (Isolation ensured).

postgres=# \set AUTOCOMMIT off

postgres=# create schema test;
CREATE SCHEMA

postgres=# set search_path TO test;
SET

Play with more DDLs, and associated DMLs, SQL queries etc.

postgres=# create table t1 (id int);
CREATE TABLE

postgres=# insert into t1 values (2),(4);
INSERT 0 2

postgres=# select * from t1;
 id
----
  2
  4
(2 rows)

During this entire testing of scripts, everything you do remains isolated from the rest of the world. Once you are done, you can just issue a ‘rollback’.

postgres=# rollback;
ROLLBACK

Everything will be reverted back to its original state; every schema you created, every object you created or modified, etc.

2. Testing possible Indexes and estimations

Before creating an index, one needs to be aware if that index is really going to help the SQL query and how much extra space that index is going to consume.

In my performance testing environment, I can just start a transaction and create index

postgres=# \set AUTOCOMMIT off

postgres=# create index idx_pgbench_accounts on pgbench_accounts USING btree (aid);
CREATE INDEX

Now, we can answer questions like how much space this extra index is going to use:

postgres=# \di+ idx_pgbench_accounts;
                                     List of relations

 Schema |         Name         | Type  |  Owner   |      Table       |  Size  | Description 

--------+----------------------+-------+----------+------------------+--------+-------------

 public | idx_pgbench_accounts | index | postgres | pgbench_accounts | 214 MB | 

In this case, the index is going to consume 214 MB.

In the same session, we can also check whether it is helping SQL queries.

postgres=# explain select min(aid) from pgbench_accounts;
                                                         QUERY PLAN                                                         

---------------------------------------------------------------------------------
 Result  (cost=0.46..0.47 rows=1 width=4)
   InitPlan 1 (returns $0)
     ->  Limit  (cost=0.43..0.46 rows=1 width=4)
           ->  Index Only Scan using idx_pgbench_accounts on pgbench_accounts      
                                      (cost=0.43..286526.90 rows=10000941 width=4)
                 Index Cond: (aid IS NOT NULL)
(5 rows)

Yes, it is !!

Once we have done every assessment, it is time for reverting everything back

postgres=# rollback;
ROLLBACK

We can verify that new index no longer exists and query plan is back to original

postgres=# \di+ idx_pgbench_accounts;
No matching relations found.

postgres=# explain select min(aid) from pgbench_accounts;
                                    QUERY PLAN                                    
----------------------------------------------------------------------------------
 Aggregate  (cost=288946.76..288946.77 rows=1 width=4)
   ->  Seq Scan on pgbench_accounts  (cost=0.00..263944.41 rows=10000941 width=4)

During the entire testing, all the other sessions remain unaware of the new index that was created and tested. They continue to use the old execution plan.

Important Note:

Oracle’s command line client tool, sqlplus, by default has the setting autocommit = off. It means that every statement that is being issued becomes part of a transaction; however, the Postgres command line client tool psql comes with the default setting autocommit = on. Hence, every statement gets committed automatically. If you do not want the autocommit option to be on, you can specify \set AUTOCOMMIT off. This tells the client not to send commits automatically, To verify the autocommit setting, run the command

postgres=# \echo :AUTOCOMMIT

Tomas Vondra: PostgreSQL Meltdown Benchmarks

$
0
0

Two serious security vulnerabilities (code named Meltdown and Spectre) were revealed a couple of weeks ago. Initial tests suggested the performance impact of mitigations (added in the kernel) might be up to ~30% for some workloads, depending on the syscall rate.

Those early estimates had to be done quickly, and so were based on limited amounts of testing. Furthermore, the in-kernel fixes evolved and improved over time, and we now also got retpoline which should address Spectre v2. This post presents data from more thorough tests, hopefully providing more reliable estimates for typical PostgreSQL workloads.

Compared to the early assessment of Meltdown fixes which Simon posted back on January 10, data presented in this post are more detailed but in general match findings presented in that post.

This post is focused on PostgreSQL workloads, and while it may be useful for other systems with high syscall/context switch rates, it certainly is not somehow universally applicable. If you are interested in a more general explanation of the vulnerabilities and impact assessment, Brendan Gregg published an excellent KPTI/KAISER Meltdown Initial Performance Regressions article a couple of days ago. Actually, it might be useful to read it first and then continue with this post.

Note: This post is not meant to discourage you from installing the fixes, but to give you some idea what the performance impact may be. You should install all the fixes so that your environment it secure, and use this post to to decide if you may need to upgrade hardware etc.

What tests will we do?

We will look at two usual basic workload types – OLTP (small simple transactions) and OLAP (complex queries processing large amounts of data). Most PostgreSQL systems can be modeled as a mix of these two workload types.

For OLTP we used pgbench, a well-known benchmarking tool provided with PostgreSQL. We tested both in read-only (-S) and read-write (-N) modes, with three different scales – fitting into shared_buffers, into RAM and larger than RAM.

For the OLAP case, we used dbt-3 benchmark, which is fairly close to TPC-H, with two different data sizes – 10GB that fits into RAM, and 50GB which is larger than RAM (considering indexes etc.).

All the presented numbers come from a server with 2x Xeon E5-2620v4, 64GB of RAM and Intel SSD 750 (400GB). The system was running Gentoo with kernel 4.15.3, compiled with GCC 7.3 (needed to enable the full retpoline fix). The same tests were performed also on an older/smaller system with i5-2500k CPU, 8GB of RAM and 6x Intel S3700 SSD (in RAID-0). But the behavior and conclusions are pretty much the same, so we’re not going to present the data here.

As usuall, complete scripts/results for both systems are available at github.

This post is about performance impact of the mitigation, so let’s not focus on absolute numbers and instead look at performance relative to unpatched system (without the kernel mitigations). All charts in the OLTP section show

(throughput with patches) / (throughput without patches)

We expect numbers between 0% and 100%, with higher values being better (lower impact of mitigations), 100% meaning “no impact.”

Note: The y-axis starts at 75%, to make the differences more visible.

OLTP / read-only

First, let’s see results for read-only pgbench, executed by this command

pgbench -n -c 16 -j 16 -S -T 1800 test

and illustrated by the following chart:

pti/retpoline performance impact

As you can see, the performance impact of pti for scales that fit into memory is roughly 10-12% and almost non-measurable when the workload becomes I/O bound. Furthermore, the regression is significantly reduced (or disappears entirely) when pcid is enabled. This is is consistent with the claim that PCID is now a critical performance/security feature on x86. The impact of retpoline is much smaller – less than 4% in the worst case, which may easily be due to noise.

OLTP / read-write

The read-write tests were performed by a pgbench command similar to this one:

pgbench -n -c 16 -j 16 -N -T 3600 test

The duration was long enough to cover multiple checkpoints, and -N was used to eliminate lock contention on rows in the (tiny) branch table. The relative performance is illustrated by this chart:

pti/retpoline performance impact

The regressions are a bit smaller than in the read-only case – less than 8% without pcid and less than 3% with pcid enabled. This is a natural consequence of spending more time performing I/O while writing data to WAL, flushing modified buffers during checkpoint etc.

There are two strange bits, though. Firstly, the impact of retpoline is unexpectedly large (close to 20%) for scale 100, and the same thing happened for retpoline+pti on scale 1000. The reasons are not quite clear and will require additional investigation.

OLAP

The analytics workload was modeled by the dbt-3 benchmark. First, let’s look at scale 10GB results, which fits into RAM entirely (including all the indexes etc.). Similarly to OLTP we’re not really interested in absolute numbers, which in this case would be duration for individual queries. Instead we’ll look at slowdown compared to the nopti/noretpoline, that is:

(duration without patches) / (duration with patches)

Assuming the mitigations result in slowdown, we’ll get values between 0% and 100% where 100% means “no impact”. The results look like this:

That is, without the pcid the regression is generally in the 10-20% range, depending on the query. And with pcid the regression drops to less than 5% (and generally close to 0%). Once again, this confirms the importance of pcid feature.

For the 50GB data set (which is about 120GB with all the indexes etc.) the impact look like this:

So just like in the 10GB case, the regressions are below 20% and pcid significantly reduces them – close to 0% in most cases.

The previous charts are a bit cluttered – there are 22 queries and 5 data series, which is a bit too much for a single chart. So here is a chart showing the impact only for all three features (pti, pcid and retpoline), for both data set sizes.

Conclusion

To briefly summarize the results:

  • retpoline has very little performance impact
  • OLTP – the regression is roughly 10-15% without the pcid, and about 1-5% with pcid.
  • OLAP – the regression is up to 20% without the pcid, and about 1-5% with pcid.
  • For I/O bound workloads (e.g. OLTP with the largest dataset), Meltdown has negligible impact.

The impact seems to be much lower than initial estimates suggesting (30%), at least for the tested workloads. Many systems are operating at 70-80% CPU at peak periods, and the 30% would fully saturate the CPU capacity. But in practice the impact seems to be below 5%, at least when the pcid option is used.

Don’t get me wrong, 5% drop is still a serious regression. It certainly is something we would care about during PostgreSQL development, e.g. when evaluating impact of proposed patches. But it’s something existing systems should handle just fine – if 5% increase in CPU utilization gets your system over the egde, you have issues even without Meltdown/Spectre.

Clearly, this is not the end of Meltdown/Spectre fixes. Kernel developers are still working on improving the protections and adding new ones, and Intel and other CPU manufacturers are working on microcode updates. And it’s not like we know about all possible variants of the vulnerabilities, as researchers managed to find new variants of the attacks.

So there’s more to come and it will be interesting to see what the impact on performance will be.

Hans-Juergen Schoenig: COPY in PostgreSQL: Moving data between servers

$
0
0

The COPY command in PostgreSQL is a simple means to copy data between a file and a table. COPY can either copy the content of a table to or from a table. Traditionally data was copied between PostgreSQL and a file. However, recently a pretty cool feature was added to PostgreSQL: It is now possible to send data directly to the UNIX pipe.

COPY … TO PROGRAM: Sending data to the pipe

The ability to send data directly to the UNIX pipe (or Linux command line) can be pretty useful. You might want to compress your data or change the format on the fly. The beauty of the UNIX shell is that it allows you all kinds of trickery.

If you want to send data to an external program – here is how it works:

test=# COPY (SELECT * FROM pg_available_extensions)
TO PROGRAM 'gzip -c &gt; /tmp/file.txt.gz';
COPY 43

In this case the output of the query is sent to gzip, which compresses the data coming from PostgreSQL and stores the output in a file. As you can see this is pretty easy and really straight forward.

Copying data between PostgreSQL and other machines

However, in some cases users might desire to store data on some other machine. Note that the program is executed on the database server and not on the client. It is also important to note that only superusers can run COPY … TO PROGRAM. Otherwise people would face tremendous security problems, which is not desirable at all.

Once in a while people might not want to store the data exported from the database on the server but send the result to some other host. In this case SSH comes to the rescue. SSH offers an easy way to move data.

Here is an example:

echo "Lots of data" | ssh user@some.example.com 'cat &gt; /directory/big.txt'

In this case “Lots of data” will be copied over SSH and stored in /directory/big.txt.

The beauty is that we can apply the same technique to PostgreSQL:

test=# COPY (SELECT * FROM pg_available_extensions)
TO PROGRAM 'ssh user@some.example.com ''cat &gt; /tmp/result.txt'' ';
COPY 43

To make this work in real life you have to make sure that SSH keys are in place and ready to use. Otherwise the system will prompt for a password, which is of course not desirable at all. Also keep in mind that the SSH command is executed as “postgres” user (in case your OS user is called “postgres” too).

The post COPY in PostgreSQL: Moving data between servers appeared first on Cybertec.

Jean-Jerome Schmidt: Top PG Clustering HA Solutions for PostgreSQL

$
0
0

If your system relies on PostgreSQL databases and you are looking for clustering solutions for HA, we want to let you know in advance that it is a complex task, but not impossible to achieve.

We are going to discussion some solutions, from which you will be able to choose taking into account your requirements and fault tolerance.

PostgreSQL does not natively support any multi-master clustering solution, like MySQL or Oracle do. Nevertheless, there are many commercial and community products that offer this implementation, along with others such as replication or load balancing for PostgreSQL.

For a start, let's review some basic concepts:

What is High Availability?

It is the ability to recover our systems within a predefined availability level, defined by the client or the business itself.

Redundancy is the basis of high availability; in the event of an incident, we can continue to operate without problems.

Continuous Recovery

If and when an incident occurs, we have to restore a backup and then apply the wal logs; The recovery time would be very high and we would not be talking about high availability.

However, if we have the backups and the logs archived in a contingency server, we can apply the logs as they arrive.

If the logs are sent and applied every 1 minute, the contingency base would be in a continuous recovery, and would have an outdated state to the production of at most 1 minute.

Standby databases

The idea of a standby database is to keep a copy of a production database that always has the same data, and that is ready to be used in case of an incident.

There are several ways to classify a standby database:

By the nature of the replication:

  • Physical standbys: Disk blocks are copied.
  • Logical standbys: Streaming of the data changes.

By the synchronicity of the transactions:

  • Asynchronous: There is possibility of data loss.
  • Synchronous: There is no possibility of data loss; The commits in the master wait for the response of the standby.

By the usage:

  • Warm standbys: They do not support connections.
  • Hot standbys: Support read-only connections.

Clusters

It is a group of hosts working together and seen as one.

This provides a way to achieve horizontal scalability and the ability to process more work by adding servers.

It can resist the fall of a node and continue to work transparently.

There are two models depending on what is shared:

  • Shared-storage: All nodes access the same storage with the same information.
  • Shared-nothing: Each node has its own storage, which may or may not have the same information as the rest, depending on the structure of our system.

Let's now review some of the clustering options we have in PostgreSQL.

Distributed Replicated Block Device

DRBD is a Linux kernel module that implements synchronous block replication using the network. It actually does not implement a cluster, and does not handle failover or monitoring. You need complementary software for that, for example Corosync + Pacemaker + DRBD.

Example:

  • Corosync: Handles messages between hosts.
  • Pacemaker: Starts and stops services, making sure they are running only on one host.
  • DRBD: Synchronizes the data at the level of block devices.

ClusterControl

ClusterControl is an agentless management and automation software for database clusters. It helps deploy, monitor, manage and scale your database server/cluster directly from its user interface.

ClusterControl is able to handle most of the administration tasks required to maintain database servers or clusters.

With ClusterControl you can:

  • Deploy standalone, replicated or clustered databases on the technology stack of your choice.
  • Automate failovers, recovery and day to day tasks uniformly across polyglot databases and dynamic infrastructures.
  • You can create full or incremental backups and schedule them.
  • Do unified and comprehensive real time monitoring of your entire database and server infrastructure.
  • Easily add or remove a node with a single action.

On PostgreSQL, if you have an incident, your slave can be promoted to master status automatically.

It is a very complete tool, that comes with a free community version (which also includes free enterprise trial).

Node Stats View
Node Stats View
Cluster Nodes View
Cluster Nodes View
ClusterControl
Single Console for Your Entire Database Infrastructure
Find out what else is new in ClusterControl

Rubyrep

Solution of asynchronous, multimaster, multiplatform replication (implemented in Ruby or JRuby) and multi-DBMS (MySQL or PostgreSQL).

Based on triggers, it does not support DDL, users or grants.

The simplicity of use and administration is its main objective.

Some features:

  • Simple configuration
  • Simple installation
  • Platform independent, table design independent.

Pgpool II

It is a middleware that works between PostgreSQL servers and a PostgreSQL database client.

Some features:

  • Connection pool
  • Replication
  • Load balancing
  • Automatic failover
  • Parallel queries

It can be configured on top of streaming replication.

Bucardo

Asynchronous cascading master-slave replication, row-based, using triggers and queueing in the database and asynchronous master-master replication, row-based, using triggers and customized conflict resolution.

Bucardo requires a dedicated database and runs as a Perl daemon that communicates with this database and all other databases involved in the replication. It can run as multimaster or multislave.

Master-slave replication involves one or more sources going to one or more targets. The source must be PostgreSQL, but the targets can be PostgreSQL, MySQL, Redis, Oracle, MariaDB, SQLite, or MongoDB.

Some features:

  • Load balancing
  • Slaves are not constrained and can be written
  • Partial replication
  • Replication on demand (changes can be pushed automatically or when desired)
  • Slaves can be "pre-warmed" for quick setup

Drawbacks:

  • Cannot handle DDL
  • Cannot handle large objects
  • Cannot incrementally replicate tables without a unique key
  • Will not work on versions older than Postgres 8

Postgres-XC

Postgres-XC is an open source project to provide a write-scalable, synchronous, symmetric and transparent PostgreSQL cluster solution. It is a collection of tightly coupled database components which can be installed in more than one hardware or virtual machines.

Write-scalable means Postgres-XC can be configured with as many database servers as you want and handle many more writes (updating SQL statements) compared to what a single database server can do.

You can have more than one database server that clients connect to which provides a single, consistent cluster-wide view of the database.

Any database update from any database server is immediately visible to any other transactions running on different masters.

Transparent means you do not have to worry about how your data is stored in more than one database server internally.

You can configure Postgres-XC to run on multiple servers. Your data is stored in a distributed way, that is, partitioned or replicated, as chosen by you for each table. When you issue queries, Postgres-XC determines where the target data is stored and issues corresponding queries to servers containing the target data.

Citus

Citus is a drop-in replacement for PostgreSQL with built-in high availability features such as auto-sharding and replication. Citus shards your database and replicates multiple copies of each shard across the cluster of commodity nodes. If any node in the cluster becomes unavailable, Citus transparently redirects any writes or queries to one of the other nodes which houses a copy of the impacted shard.

Some features:

  • Automatic logical sharding
  • Built-in replication
  • Data-center aware replication for disaster recovery
  • Mid-query fault tolerance with advanced load balancing

You can increase the uptime of your real-time applications powered by PostgreSQL and minimize the impact of hardware failures on performance. You can achieve this with built-in high availability tools minimizing costly and error-prone manual intervention.

PostgresXL

It is a shared nothing, multimaster clustering solution which can transparently distribute a table on a set of nodes and execute queries in parallel of those nodes. It has an additional component called Global Transaction Manager (GTM) for providing globally consistent view of the cluster. The project is based on the 9.5 release of PostgreSQL. Some companies, such as 2ndQuadrant, provide commercial support for the product.

PostgresXL is a horizontally scalable open source SQL database cluster, flexible enough to handle varying database workloads:

  • OLTP write-intensive workloads
  • Business Intelligence requiring MPP parallelism
  • Operational data store
  • Key-value store
  • GIS Geospatial
  • Mixed-workload environments
  • Multi-tenant provider hosted environments

Components:

  • Global Transaction Monitor (GTM): The Global Transaction Monitor ensures cluster-wide transaction consistency.
  • Coordinator: The Coordinator manages the user sessions and interacts with GTM and the data nodes.
  • Data Node: The Data Node is where the actual data is stored.

Conclusion

There are many more products to create our high availability environment for PostgreSQL, but you have to be careful with:

  • New products, not sufficiently tested
  • Discontinued projects
  • Limitations
  • Licensing costs
  • Very complex implementations
  • Unsafe solutions

You must also take into account your infrastructure. If you have only one application server, no matter how much you have configured the high availability of the databases, if the application server fails, you are inaccessible. You must analyze the single points of failure in the infrastructure well and try to solve them.

Taking these points into account, you can find a solution that adapts to your needs and requirements, without generating headaches and being able to implement your high availability cluster solution. Go ahead and good luck!

Oleg Bartunov: SQL/JSON documentation

Amit Kapila: zheap: a storage engine to provide better control over bloat

$
0
0
In the past few years, PostgreSQL has advanced a lot in terms of features, performance, and scalability for many-core systems.  However, one of the problems that many enterprises still complain is that its size increases over time which is commonly referred to as bloat. PostgreSQL has a mechanism known as autovacuum wherein a dedicated process (or set of processes) tries to remove the dead rows from the relation in an attempt to reclaim the space, but it can’t completely reclaim the space in many cases.  In particular, it always creates a new version of a tuple on an update which must eventually be removed by periodic vacuuming or by HOT-pruning, but still in many cases space is never reclaimed completely.  A similar problem occurs for tuples that are deleted. This leads to bloat in the database.  My colleague Robert Haas has discussed some such cases in his blog DO or UNDO - there is no VACUUM where the PostgreSQL heap tends to bloat and has also mentioned the solution (zheap: a new storage format for PostgreSQL) on which EnterpriseDB is working to avoid the bloat whenever possible.  The intent of this blog post is to elaborate on that work in some more detail and show some results.

This project has three major objectives:

1. Provide better control over bloat.  zheap will prevent bloat (a) by allowing in-place updates in common cases and (b) by reusing space as soon as a transaction that has performed a delete or non-in-place update has committed.  In short, with this new storage, whenever possible, we’ll avoid creating bloat in the first place.

2. Reduce write amplification both by avoiding rewrites of heap pages and by making it possible to do an update that touches indexed columns without updating every index.

3. Reduce the tuple size by (a) shrinking the tuple header and (b) eliminating most alignment padding.

In this blog post, I will mainly focus on the first objective (Provide better control over bloat) and leave other things for future blog posts on this topic.

In-place updates will be supported except when (a) the new tuple is larger than the old tuple and the increase in size makes it impossible to fit the larger tuple onto the same page or (b) some column is modified which is covered by an index that has not been modified to support “delete-marking”.  Note that the work to support delete-marking in indexes is yet to start and we intend to support it at least for btree indexes. For in-place updates, we have to write the old tuple in the undo log and the new tuple in the zheap which help concurrent readers to read the old tuple from undo if the latest tuple is not yet visible to them.

Deletes write the complete tuple in the undo record even though we could get away with just writing the TID as we do for an insert operation. This allows us to reuse the space occupied by the deleted record as soon as the transaction that has performed the operation commits. Basically, if the delete is not yet visible to some concurrent transaction, it can read the tuple from undo and in heap, we can immediately (as soon as the transaction commits) reclaim the space occupied by the record.

Below are some of the graphs that compare the size of heap and zheap table when the table is constantly updated and there is a concurrent long-running transaction.  To perform these tests, we have used pgbench to initialize the data (at scale factor 1000) and then use the simple-update test (which comprises of one-update, one-select, one-insert) to perform updates.  You can refer to the PostgreSQL manual for more about how to use pgbench. These tests have been performed on a machine with an x86_64 architecture, 2-sockets, 14-cores per socket, 2-threads per-core and has 64-GB RAM.  The non-default configuration for the tests is shared_buffers=32GB, min_wal_size=15GB, max_wal_size=20GB, checkpoint_timeout=1200, maintenance_work_mem=1GB, checkpoint_completion_target=0.9, synchoronous_commit = off. The below graphs show the size of the table on which this test has performed updates.


In the above test, we can see that the initial size of the table was 13GB in heap and 11GB in zheap.  After running the test for 25 minutes (out of which there was an open transaction for first 15-minutes), the size in heap grows to 16GB at 8-client count test and to 20GB at 64-client count test whereas for zheap the size remains at 11GB for both the client-counts at the end of the test. The initial size of zheap is lesser because the tuple header size is smaller in zheap. Now, certainly for first 15 minutes, autovacuum can’t reclaim any space due to the open transaction, but it can’t reclaim it even after the open transaction is ended. On the other hand, the size of zheap remains constant and all the undo data generated is removed within seconds of the transaction ending.

Below are some more tests where the transaction has been kept open for a much longer duration.

After running the test for 40 minutes (out of which there was an open transaction for first 30-minutes), the size in heap grows to 19GB at 8-client count test and to 26GB at 64-client count test whereas for zheap the size remains at 11GB for both the client-counts at the end of test and all the undo generated during test gets discarded within a few seconds after the open transaction is ended.

After running the test for 55 minutes (out of which there was an open transaction for first 45-minutes), the size in heap grows to 22GB at 8-client count test and to 28GB at 64-client count test whereas for zheap the size remains at 11GB for both the client-counts at the end of test and all the undo generated during test gets discarded within few seconds after the open transaction is ended.

So from all the above three tests, it is clear that the size of heap keeps on growing as the time for a concurrent long-running transaction is increasing.  It was 13GB at the start of the test, grew to 20GB, then to 26GB, then to 28GB at 64-client count test as the duration of the open transaction has increased from 15-mins to 30-mins and then to 45-mins. We have done a few more tests on the above lines and found that as the duration of open-transaction increases, the size of heap keeps on increasing whereas zheap remains constant.  For example, similar to above, if we keep the transaction open 60-mins in a 70-min test, the size of heap increases to 30GB. The increase in size also depends on the number of updates that are happening as part of the test.

The above results show not only the impact on size, but we also noticed that the TPS (transactions per second) in zheap is also always better (up to ~45%) for the above tests.  In similar tests on some other high-end machine, we see much better results with zheap with respect to performance. I would like to defer the details about raw-performance of zheap vs. heap to another blog post as this blog has already become big.

The code for this project has been published and is proposed as a feature for PG-12 to PostgreSQL community.  Thanks to Kuntal Ghosh for doing the performance tests mentioned in this blog post.

pgCMH - Columbus, OH: PostgreSQL backups hands-on

$
0
0

BRING YOUR LAPTOP

The March meeting will be held at 18:00 EST on Tues, the 27th. Once again, we will be holding the meeting in the community space at CoverMyMeds. Please RSVP on MeetUp so we have an idea on the amount of food needed.

What

We had a lot of interest and requests for a deeper dive during last month’s presentation on pgBackRest by Andy, so this month we’re continuing the topic and setting a lab for everyone to use! We’re going to walk through both logical and physical backups with everyone actually executing them on their own lab instance. We’re then going to delve into recovery and have everyone tackle that as well. Finally, we’ll have everyone switch to pgBackRest to see how it eases and automates the backup and recovery process that everyone just learned/used.

Should be an informative session!

Where

CoverMyMeds has graciously agreed to validate your parking if you use their garage so please park there:

You can safely ignore any sign saying to not park in the garage as long as it’s after 17:30 when you arrive.

Park in any space that is not marked ‘24 hour reserved’.

Once parked, take the elevator/stairs to the 3rd floor to reach the Miranova lobby. Once in the lobby, the elevator bank is in the back (West side) of the building. Take a left and walk down the hall until you see the elevator bank on your right. Grab an elevator up to the 11th floor. (If the elevator won’t let you pick the 11th floor, contact Doug or CJ (info below)). Once you exit the elevator, look to your left and right; one side will have visible cubicles, the other won’t. Head to the side without cubicles. You’re now in the community space:

Community space as seen from the stage

The kitchen is to your right (grab yourself a drink) and the meeting will be held to your left. Walk down the room towards the stage.

If you have any issues or questions with parking or the elevators, feel free to text/call Doug at +1.614.316.5079 or CJ at +1.740.407.7043

Samay Sharma: The Postgres 10 feature you didn't know about: CREATE STATISTICS

$
0
0

If you’ve done some performance tuning with Postgres, you might have used EXPLAIN. EXPLAIN shows you the execution plan that the PostgreSQL planner generates for the supplied statement. It shows shows how the table(s) referenced by the statement will be scanned (using a sequential scan, index scan etc), and what join algorithms will be used if multiple tables are used. But, how does Postgres come up with these plans?

One very significant input to deciding which plan to use is the statistics the planner collects. These statistics allows the planner to estimate how many rows will be returned after executing a certain part of the plan, which then influences the kind of scan or join algorithm which will be used. They are collected / updated mainly by running ANALYZE or VACUUM (and a few DDL commands such as CREATE INDEX).

These statistics are stored by the planner in pg_class and in pg_statistics. Pg_class basically stores the total number of entries in each table and index, as well as the number of disk blocks occupied by them. Pg_statistic stores statistics about each column like what % of values are null for the column, what are the most common values, histogram bounds etc. You can see an example below for the kind of statistics Postgres collected for col1 in our table below. The query output below shows that the planner (correctly) estimates that there are 1000 distinct values for the column col1 in the table and also makes other estimates on most common values, frequencies etc.

Note that we’ve queried pg_stats (a view holding more readable version of the column statistics.)

CREATETABLEtbl(col1int,col2int);INSERTINTOtblSELECTi/10000,i/100000FROMgenerate_series(1,10000000)s(i);ANALYZEtbl;select*frompg_statswheretablename='tbl'andattname='col1';-[RECORD1]----------+--------------------------------------------------------------------------------------------------------------------------------------------------------------------------------------------------------------------------------------------------------------------------------------------------------------------------------------------------------------------------------------------------------------------------------------------------------------------------------------------------------------------------------------------------------------------------------------------------------------------------------------------------------------------------------------------------------------------------------------------------------------------------------------------------------------------------------------------------------------------------------------------------------------------------------------------------------------------------schemaname|publictablename|tblattname|col1inherited|fnull_frac|0avg_width|4n_distinct|1000most_common_vals|{318,564,596,...}most_common_freqs|{0.00173333,0.0017,0.00166667,0.00156667,...}histogram_bounds|{0,8,20,30,39,...}correlation|1most_common_elems|most_common_elem_freqs|elem_count_histogram|

When single column statistics are not enough

These single column statistics help the planner in estimating the selectivity of your conditions (this is what the planner uses to estimate how many rows will be selected by your index scan. When multiple conditions are supplied in the query, the planner assumes that the columns (or the where clause conditions) are independent of each other. This doesn’t hold true when columns are correlated or dependant on each other and that leads the planner to under or over-estimate the number of rows which will be returned by these conditions.

Let’s look at a few examples below. For keeping the plans simple to read, we’ve switched off per-query parallelism by setting setting max_parallel_workers_per_gather to 0;

EXPLAINANALYZESELECT*FROMtblwherecol1=1;QUERYPLAN-----------------------------------------------------------------------------------------------------------SeqScanontbl(cost=0.00..169247.80rows=9584width=8)(actualtime=0.641..622.851rows=10000loops=1)Filter:(col1=1)RowsRemovedbyFilter:9990000Planningtime:0.051msExecutiontime:623.185ms(5rows)

As you can see here, the planner estimates that the number of rows which have value 1 for col1 are 9584 and that the actual number of rows which the query returns is 10000. So, pretty accurate.

But, what happens when you include filters on both column 1 and column 2.

EXPLAINANALYZESELECT*FROMtblwherecol1=1andcol2=0;QUERYPLAN----------------------------------------------------------------------------------------------------------SeqScanontbl(cost=0.00..194248.69rows=100width=8)(actualtime=0.640..630.130rows=10000loops=1)Filter:((col1=1)AND(col2=0))RowsRemovedbyFilter:9990000Planningtime:0.072msExecutiontime:630.467ms(5rows)

The planner estimate is already off by 100x! Let’s try to understand why that happened.

The selectivity for the first column is around 0.001 (1/1000) and the selectivity for the second column is 0.01 (1/100). To calculate the number of rows which will be filtered by these 2 “independent” conditions, the planner multiplies their selectivity. So, we get:

Selectivity = 0.001 * 0.01 = 0.00001.

When that is multiplied by the number of rows we have in the table i.e. 10000000 we get 100. That’s where the planner’s estimate of 100 is coming from. But, these columns are not independent, how do we tell the planner that?

CREATE STATISTICS in PostgreSQL

Before Postgres 10, there wasn’t an easy way to tell the planner to collect statistics which capture this relationship between columns. But, with Postgres 10, there’s a new feature which is built to solve exactly this problem. CREATE STATISTICS can be used to create extended statistics objects which tell the server to collect extra statistics about these interesting related columns.

Functional dependency statistics

Getting back to our previous estimation problem, the issue was that the value of col2 is actually nothing but col 1 / 10. In database terminology, we would say that col2 is functionally dependent on col1. What that means is that the value of col1 is sufficient to determine the value of col2 and that there are no two rows having the same value of col1 but different values col2. Therefore, the 2nd filter on col2 actually doesn’t remove any rows! But, the planner capture enough statistics to know that.

Let’s create a statistics object to capture functional dependency statistics about these columns and run ANALYZE.

CREATESTATISTICSs1(dependencies)oncol1,col2fromtbl;ANALYZEtbl;

Let’s see what the planner comes up with now.

EXPLAINANALYZESELECT*FROMtblwherecol1=1andcol2=0;QUERYPLAN-----------------------------------------------------------------------------------------------------------SeqScanontbl(cost=0.00..194247.76rows=9584width=8)(actualtime=0.638..629.741rows=10000loops=1)Filter:((col1=1)AND(col2=0))RowsRemovedbyFilter:9990000Planningtime:0.115msExecutiontime:630.076ms(5rows)

Much better! Let’s look at what helped the planner make that determination.

SELECTstxname,stxkeys,stxdependenciesFROMpg_statistic_extWHEREstxname='s1';stxname|stxkeys|stxdependencies---------+---------+----------------------s1|12|{"1 => 2":1.000000}(1row)

Looking at this, we can see that Postgres realizes that col1 fully determines col2 and therefore has a coefficient of 1 to capture that information. Now, all queries with filters on both these columns will have much better estimates.

ndistinct statistics

Functional dependency is one kind of relationship you can capture between the columns. Another kind of statistic you can capture is number of distinct values for a set of columns. We earlier noted that the planner captures statistics for number of distinct values for each column, but again those statistics are frequently wrong when combining more than one column.

When does having bad distinct statistics hurt me? Lets look at an example.

EXPLAINANALYZESELECTcol1,col2,count(*)fromtblgroupbycol1,col2;QUERYPLAN-----------------------------------------------------------------------------------------------------------------------------GroupAggregate(cost=1990523.20..2091523.04rows=100000width=16)(actualtime=2697.246..4470.789rows=1001loops=1)GroupKey:col1,col2->Sort(cost=1990523.20..2015523.16rows=9999984width=8)(actualtime=2695.498..3440.880rows=10000000loops=1)SortKey:col1,col2SortMethod:externalsortDisk:176128kB->SeqScanontbl(cost=0.00..144247.84rows=9999984width=8)(actualtime=0.008..665.689rows=10000000loops=1)Planningtime:0.072msExecutiontime:4494.583ms

When aggregating rows, Postgres chooses to do either a hash aggregate or a group aggregate. If it can fit the hash table in memory, it choose hash aggregate, otherwise it chooses to sort all the rows and then group them according to col1, col2.

Now, the planner estimates that the number of groups (which is equal to the number of distinct values for col1, col2) will be 100000. It sees that it doesn’t have enough work_mem to store that hash table in memory. So, it uses a disk-based sort to run the query. However, as you can see in the actual section of the plan, the number of actual rows are only 1001. And maybe, we had enough memory to fit them in memory, and do a hash aggregation.

Let’s ask the planner to capture n_distinct statistics, re-run the query and find out.

CREATE STATISTICS s2 (ndistinct) on col1, col2 from tbl;                                  
ANALYZE tbl;

EXPLAIN ANALYZE SELECT col1,col2,count(*) from tbl group by col1, col2;                   
                                                      QUERY PLAN                                                       
-----------------------------------------------------------------------------------------------------------------------
 HashAggregate  (cost=219247.63..219257.63 rows=1000 width=16) (actual time=2431.767..2431.928 rows=1001 loops=1)
   Group Key: col1, col2
   ->  Seq Scan on tbl  (cost=0.00..144247.79 rows=9999979 width=8) (actual time=0.008..643.488 rows=10000000 loops=1)
 Planning time: 0.129 ms
 Execution time: 2432.010 ms
(5 rows)

You can see that the estimates are now much more accurate (i.e. 1000), and the query is now around 2x faster. We can see what the planner learned by running the query below.

SELECT stxkeys AS k, stxndistinct AS nd                                                   
  FROM pg_statistic_ext                                                                   
  WHERE stxname = 's2'; 
  k  |       nd       
-----+----------------
 1 2 | {"1, 2": 1000}

Real-world implications

In actual production schemas, you invariably have certain columns which have dependencies or relationships with each other which the database doesn’t know about. Some examples we’ve seen with Citus customers are:

  • Having columns for month, quarter and year because you want to show statistics grouped by all in reports.
  • Relationships between geographical hierarchies. Eg. having country, state and city columns and filtering / grouping by them.

The example here has only 10M rows in the dataset and we already see that using CREATE statistics improves plans significantly in cases where there are correlated columns and also shows performance improvements. In Citus use cases, we have customers storing billions of rows of data and the implications of bad plans can be drastic. In our example when the planner chose a bad plan we had to do a disk based sort for 10M rows, imagine how bad it would have been with billions of rows.

Postgres keeps getting better and better

When we set out to build Citus we explicitly chose Postgres as the foundation to build on. By extending Postgres we chose a solid foundation that continues to get better with each release. Because Citus is a pure extension and not a fork all the great new features that come out in each release you get to take advantage of when using Citus.

Dimitri Fontaine: Database Modelization Anti-Patterns

$
0
0

Next week we see two awesome PostgreSQL conferences in Europe, back to back, with a day in between just so that people may attend both! In chronological order we have first Nordic pgDay in Oslo where I will have the pleasure to talk about Data Modeling, Normalization and Denormalization. Then we have pgday.paris with an awesome schedule and a strong focus on the needs of application developers!

Joshua Drake: The 401 on Silicon Valley Postgres

$
0
0

August 2017

We launched the Silicon Valley Postgres Meetup.

March 6th, 2018

We have reached 401 members in what is proving to be one of the fastest growing Postgres meetups in the United States. We launched the meetup along with Vancouver B.C., Denver, Salt Lake City, and Phoenix.

Between these and other meetups we help organize such as New York, Philly, and Dallas, we are reaching more people than ever in education, advocacy, and applicability of Postgres!

The increase of professional contribution

Why is this important? The majority of potential Postgres contributors are not part of the internal network of PostgreSQL.Org and other international organizations. They are developers, users, consultants, companies, project managers, documentation writers, etc. These professionals are potential contributors.

Wouldn’t it be great if we had a team of consultants from different disciplines, companies, and backgrounds creating, “10 Steps on How to Perform your Needed Postgres $task,” that included a professional documentation writer?

Wouldn’t it be great if we had a series of professional consultants and speakers that willingly took the time to give a mini-conference such as the PostgresConf Mini Series where you can get 3-4 hours of free training on Postgres?

Greatness is achieved

When you encourage, grow, support, and educate the entire community.

People, Postgres, Data


Marco Slot: Distributed Execution of Subqueries and CTEs in Citus

$
0
0

The latest release of the Citus database brings a number of exciting improvements for analytical queries across all the data and for real-time analytics applications. Citus already offered full SQL support on distributed tables for single-tenant queries and support for advanced subqueries that can be distributed (“pushed down”) to the shards. With Citus 7.2, you can also use CTEs (common table expressions), set operations, and most subqueries thanks to a new technique we call “recursive planning”.

Recursive planning looks for CTEs and subqueries that cannot be distributed along with the rest of the query because their results first need to be merged in one place. To generate a (distributed) plan for executing these subqueries, the internal APIs in Postgres allow us to do something mind-blowingly simple: We recursively call the Postgres planner on the subquery, and we can push the results back into the Citus database cluster. We then get a multi-stage plan that can be efficiently executed in a distributed way. As a result, Citus is now getting much closer to full SQL support for queries across all shards, in a way that’s fast and scalable.

In this post, we’ll take a deeper dive into how the distributed query planner in Citus handles subqueries—both subqueries that can be distributed in a single round, and multi-stage queries that use the new recursive planning feature.

Pushing down subqueries that join by distribution column

Citus divides tables into shards, which are regular tables distributed over any number of worker nodes. When running an analytical query, Citus first checks if the query can be answered in a single round of executing a SQL query on all the shards in parallel, and then merging the results on the coordinator.

For example, a SELECT count(*) would be computed by taking the count(*) on each shard and then summing the results on the coordinator. Internally, the Citus planner builds a multi-relational algebra tree for the query and then optimises the query tree by “pushing down” computation to the data.

As it turns out, this method of planning can also be applied to very advanced joins and subqueries, as long as they join on the distribution column. For example, let’s take a slight variant of the funnel query in Heap’s blog post on lateral joins for finding the number of users who entered their credit card number within 2 weeks after first viewing the homepage.

SELECTcreate_distributed_table('event','user_id');SELECTsum(view_homepage)ASviewed_homepage,sum(enter_credit_card)ASentered_credit_cardFROM(-- Get the first time each user viewed the homepage.SELECT1ASview_homepageFROMeventWHEREdata->>'type'='view_homepage'GROUPBYuser_id)e1LEFTJOINLATERAL(SELECT1ASenter_credit_cardFROMeventWHEREuser_id=e1.user_idANDdata->>'type'='enter_credit_card'ANDtimeBETWEENview_homepage_timeAND(view_homepage_time+1000*60*60*24*14)GROUPBYuser_id)e2ONtrue;

Even though this is a very complex SQL query, Citus can execute the query in a single round because it recognises that a) each subquery returns tuples grouped by user ID—the distribution column— and b) the two subqueries join by the distribution column. Therefore, the query can be answered round by “pushing down” the subqueries, the join, and the partial sum to each shard. This means that Postgres does all the heavy lifting—in parallel—and Citus merges the results (i.e. sums the sums) on the coordinator.

This makes Citus one of the only distributed databases that supports distributed lateral joins, and it’s one of the reasons Heap uses Citus.

Adding a touch of reference tables

Reference tables are tables that are replicated to all nodes in the Citus cluster. This means that any shard can be joined with a reference table. Most joins between a distributed table and a reference table can be safely pushed down, including joins that don’t include the distribution column and even non-equi joins. An inner join between a shard and the reference table always returns a strict subset of the overall join result. There are some minor caveats around outer joins, but most types of joins, including spatial joins, are supported when joining with a reference table.

We recently made a lot of improvements for using reference tables in subqueries and then started wondering: Could we apply the same logic to SQL functions? And then: What if we had a function that could read the result of a CTE?

Recursively planning CTEs and Subqueries

Not all subqueries are supported through query pushdown, since the results may need to be merged (e.g. a subquery that computes an aggregate across all the data), but at some point we realised that the unsupported subqueries and CTEs were usually queries that Citus could execute by themselves.

Postgres has a very modular planner and executor, which makes it possible to take part of the query tree and run it through the planner function. At execution time, we can run the query in its own execution context (“Portal”) and send the result wherever we want. In this case we send the results to a file on each worker (we used a file instead of a table to be able to use it on read-only follower formations). During planning, we also replace any references to the replaced CTE or subquery that cannot be pushed down with a function that reads from the file.

For example, if you load the github events data into a distributed table then you can now run queries such as the following, which gets the latest commit for each of the 5 most active postgres committers:

WITHpostgres_commitsAS(SELECTcreated_at,jsonb_array_elements(payload->'commits')AScommFROMgithub.eventsWHERErepo->>'name'='postgres/postgres'ANDpayload->>'ref'='refs/heads/master'),commits_by_authorAS(SELECTcreated_at,comm->'author'->>'name'ASauthor,comm->>'message'ASmessageFROMpostgres_commits),top_contributorsAS(SELECTauthor,count(*)FROMcommits_by_authorGROUPBY1ORDERBY2DESCLIMIT5)SELECTauthor,created_at,string_agg(message,'\n')ASlatest_messagesFROMcommits_by_authorcJOINtop_contributorsUSING(author)WHEREcreated_at=(SELECTmax(created_at)FROMcommits_by_authorWHEREauthor=c.author)GROUPBYauthor,created_at,top_contributors.countORDERBYtop_contributors.countDESC;

To plan this query, Citus recursively calls the postgres planner for each CTE, the first one is:

-- postgres_commits CTE is planned as a normal distributed querySELECTcreated_at,jsonb_array_elements(payload->'commits')AScommFROMgithub.eventsWHERErepo->>'name'='postgres/postgres'ANDpayload->>'ref'='refs/heads/master'

Interestingly, Citus itself will intercept the query in the recursively called planner hook and plan this query in a distributed way.

The planner also replaces all references to the CTE with a call to the read_intermediate_result function, which will read the file that we place on the workers:

-- commits_by_author query before recursive planningSELECTcreated_at,comm->'author'->>'name'ASauthor,comm->>'message'ASmessageFROMpostgres_commits-- internally-generated commits_by_author query after recursive planning-- CTE is replaced by a subquery on the read_intermediate_result functionSELECTcreated_at,comm->'author'->>'name'ASauthor,comm->>'message'ASmessageFROM(SELECTres.created_at,res.commFROMread_intermediate_result('1_1')ASres(created_attimestamptz,commjsonb))postgres_commits

An interesting thing to note is that after replacing the CTE reference, the (sub)query does not have any references to a distributed table. It therefore gets treated similarly to single-tenant queries, which already have full SQL support without any additional steps. Another interesting thing is that the subquery can be anything that postgres can plan, including queries on local tables or functions. This means you can now even query a local table in a CTE and then join it with a distributed table.

At the end of planning, Citus has a list of plans, one for each CTE or subquery that requires a merge step. At execution time, Citus executes these plans one by one through the postgres, piping the results back into the workers nodes, and then uses the results in the next step(s) as if it was a reference table.

Dynamic replanning for intermediate results

The Postgres planner often has trouble estimating the size of intermediate results, such as the number of rows returned by a CTE. This can lead to suboptimal query plans that use too much CPU time (e.g. nested loops), but Citus has one last trick up its sleeve: “dynamic replanning”. A worker node doesn’t get a query on an intermediate result until that result is actually available. The Citus planner hooks can therefore tell the postgres planner exactly how many rows the result file contains, such that postgres will make the perfect execution plan for the query on the shard.

Fully scalable SQL with Citus

As always, performance and scalability are our top priorities, and this is often driven by the needs of Citus customers, some of whom have up to a petabyte of data. In improving Citus we could have quickly achieved full SQL support by pulling all needed information to the coordinator, but doing so would have been little improvement over single-node Postgres.

By leveraging Postgres internal APIs and distributing as much of the work as possible to the Citus worker nodes, we are able to deliver some impressive performance. With the Citus approach to scaling out Postgres, you get the SQL you always wanted, the rich feature set of Postgres, and the scale that typically comes along with NoSQL databases—and best of all it’s still performant.

If you have any questions on how the recursive planning or other internals of the Citus database work, join the conversation with our engineers in our slack channel.

Viewing all 9673 articles
Browse latest View live


<script src="https://jsc.adskeeper.com/r/s/rssing.com.1596347.js" async> </script>