Quantcast
Channel: Planet PostgreSQL
Viewing all 9816 articles
Browse latest View live

Dimitri Fontaine: Database Normalization and Primary Keys

$
0
0

In our previous article we saw three classic Database Modelization Anti-Patterns. The article also contains a reference to a Primary Key section of my book Mastering PostgreSQL in Application Development, so it’s only fair that I would now publish said Primary Key section!

So in this article, we dive into Primary Keys as being a cornerstone of database normalization. It’s so important to get Primary Keys right that you would thing everybody knows how to do it, and yet, most of the primary key constraints I’ve seen used in database design are actually not primary keys at all.


Adrien Nayrat: Logical replication internals

$
0
0
Table of Contents Introduction Spills changes on disk Example with a single transaction Example with two transactions CPU Database-wide statistics Network Replication OLTP workload Conclusion Introduction I introduced replication through several posts: PostgreSQL 10 : Logical replication - Overview PostgreSQL 10 : Logical replication - Setup PostgreSQL 10 : Logical replication - Limitations This new post will dig a little deeper. We will see postgres internals about logical replication.

Pierre-Emmanuel André: Setup a streaming replication with PostgreSQL 10

$
0
0

Streaming replication with PostgreSQL 10

In this post, i will explain how to setup a streaming replication with PostgreSQL 10. I will not explain how to install PostgreSQL 10 on your system.

Oleg Bartunov: sql/json: House example

Hans-Juergen Schoenig: What PostgreSQL Full-Text-Search has to do with VACUUM

$
0
0

What does PostgreSQL Full-Text-Search have to do with VACUUM? Many readers might actually be surprised that there might be a relevant connection worth talking about at all. However, those two topics are more closely related than people might actually think. The reason is buried deep inside the code and many people might not be aware of those issues. Therefore I decided to shade some light on the topic and explain, what is really going on here. The goal is to help end users to speed up their Full-Text-Indexing (FTI) and offer better performance to everybody making use of PostgreSQL.

Controlling VACUUM and autovacuum

Before digging into the real stuff it is necessary to create some test data. For that purpose I created a table. Note that I turned autovacuum off so that all operations are fully under my control. This makes it easier to demonstrate, what is going on in PostgreSQL.

test=# CREATE TABLE t_fti (payload tsvector) 
   WITH (autovacuum_enabled = off);
CREATE TABLE

In the next step we can create 2 million random texts. For the sake of simplicity I did not import a real data set containing real texts but simply created a set of md5 hashes, which are absolutely good enough for the job:

test=# INSERT INTO t_fti 
    SELECT to_tsvector('english', md5('dummy' || id)) 
    FROM generate_series(1, 2000000) AS id;
INSERT 0 2000000

Here is what our data looks like:

test=# SELECT to_tsvector('english', md5('dummy' || id)) 
   FROM generate_series(1, 5) AS id;
        to_tsvector 
--------------------------------------
'8c2753548775b4161e531c323ea24c08':1
'c0c40e7a94eea7e2c238b75273087710':1
'ffdc12d8d601ae40f258acf3d6e7e1fb':1
'abc5fc01b06bef661bbd671bde23aa39':1
'20b70cebcb94b1c9ba30d17ab542a6dc':1
(5 rows)

To make things more efficient, I decided to use the tsvector data type in the table directly. The advantage is that we can directly create a full text index (FTI) on the column:

test=# CREATE INDEX idx_fti 
         ON t_fti USING gin(payload);
CREATE INDEX

In PostgreSQL a GIN index is usually used to take care of “full text search” (FTS).

Finally we run VACUUM to create all those hint bits and make PostgreSQL calculate optimizer statistics.

test=# VACUUM ANALYZE ;
VACUUM

How GIN indexes work in PostgreSQL

To understand what VACUUM and Full Text Search (FTS) have to do with each other, we got to first see, how GIN indexes actually work: A GIN index is basically a “normal tree” down to the word level. So you can just binary search to find a word easily. However: In contrast to a btree, GIN has a “posting tree” below the word level. So each word only shows up once in the index but points to a potentially large list of entries. For full text search this makes sense because the number of distinct words is limited in real life while a single word might actually show up thousands of times.

The following image shows, what a GIN index looks like:

Let us take a closer look at the posting tree itself: It has one entry for pointer to the underlying table. To make it efficient the posting tree is sorted. The trouble now is: If you insert into the table, changing the GIN index for each row is pretty expensive. Modifying the posting tree does not come for free. Remember: You have to maintain the right order in your posting tree so changing things comes with some serious overhead.

Fortunately there is a solution to the problem: The “GIN pending list”. When a row is added, it does not go to the main index directly. But instead it is added to a “TODO” list, which is then processed by VACUUM. So after a row is inserted, the index is not really in its final state. What does that mean? It means that when you scan the index, you have to scan the tree AND sequentially read what is still in the pending list. In other words: If the pending list is long, this will have some impact on performance. In many cases it can therefore make sense to vacuum a table used to full text search more aggressively as usual. Remember: VACUUM will process all the entries in the pending list.

Measuring the performance impact of VACUUM

To see what is going on behind the screenes, install pgstattuple:

CREATE EXTENSION pgstattuple;

With pgstattuple you can take a look at the internals of the index:

test=# SELECT * FROM pgstatginindex('idx_fti');
version | pending_pages | pending_tuples
---------+---------------+----------------
2 | 0 | 0
(1 row)

In this case the pending list is empty. In addition to that the index is also pretty small:

test=# SELECT pg_relation_size('idx_gin');
pg_relation_size
------------------
188416
(1 row)

Keep in mind: We had 2 million entries and the index is still close to nothing compared to the size of the table:

test=# SELECT pg_relation_size('t_fti');
pg_relation_size
------------------
154329088
(1 row)

Let us run a simple query now. We are looking for a word, which does not exist. Note that the query needs ways less than 1 millisecond:

test=# explain (analyze, buffers) SELECT *
FROM t_fti
WHERE payload @@ to_tsquery('whatever');
QUERY PLAN
--------------------------------------------------------------------
Bitmap Heap Scan on t_fti (cost=20.77..294.37 rows=67 width=45)
(actual time=0.030..0.030 rows=0 loops=1)
Recheck Cond: (payload @@ to_tsquery('whatever'::text))
Buffers: shared hit=5
-> Bitmap Index Scan on idx_fti (cost=0.00..20.75 rows=67 width=0)
(actual time=0.028..0.028 rows=0 loops=1)
Index Cond: (payload @@ to_tsquery('whatever'::text))
Buffers: shared hit=5
Planning time: 0.148 ms
Execution time: 0.066 ms

(8 rows)

I would also like to point you to something else: “shared hit = 5”. The query only needed 5 blocks of data to run. This is really really good because even if the query has to go to disk, it will still return within a reasonable amount of time.

Let us add more data. Note that autovacuum is off so there are no hidden operations going on:

test=# INSERT INTO t_fti
SELECT to_tsvector('english', md5('dummy' || id))
FROM generate_series(2000001, 3000000) AS id;
INSERT 0 1000000

The same query, which performanced so nicely before is now a lot slower:

test=# explain (analyze, buffers) SELECT *
FROM t_fti
WHERE payload @@ to_tsquery('whatever');
QUERY PLAN
-----------------------------------------------------------------
Bitmap Heap Scan on t_fti (cost=1329.02..1737.43 rows=100 width=45)
(actual time=9.377..9.377 rows=0 loops=1)
Recheck Cond: (payload @@ to_tsquery('whatever'::text))
Buffers: shared hit=331
-> Bitmap Index Scan on idx_fti (cost=0.00..1329.00 rows=100 width=0)
(actual time=9.374..9.374 rows=0 loops=1)
Index Cond: (payload @@ to_tsquery('whatever'::text))
Buffers: shared hit=331
Planning time: 0.194 ms
Execution time: 9.420 ms
(8 rows)

PostgreSQL needs more than 9 milliseconds to run the query. The reason is that there are many pending tuples in the pending list. Also: The query had to access 331 pages in this case, which is A LOT more than before. The GIN pending list reveals the underlying problem:

test=# SELECT * FROM pgstatginindex('idx_fti');
version | pending_pages | pending_tuples
---------+---------------+----------------
2 | 326 | 50141
(1 row)

5 pages + 326 pages = 331 pages. The pending list explains all the additional use of data pages instantly.

Running VACUUM to speed up Full-Text-Search (FTS) in PostgreSQL

Moving those pending entries to the real index is simple. We simply run VACUUM ANALYZE again:

test=# VACUUM ANALYZE;
VACUUM

As you can see the pending list is now empty:

test=# SELECT * FROM pgstatginindex('idx_fti');
version | pending_pages | pending_tuples
---------+---------------+----------------
2 | 0 | 0
(1 row)

The important part is that the query is also a lot slower again because the number of blocks has decreased again.

test=# explain (analyze, buffers) SELECT *
FROM t_fti
WHERE payload @@ to_tsquery('whatever');
QUERY PLAN
-----------------------------------------------------------------
Bitmap Heap Scan on t_fti (cost=25.03..433.43 rows=100 width=45)
(actual time=0.033..0.033 rows=0 loops=1)
Recheck Cond: (payload @@ to_tsquery('whatever'::text))
Buffers: shared hit=5
-> Bitmap Index Scan on idx_fti (cost=0.00..25.00 rows=100 width=0)
(actual time=0.030..0.030 rows=0 loops=1)
Index Cond: (payload @@ to_tsquery('whatever'::text))
Buffers: shared hit=5
Planning time: 0.240 ms
Execution time: 0.075 ms
(8 rows)

I think those examples show pretty conclusively that VACUUM does have a serious impact on the performance of your full text indexing. Of course this is only true if a significant part of your data is changed on a regular basis.

The post What PostgreSQL Full-Text-Search has to do with VACUUM appeared first on Cybertec.

Hubert 'depesz' Lubaczewski: paste.depesz.com is no more

$
0
0
Some time ago I wrote a site to paste SQL queries with reformatting/pretty-printing using pgFormatter library. Today, I figured out that I should update the library since it has quite some changes recently, so it would be good to incorporate its fixes to paste site. Unfortunately – new version is not backward compatible, and I […]

Umair Shahid: Using Java ORMs with PostgreSQL – MyBatis

$
0
0

In my previous blogs, I wrote about Hibernate Query Language (HQL) and Querydsl in detail, now I’m going to talk about MyBatis.

While ORMs typically map Java objects to database tables (or vice versa), MyBatis takes a different approach by mapping Java methods to SQL statements. This gives you complete control over writing SQL and its subsequent execution. With the help of a mapper, MyBatis also allows automatic mapping of database objects to Java objects.

Like all other Java persistence frameworks, the main aim of MyBatis is to reduce the time and coding requirements of talking to a database using raw JDBC. It is licensed as Apache License 2.0 and is free to use.

Why Use MyBatis?

MyBatis design has a database-centric approach, so if your application is driven by relational design, MyBatis is a very good option. It is also a good option if you are developing a new application or extending an existing one on top of an existing database infrastructure.

MyBatis can very quickly and neatly execute READ operations, so it comes in handy for applications that are oriented towards analytics and reporting. Because it is designed to use SQL directly, it gives you low level & complete control over the queries being executed against the database. On top of that, with the help of MyBatis data mapper, the object model within Java and the data model within your database are allowed to be different. This gives greater flexibility in Java coding.

Prominent Features

Let’s continue using the ‘largecities’ table for MyBatis features.

PreRequisites

To start using MyBatis, first you need to download its jar file, which you can get from: https://github.com/mybatis/mybatis-3/releases. The file needs to be in the project’s classpath along with the PostgreSQL JDBC driver.

Next, you need to create the Java object class as follows:

package org.secondquadrant.javabook.mybatis;public class LargeCities {        private int rank;        private String name;        public int getRank() {                return rank;        }        public void setRank(int rank) {                this.rank = rank;        }        public String getName() {                return name;        }        public void setName(String name) {                this.name = name;        }         }

Lastly, MyBatis needs a config XML in order to tell it how to connect to the database. In this example, we are naming the file ‘mybatis-config.xml’ and the contents are as follows:

<?xml version="1.0" encoding="UTF-8"?><!DOCTYPE configurationPUBLIC "-//mybatis.org//DTD Config 3.0//EN""http://mybatis.org/dtd/mybatis-3-config.dtd"><configuration>        <environments default="development">                <environment id="development">                        <transactionManager type="JDBC" />                        <dataSource type="POOLED">                                <property name="driver"value="org.postgresql.Driver" />                                <property name="url" 
value="jdbc:postgresql://localhost:5432/postgres" />                                <property name="username" value="postgres" />                                <property name="password" value="" />                        </dataSource>                </environment>        </environments>        <mappers>                <mapper resource="org/secondquadrant/javabook/mybatis/LargeCitiesMapper.xml" />        </mappers></configuration>

Notice the <mappers> tag and its contents at the end of this file? This is explained in the section below.

Mapper XML – Simple SELECT

The mapper XML file tells MyBatis exactly how to map incoming database objects to Java objects. Below is an example of the mapper XML file running a simple SELECT query against the largecities table.

<?xml version="1.0" encoding="UTF-8"?><!DOCTYPE mapper PUBLIC "-//mybatis.org//DTD Mapper 3.0//EN" "http://mybatis.org/dtd/mybatis-3-mapper.dtd"><mapper namespace="org.secondquadrant.javabook.mybatis.Mapper">        <select id="selectCities" resultType="org.secondquadrant.javabook.mybatis.LargeCities">                SELECT * FROM largecities        </select></mapper>

Using the Mapper XML

MyBatis provides a number of resources that make it easy to load XML data and to create an input stream. The sequence of events to use a mapper XML file to read data is as follows:

  1. Create an input stream from the mapper XML
  2. Using the SqlSessionFactoryBuilder and the inputStream above, create a sqlSessionFactory
  3. Open a new session from this sessionFactory
  4. Call the Java method encapsulating your SQL query

The code, hence, ends up looking like the following:

        try  {                                String resource = "mybatis-config.xml";                InputStream inputStream = Resources.getResourceAsStream(resource);                SqlSessionFactory sqlSessionFactory = new
SqlSessionFactoryBuilder().build(inputStream);                                                SqlSession session = sqlSessionFactory.openSession();                  List<LargeCities> list = session.selectList("selectCities");                                  for (LargeCities a : list) {                        System.out.println("Rank: " + a.getRank() + " Name: " + a.getName());                }        }         catch (Exception e) {            e.printStackTrace();        }

Notice how the mybatis-config.xml is referred to when creating an InputStream and then the selectCities id (declared in the mapper XML) is used to call the Java method.

Output of this code is as follows:

Rank: 1 Name: TokyoRank: 2 Name: SeoulRank: 3 Name: ShanghaiRank: 4 Name: GuangzhouRank: 5 Name: KarachiRank: 6 Name: DelhiRank: 7 Name: Mexico CityRank: 8 Name: BeijingRank: 9 Name: LagosRank: 10 Name: Sao Paulo

Passing Parameters

In order to specify extract criteria, you can pass parameters to your query. This is specified in the mapper XML. As an example:

<select id="selectCitiesWithInput" resultType="org.secondquadrant.javabook.mybatis.LargeCities">        SELECT * FROM largecities where rank &lt; #{rank} </select>

In this example, all result with rank less than what is specified with the #{rank} parameter will be retrieved.

This method is called from the main function as:

List<LargeCities> list = session.selectList("selectCitiesWithInput", 6);  

Output of this code is:

Rank: 1 Name: TokyoRank: 2 Name: SeoulRank: 3 Name: ShanghaiRank: 4 Name: GuangzhouRank: 5 Name: Karachi

Inserting Data

Insertion of data requires another entry in the mapping XML document.

<insert id="insertCity">        INSERT INTO largecities (rank, name) VALUES (#{rank},#{name})</insert>

The insertion can then be done using the following Java code:

try  {                String resource = "mybatis-config.xml";        InputStream inputStream = Resources.getResourceAsStream(resource);        SqlSessionFactory sqlSessionFactory = new
SqlSessionFactoryBuilder().build(inputStream);                        SqlSession session = sqlSessionFactory.openSession();                LargeCities mumbai = new LargeCities();         mumbai.setRank(11);        mumbai.setName("Mumbai");       
        session.insert("insertCity", mumbai);        session.commit();
        List<LargeCities> list = session.selectList("selectCities");                  for (LargeCities a : list) {                System.out.println("Rank: " + a.getRank() + " Name: " + a.getName());        }} catch (Exception e) {    e.printStackTrace();}

Notice how the Java object is automatically mapped to a database object while calling the ‘insert’ method of our session.

This code inserts the 11th ranking Mumbai into the database and then commits the transaction. Output of the code is given below:

Rank: 1 Name: TokyoRank: 2 Name: SeoulRank: 3 Name: ShanghaiRank: 4 Name: GuangzhouRank: 5 Name: KarachiRank: 6 Name: DelhiRank: 7 Name: Mexico CityRank: 8 Name: BeijingRank: 9 Name: LagosRank: 10 Name: Sao PauloRank: 11 Name: Mumbai

Updating Data

The entry in mapping XML for updating data would look like the following:

<update id="updateCity">        UPDATE largecities SET name = #{name} WHERE rank = #{rank}</update>

Usage of this mapping from our Java code would like:

LargeCities newYork = new LargeCities(); newYork.setRank(11);newYork.setName("New York");session.insert("updateCity", newYork);session.commit();List<LargeCities> list = session.selectList("selectCities");  for (LargeCities a : list) {        System.out.println("Rank: " + a.getRank() + " Name: " + a.getName());}

Again, notice that the Java objects gets mapped to the database object automatically based on our mapping XML.

The output of this program is:

Rank: 1 Name: TokyoRank: 2 Name: SeoulRank: 3 Name: ShanghaiRank: 4 Name: GuangzhouRank: 5 Name: KarachiRank: 6 Name: DelhiRank: 7 Name: Mexico CityRank: 8 Name: BeijingRank: 9 Name: LagosRank: 10 Name: Sao PauloRank: 11 Name: New York

Deleting Data

Now let’s focus on deleting this 11th entry that we inserted and then updated. The mapping XML code is as follows:

<delete id="deleteCity"        DELETE FROM largecities WHERE rank = #{rank}</delete>

Java code will use this mapping as follows:

LargeCities newYork = new LargeCities(); newYork.setRank(11);newYork.setName("New York");session.insert("deleteCity", newYork);session.commit();List<LargeCities> list = session.selectList("selectCities");  for (LargeCities a : list) {        System.out.println("Rank: " + a.getRank() + " Name: " + a.getName());}

The output is now back to the original table that we started with:

Rank: 1 Name: TokyoRank: 2 Name: SeoulRank: 3 Name: ShanghaiRank: 4 Name: GuangzhouRank: 5 Name: KarachiRank: 6 Name: DelhiRank: 7 Name: Mexico CityRank: 8 Name: BeijingRank: 9 Name: LagosRank: 10 Name: Sao Paulo

Drawbacks of Using MyBatis

Because of its database-centric approach, MyBatis doesn’t go very well with applications that have an object-centric design. Also, while MyBatis is very good in data retrieval, with complex domain entities, it can become quite tedious to perform write operations.

MyBatis is designed to use SQL directly, so you can not stay away from writing SQL while using this framework. Because of this low level control, any database change will require manual intervention in your Java code.

Also, because you will be writing SQL yourself, chances of runtime errors are always there. Java compilers will not be able catch errors in SQL and you can be potentially thrown off by non-descriptive JDBC errors.

Dan Langille: Duplicate dependency issues – avoiding duplicate rows

$
0
0
Databases use relational integrity to enforce expected situations. A common scenario is duplicates. Case in point, I present the port_dependencies table: For those not familiar with FreeBSD ports, each port (you could also refer to them as a package or application) can have zero or more dependencies. The FreshPorts database extracts and lists these dependencies [...]

Jean-Jerome Schmidt: Tips & Tricks for Navigating the PostgreSQL Community

$
0
0

This blog is about the PostgreSQL community, how it works and how best to navigate it. Note that this is merely an overview ... there is a lot of existing documentation.

Overview of the Community, How Development Works

PostgreSQL is developed and maintained by a globally-dispersed network of highly skilled volunteers passionate about relational database computing referred to as the PostgreSQL Global Development Group. A handful of core team members together handle special responsibilities like coordinating release activities, special internal communications, policy announcements, overseeing commit privileges and the hosting infrastructure, disciplinary and other leadership issues as well as individual responsibility for specialty coding, development, and maintenance contribution areas. About forty additional individuals are considered major contributors who have, as the name implies, undertaken comprehensive development or maintenance activities for significant codebase features or closely related projects. And several dozen more individuals are actively making various other contributions. Aside from the active contributors, a long list of past contributors are recognized for work on the project. It is the skill and high standards of this team that has resulted in the rich and robust feature set of PostgreSQL.

Many of the contributors have full-time jobs that relate directly to PostgreSQL or other Open Source software, and the enthusiastic support of their employers makes their enduring engagement with the PostgreSQL community feasible.

Contributing individuals coordinate using collaboration tools such as Internet Relay Chat (irc://irc.freenode.net/PostgreSQL) and PostgreSQL community mailing lists (https://www.PostgreSQL.org/community/lists). If you are new to IRC or mailing lists, then make an effort specifically to read up on etiquette and protocols (one good article appears at https://fedoramagazine.org/beginners-guide-irc/), and after you join, spend some time just listening to on-going conversations and search the archives for previous similar questions before jumping in with your own issues.

Note that the team is not static: Anyone can become a contributor by, well, contributing … but your contribution will be expected to meet those same high standards!

The team maintains a Wiki page (https://wiki.postgresql.org/) that, amongst a lot of very detailed and helpful information like articles, tutorials, code snippets and more, presents a TODO list of PostgreSQL bugs and feature requests and other areas where effort might be needed. If you want to be part of the team, this is a good place to browse. Items are added only after thorough discussion on the developer mailing list.

The community follows a process, visualized as the steps in Figure 1.

Figure 1. Conceptualized outline of the PostgreSQL development process.

That is, the value of any non-trivial new code implementation is expected to be first discussed and deemed (by consensus) desirable. Then investment is made in design: design of the interface, syntax, semantics and behaviors, and consideration of backward compatibility issues. You want to get buy-in from the developer community on what is the problem to be solved and what this implementation will accomplish. You definitely do NOT want to go off and develop something in a vacuum on your own. There’s literally decades worth of very high quality collective experience embodied in the team, and you want, and they expect, to have ideas vetted early.

The PostgreSQL source code is stored and managed using the Git version control system, so a local copy can be checked out from https://git.postgresql.org/ to commence implementation. Note that for durable maintainability, patches must blend in with surrounding code and follow the established coding conventions (http://developer.postgresql.org/pgdocs/postgres/source.html), so it is a good idea to study any similar code sections to learn and emulate the conventions. Generally, the standard format BSD style is used. Also, be sure to update documentation as appropriate.

Testing involves first making sure existing regression tests succeed and that there are no compiler warnings, but also adding corresponding new tests to exercise the newly-implemented feature(s).

When the new functionality implementation in your local repository is complete, use the Git diff functionality to create a patch. Patches are submitted via email to the pgsql-hackers mailing list for review and comments, but you don’t have to wait until your work is complete … smart practise would be to ask for feedback incrementally. The Wiki page describes expectations as to format and helpful explanatory context and how to show respect for code reviewer’s time.

The core developers periodically schedule commit fests, during which all accumulated unapplied patches are added to the source code repository by authorized committers. As a contributor, your code will have undergone rigorous review and likely your own developer skills will be the better for it. To return the favor, there is an expectation that you will devote time to reviewing patches from others.

ClusterControl
Single Console for Your Entire Database Infrastructure
Find out what else is new in ClusterControl

Top Websites to Get Information or Learn PostgreSQL

Community Website - this is the main launching place into life with PostgreSQLhttps://www.postgresql.org/
Wiki - Wide-ranging topics related to PostgreSQLhttps://wiki.postgresql.org/
IRC Channel - Developers are active participants hereirc://irc.freenode.net/PostgreSQL
Source code repositoryhttps://git.postgresql.org/
pgAdmin GUI clienthttps://www.pgadmin.org/
Biographies of significant community membershttps://www.postgresql.org/community/contributors/
Eric Raymond’s famous post on smart questionshttp://www.catb.org/esr/faqs/smart-questions.html
Database schema change controlhttp://sqitch.org/
Database unit testinghttp://pgtap.org/

The Few Tools You Can’t Live Without

The fundamental command line tools for working with a PostgreSQL database are part of the normal distribution. The workhorse is the psql command line utility, which provides an interactive interface with lots of functionality for querying, displaying, and modifying database metadata, as well as executing data definition (DDL) and data manipulation (DML) statements.

Other included utilities of note include pg_basebackup for establishing a baseline for replication-based backup, pg_dump for extracting a database into a script file or other archive file, pg_restore for restoring a from a pg_dump archive, and others. All of these tools have excellent manual pages as well as being detailed in the standard documentation and numerous on-line tutorials.

pgAdmin is a very popular graphical user interface tool that provides similar functionality as the psql command line utility, but with point-and-click convenience. Figure 2 shows a screenshot of pgAdmin III. On the left is a panel showing all the database objects in the cluster on the attached-to host server. You can drill down into the structure to list all databases, schemas, tables, views, functions, etc, and even open tables and views to examine the contained data. For each object, the tool will create the SQL DML for dropping and re-creating the object, too, as shown on the lower right panel. This is a convenient way to make modifications during database development.

Figure 2. The pgAdmin III utility.

A couple of my favorites tools for application developer teams are Sqitch (http://sqitch.org/), for database change control, and pgTAP (http://pgtap.org/). Sqitch enables stand-alone change management and iterative development by means of scripts written in the SQL dialect native to your implementation, not just PostgreSQL. For each database design change, you write three scripts: one to deploy the change, one to undo the change in case reverting to a previous version is necessary, and one to verify or test the change. The scripts and related files can be maintained in your revision control system right alongside your application code. PgTAP is a testing framework that includes a suite of functionality for verifying integrity of the database. All the pgTAP scripts are similarly plain text files compliant with normal revision management and change control processes. Once I started using these two tools, I found it hard to imagine ever again doing database work without.

Tips and Tricks

The PostgreSQL general mailing list is the most active of the various community lists and is the main community interface for free support to users. A pretty broad range of questions appear on this list, sometimes generating lengthy back-and-forth, but most often getting quick, informative, and to-the-point responses.

When posting a question related to using PostgreSQL, you generally want to always include background information including the version of PostgreSQL you are using (listed by the psql command line tool with “psql --version”), the operating system on which the server is running, and then maybe a description of the operating environment, such as whether it may be predominately read heavy or write heavy, typical number of users and concurrency concerns, changes you have made from the default server configuration (i.e., the pg_hba.conf and postgresql.conf files), etc. Oftentimes, a description of what you are trying to accomplish is valuable, rather than some obtuse analogy, as you may well get suggestions for improvement that you had not even thought of on your own. Also, you will get the best response if you include actual DDL, DML, and sample data illustrating the problem and facilitating others to recreate what you are seeing -- yes, people will actually run your sample code and work with you.

Additionally, if you are asking about improving query performance, you will want to provide the query plan, i.e., the EXPLAIN output. This is generated by running your query unaltered except for prefixing it literally with the word “EXPLAIN”, as shown in Figure 3 in the pgAdmin tool or the psql command line utility.

Figure 3. Producing a query plan with EXPLAIN.

Under EXPLAIN, instead of actually running the query, the server returns the query plan, which lists detailed output of how the query will be executed, including which indexes will be used to optimize data access, where table scans might happen, and estimates of the cost and amount of data involved with each step. The kind of help you will get from the experienced practitioners monitoring the mailing list may pinpoint issues and help to suggest possible new indexes or changes to the filtering or join criteria.

Lastly, when participating in mailing list discussions there are two important things you want to keep in mind.

First, the mail list server is set up to send messages configured so that when you reply, by default your email software will reply only to the original message author. To be sure your message goes to the list, you must use your mail software “reply-all” feature, which will then include both the message author and the list address.

Second, the convention on the PostgreSQL mailing lists is to reply in-line and to NOT TOP POST. This last point is a long-standing convention in this community, and for many newcomers seems unusual enough that gentle admonishments are very common. Opinions vary on how much of the original message to retain for context in your reply. Some people chafe at the sometimes unwieldy growth in size of the message when the entire original message is retained in lots of back-and-forth discussion. Me personally, I like to delete anything that is not relevant to what specifically I am replying to so as to keep the message terse and focussed. Just bear in mind that there is decades of mailing list history retained on-line for historical documentation and future research, so retaining context and flow IS considered very important.

This article gets you started, now go forth, and dive in!

Simon Riggs: PostgreSQL – The most loved RDBMS

$
0
0

The 2018 StackOverflow survey has just been published, with good news for PostgreSQL.
https://insights.stackoverflow.com/survey/2018/#technology-most-loved-dreaded-and-wanted-databases

StackOverflow got more than 100,000 responses from people in a comprehensive 30 minute survey.

PostgreSQL is the third most commonly used database, with 33% of respondents, slightly behind MySQL and SQLServer, yet well ahead of other options. Early in January, the DBEngines results showed PostgreSQL in 4th place behind Oracle, yet here we see that actually Oracle heads up the Most Dreaded list along with DB2, leaving PostgreSQL to power through to 3rd place.

PostgreSQL at 62% is the second most loved database, so close behind Redis (on 64%) that they’re almost even. But then Redis is only used by 18.5% of people and its very much a different beast anyway – yes, its a datastore, but not a full functioned database like PostgreSQL and others.

Notice that neither MySQL nor SQLServer are well loved, yet enough people use them that we can be pretty certain of that as a collective opinion.

Later we learn that SQLServer has a strong correlation with C# and that MySQL has a strong correlation with PHP/HTML/CSS/WordPress, so they are both the main database choice for those software stacks. What’s interesting there is that PostgreSQL doesn’t have any correlation towards Java, Python, Ruby etc. Or if I might interpret that differently, it is equally popular amongst developers from all languages who aren’t already using LAMP or MS stacks.

SQL is the 4th most pervasive language in use, behind Javascript, HTML and CSS. At 58.5% it is way ahead of 5th place Java at 45%.

Later we learn that 57.5% of people love SQL, which is pretty much everyone that uses it.

We’ll do some more analysis when the anonymized data is available, just to double check these analyses.

Laurenz Albe: Three reasons why VACUUM won’t remove dead rows from a table

$
0
0

Why VACUUM?

Unlock the tremendous energy of the vacuum!
© xkcd.xom (Randall Munroe) under the Creative Commons Attribution-NonCommercial 2.5 License

Whenever rows in a PostgreSQL table are updated or deleted, dead rows are left behind. VACUUM gets rid of them so that the space can be reused. If a table doesn’t get vacuumed, it will get bloated, which wastes disk space and slows down sequential table scans (and – to a smaller extent – index scans).

VACUUM also takes care of freezing table rows so to avoid problems when the transaction ID counter wraps around, but that’s a different story.

Normally you don’t have to take care of all that, because the autovacuum daemon built into PostgreSQL does that for you.

The problem

If your tables get bloated, the first thing you check is whether autovacuum has processed them or not:

SELECT schemaname, relname, n_live_tup, n_dead_tup, last_autovacuum
FROM pg_stat_all_tables
ORDER BY n_dead_tup
    / (n_live_tup
       * current_setting('autovacuum_vacuum_scale_factor')::float8
          + current_setting('autovacuum_vacuum_threshold')::float8)
     DESC
LIMIT 10;

If your bloated table does not show up here, n_dead_tup is zero and last_autovacuum is NULL, you might have a problem with the statistics collector.

If the bloated table is right there on top, but last_autovacuum is NULL, you might need to configure autovacuum to be more aggressive so that it gets done with the table.

But sometimes the result will look like this:

 schemaname |    relname   | n_live_tup | n_dead_tup |   last_autovacuum
------------+--------------+------------+------------+---------------------
 laurenz    | vacme        |      50000 |      50000 | 2018-02-22 13:20:16
 pg_catalog | pg_attribute |         42 |        165 |
 pg_catalog | pg_amop      |        871 |        162 |
 pg_catalog | pg_class     |          9 |         31 |
 pg_catalog | pg_type      |         17 |         27 |
 pg_catalog | pg_index     |          5 |         15 |
 pg_catalog | pg_depend    |       9162 |        471 |
 pg_catalog | pg_trigger   |          0 |         12 |
 pg_catalog | pg_proc      |        183 |         16 |
 pg_catalog | pg_shdepend  |          7 |          6 |
(10 rows)

Here autovacuum has recently run, but it didn’t free the dead tuples!

We can verify the problem by running VACUUM (VERBOSE):

test=> VACUUM (VERBOSE) vacme;
INFO:  vacuuming "laurenz.vacme"
INFO:  "vacme": found 0 removable, 100000 nonremovable row versions in
       443 out of 443 pages
DETAIL:  50000 dead row versions cannot be removed yet,
         oldest xmin: 22300
There were 0 unused item pointers.
Skipped 0 pages due to buffer pins, 0 frozen pages.
0 pages are entirely empty.
CPU: user: 0.01 s, system: 0.00 s, elapsed: 0.01 s.

Why won’t VACUUM remove the dead rows?

VACUUM can only remove those row versions (also known as “tuples”) that are not needed any more. A tuple is not needed if the transaction ID of the deleting transaction (as stored in the xmax system column) is older than the oldest transaction still active in the PostgreSQL database (or the whole cluster for shared tables).

This value (22300 in the VACUUM output above) is called the “xmin horizon”.

There are three things that can hold back this xmin horizon in a PostgreSQL cluster:

  1. Long-running transactions:

    You can find those and their xmin value with the following query:

    SELECT pid, datname, usename, state, backend_xmin
    FROM pg_stat_activity
    WHERE backend_xmin IS NOT NULL
    ORDER BY age(backend_xmin) DESC;
    

    You can use the pg_terminate_backend() function to terminate the database session that is blocking your VACUUM.

  2. Abandoned replication slots:

    A replication slot is a data structure that keeps the PostgreSQL server from discarding information that is still needed by a standby server to catch up with the primary.

    If replication is delayed or the standby server is down, the replication slot will prevent VACUUM from deleting old rows.

    You can find all replication slots and their xmin value with this query:

    SELECT slot_name, slot_type, database, xmin
    FROM pg_replication_slots
    ORDER BY age(xmin) DESC;
    

    Use the pg_drop_replication_slot() function to drop replication slots that are no longer needed.

  3. Orphaned prepared transactions:

    During two-phase commit, a distributed transaction is first prepared with the PREPARE statement and then committed with the COMMIT PREPARED statement.

    Once a transaction has been prepared, it is kept “hanging around” until it is committed or aborted. It even has to survive a server restart! Normally, transactions don’t remain in the prepared state for long, but sometimes things go wrong and a prepared transaction has to be removed manually by an administrator.

    You can find all prepared transactions and their xmin value with the following query:

    SELECT gid, prepared, owner, database, transaction AS xmin
    FROM pg_prepared_xacts
    ORDER BY age(transaction) DESC;
    

    Use the ROLLBACK PREPARED SQL statement to remove prepared transactions.

The post Three reasons why VACUUM won’t remove dead rows from a table appeared first on Cybertec.

Jean-Jerome Schmidt: Key Things to Monitor in PostgreSQL - Analyzing Your Workload

$
0
0

Key Things to Monitor in PostgreSQL - Analyzing Your Workload

In computer systems, monitoring is the process of gathering metrics, analyzing, computing statistics and generating summaries and graphs regarding the performance or the capacity of a system, as well as generating alerts in case of unexpected problems or failures which require immediate attention or action. Therefore, monitoring has two uses: one for historic data analysis and presentation which help us identify medium and long term trends within our system and thus help us plan for upgrades, and a second one for immediate action in case of trouble.

Monitoring helps us identify problems and react to those problems concerning a wide range of fields such as:

  • Infrastructure/Hardware (physical or virtual)
  • Network
  • Storage
  • System Software
  • Application Software
  • Security

Monitoring is a major part of the work of a DBA. PostgreSQL, traditionally, has been known to be “low-maintenance” thanks to its sophisticated design and this means that the system can live with low attendance when compared to other alternatives. However, for serious installations where high availability and performance are of key importance, the database system has to be regularly monitored.

The role of the PostgreSQL DBA can step up to higher levels within the company’s hierarchy besides strictly technical: apart from basic monitoring and performance analysis,  must be able to spot changes in usage patterns, identify the possible causes, verify the assumptions and finally translate the findings in business terms. As an example, the DBA must be able to identify some sudden change in a certain activity that might be linked to a possible security threat. So the role of the PostgreSQL DBA is a key role within the company, and must work closely with other departmental heads in order to identify and solve problems that arise. Monitoring is a great part of this responsibility.

PostgreSQL provides many out of the box tools to help us gather and analyze data. In addition, due to its extensibility, it provides the means to develop new modules into the core system.

PostgreSQL is highly dependent on the system (hardware and software) it runs on. We cannot expect a PostgreSQL server to perform good if there are problems in any of the vital components in the rest of the system. So the role of the PostgreSQL DBA overlaps with the role of the sysadmin. Below, as we examine what to watch in PostgreSQL monitoring, we will encounter both system-dependent variables and metrics as well as PostgreSQL’s specific figures.

Monitoring does not come for free. A good investment must be put in it by the company/organization with a commitment to manage and maintain the whole monitoring process. It also adds a slight load on the PostgreSQL server as well. This is little to worry about if everything is configured correctly, but we must keep in mind that this can be another way to misuse the system.

System Monitoring Basics

Important variables in System monitoring are:

  • CPU Usage
  • Network Usage
  • Disk Space / Disk Utilization
  • RAM Usage
  • Disk IOPS
  • Swap space usage
  • Network Errors

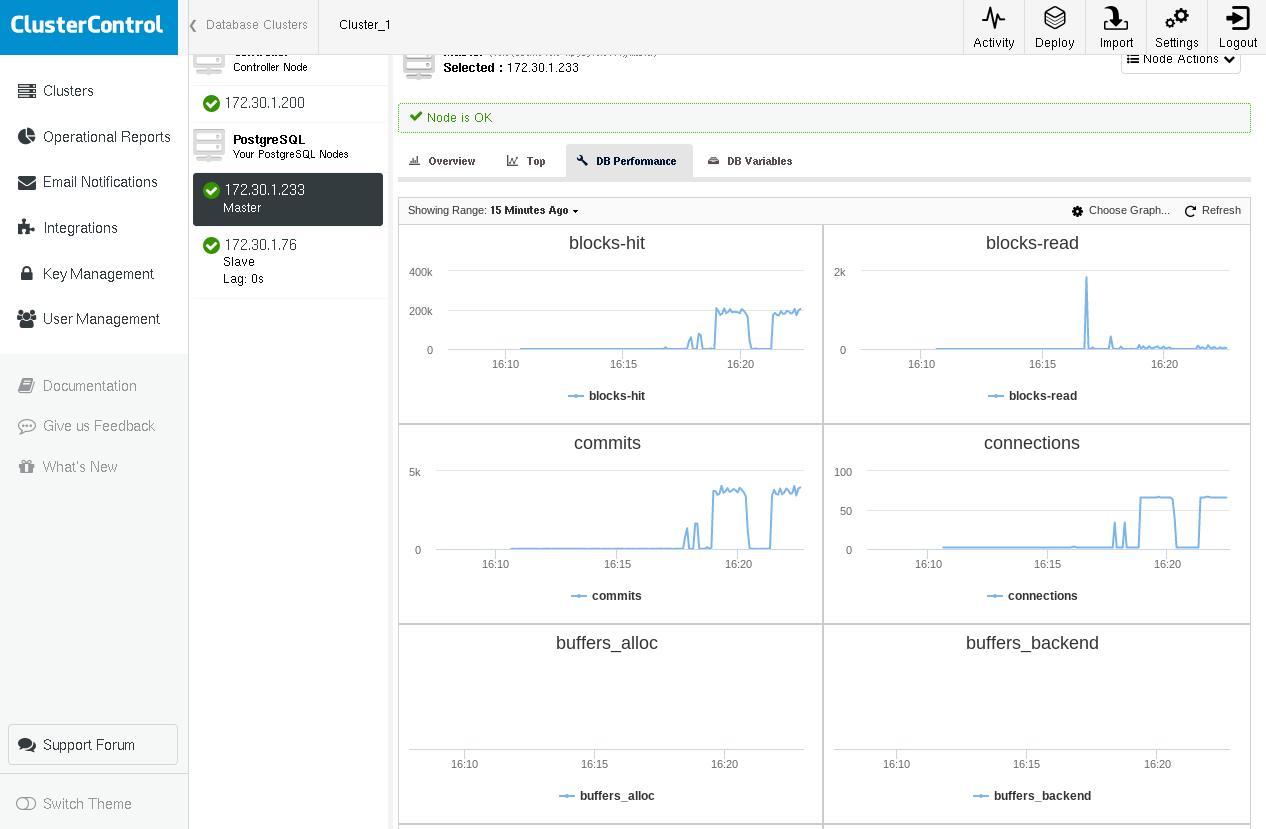
Here is an example of ClusterControl showing graphs for some critical PostgreSQL variables coming from pg_stat_database and pg_stat_bgwriter (which we will cover in the following paragraphs) while running pgbench -c 64 -t 1000 pgbench twice:

We notice that we have a peak on blocks-read in the first run, but we get close to zero during the second run as all blocks are found in shared_buffers.

Other variables of interest are paging activity, interrupts, context switches, among others. There is a plethora of tools to use in Linux/BSDs and unix or unix-like systems. Some of them are:

  • ps: for a list of the processes running

  • top/htop/systat: for system (CPU / memory) utilization monitoring

  • vmstat: for general system activity (including virtual memory) monitoring

  • iostat/iotop/top -mio: for IO monitoring

  • ntop: for network monitoring

Here is an example of vmstat on a FreeBSD box during a query which requires some disk reads and also some computation:

procs  memory      page                         disks      faults          cpu
r b w  avm   fre   flt   re  pi  po   fr    sr  ad0 ad1  in     sy    cs us sy id
0 0 0  98G  666M   421   0   0   0   170  2281    5  0  538   6361  2593  1  1 97
0 0 0  98G  665M   141   0   0   0     0  2288   13  0  622  11055  3748  3  2 94
--- query starts here ---
0 0 0  98G  608M   622   0   0   0   166  2287 1072  0 1883  16496 12202  3  2 94
0 0 0  98G  394M   101   0   0   0     2  2284 4578  0 5815  24236 39205  3  5 92
2 0 0  98G  224M  4861   0   0   0  1711  2287 3588  0 4806  24370 31504  4  6 91
0 0 0  98G  546M    84 188   0   0 39052 41183 2832  0 4017  26007 27131  5  7 88
2 0 0  98G  469M   418   0   0   1   397  2289 1590  0 2356  11789 15030  2  2 96
0 0 0  98G  339M   112   0   0   0   348  2300 2852  0 3858  17250 25249  3  4 93
--- query ends here ---
1 0 0  98G  332M  1622   0   0   0   213  2289    4  0  531   6929  2502  3  2 95

Repeating the query we would not notice any new burst in disk activity since those blocks of disk would already be in the OS’s cache. Although, the PostgreSQL DBA must be able to fully understand what is happening in the underlying infrastructure where the database runs, more complex system monitoring is usually a job for the sysadmin, as this is a large topic in itself.

In linux, a very handy shortcut for the top utility is pressing “C”, which toggles showing the command line of the processes. PostgreSQL by default rewrites the command line of the backends with the actual SQL activity they are running at the moment and also the user.

PostgreSQL Monitoring Basics

Important variables in PostgreSQL monitoring are:

  • Buffer cache performance (cache hits vs disk reads)
  • Number of commits
  • Number of connections
  • Number of sessions
  • Checkpoints and bgwriter statistics
  • Vacuums
  • Locks
  • Replication
  • And last but definitely not least, queries

Generally there are two ways in a monitoring setup to perform data collection:

  • To acquire data via a Log
  • To acquire data by querying PostgreSQL system

Log file-based data acquisition depends on the (properly configured) PostgreSQL log. We can use this kind of logging for “off-line” processing of the data. Log file-based monitoring is best suited when minimal overhead to the PostgreSQL server is required and when we don’t care about live data or about getting live alerts (although live monitoring using log file data can be possible by e.g. directing postgresql log to syslog and then streaming syslog to another server dedicated for log processing).

ClusterControl
Single Console for Your Entire Database Infrastructure
Find out what else is new in ClusterControl

PostgreSQL Statistics Collector

PostgreSQL provides a rich set of views and functions readily available via the Statistics Collector subsystem. Again those data are divided in two categories:

  • Dynamic information on what the system is doing at the moment.
  • Statistics accumulated since the statistics collector subsystem was last reset.

Dynamic statistics views provide info about current activity per process (pg_stat_activity), status of physical replication (pg_stat_replication), status of physical standby (pg_stat_wal_receiver) or logical (pg_stat_subscription), ssl (pg_stat_ssl) and vacuum (pg_stat_progress_vacuum).

Collected statistics views provide info about important background processes such as the wal archiver, the bgwriter, and database objects: user or system tables, indexes, sequences and functions as well as the databases themselves.

It should be quite obvious by now that there are multiple ways to categorize data related to monitoring:

  • By source:
    • System tools (ps, top, iotop, etc)
    • PgSQL Log file
    • Database
      • Dynamic
      • Collected
  • By specific database operation:
    • Buffer cache
    • Commits
    • Queries
    • Sessions
    • Checkpoints
    • Etc

After reading this article and experimenting with the notions, concepts and terms presented, you should be able to make a 2D matrix with all the possible combinations. As an example, the specific PostgreSQL activity (SQL command) can be found using: ps or top (system utilities), the PostgreSQL log files, pg_stat_activity (dynamic view), but also using pg_stat_statements an extension found in contrib (collected stats view). Likewise, information about locks can be found in the PostgreSQL log files, pg_locks and pg_stat_activity (presented just below) using wait_event and wait_event_type. Because of this, it is difficult covering the vast area of monitoring in a uni-dimensional linear fashion, and the author risks creating confusion to the reader because of this. In order to avoid this we will cover monitoring roughly by following the course of the official documentation, and adding related information as needed.

Dynamic Statistics Views

Using pg_stat_activity we are able to see what is the current activity by the various backend processes. For instance if we run the following query on table parts with about 3M rows:

testdb=# \d parts
                         Table "public.parts"
   Column   |          Type          | Collation | Nullable | Default
------------+------------------------+-----------+----------+---------
 id         | integer                |           |          |
 partno     | character varying(20)  |           |          |
 partname   | character varying(80)  |           |          |
 partdescr  | text                   |           |          |
 machine_id | integer                |           |          |
 parttype   | character varying(100) |           |          |
 date_added | date                   |           |          |

And lets run the following query, which needs some seconds to complete:

testdb=# select avg(age(date_added)) FROM parts;

By opening a new terminal and running the following query, while the previous is still running, we get:

testdb=# select pid,usename,application_name,client_addr,backend_start,xact_start,query_start,state,backend_xid,backend_xmin,query,backend_type from pg_stat_activity where datid=411547739 and usename ='achix' and state='active';
-[ RECORD 1 ]----+----------------------------------------
pid              | 21305
usename          | achix
application_name | psql
client_addr      |
backend_start    | 2018-03-02 18:04:35.833677+02
xact_start       | 2018-03-02 18:04:35.832564+02
query_start      | 2018-03-02 18:04:35.832564+02
state            | active
backend_xid      |
backend_xmin     | 438132638
query            | select avg(age(date_added)) FROM parts;
backend_type     | background worker
-[ RECORD 2 ]----+----------------------------------------
pid              | 21187
usename          | achix
application_name | psql
client_addr      |
backend_start    | 2018-03-02 18:02:06.834787+02
xact_start       | 2018-03-02 18:04:35.826065+02
query_start      | 2018-03-02 18:04:35.826065+02
state            | active
backend_xid      |
backend_xmin     | 438132638
query            | select avg(age(date_added)) FROM parts;
backend_type     | client backend
-[ RECORD 3 ]----+----------------------------------------
pid              | 21306
usename          | achix
application_name | psql
client_addr      |
backend_start    | 2018-03-02 18:04:35.837829+02
xact_start       | 2018-03-02 18:04:35.836707+02
query_start      | 2018-03-02 18:04:35.836707+02
state            | active
backend_xid      |
backend_xmin     | 438132638
query            | select avg(age(date_added)) FROM parts;
backend_type     | background worker

The pg_stat_activity view gives us info about the backend process, the user, the client, the transaction, the query, the state as well as a comprehensive info about the waiting status of the query.

But why 3 rows? In versions >=9.6, if a query can be run in parallel, or portions of it can be run in parallel, and the optimizer thinks that parallel execution is the fastest strategy, then it creates a Gather or Gather Merge node, and then requests at most max_parallel_workers_per_gather background worker processes, which by default is 2, hence the 3 rows we see in the output above. We can tell apart the client backend process from the background worker by using the backend_type column. For the pg_stat_activity view to be enabled you’ll have to make sure that the system configuration parameter track_activities is on. The pg_stat_activity provides rich information in order to determine blocked queries by the use of wait_event_type and wait_event columns.

A more refined way to monitor statements is via the pg_stat_statements contrib extension, mentioned earlier. On a recent Linux system (Ubuntu 17.10, PostgreSQL 9.6), this can be installed fairly easy:

testdb=# create extension pg_stat_statements ;
CREATE EXTENSION
testdb=# alter system set shared_preload_libraries TO 'pg_stat_statements';
ALTER SYSTEM
testdb=# \q
postgres@achix-dell:~$ sudo systemctl restart postgresql
postgres@achix-dell:~$ psql testdb
psql (9.6.7)
Type "help" for help.

testdb=# \d pg_stat_statements

Let’s create a table with 100000 rows, and then reset pg_stat_statements, restart the PostgreSQL server, perform a select on this table on the (still cold) system, and then see the contents of pg_stat_statements for the select:

testdb=# select 'descr '||gs as descr,gs as id into medtable from  generate_series(1,100000) as gs;
SELECT 100000
testdb=# select pg_stat_statements_reset();
 pg_stat_statements_reset
--------------------------
 
(1 row)

testdb=# \q
postgres@achix-dell:~$ sudo systemctl restart postgresql
postgres@achix-dell:~$ psql testdb -c 'select * from medtable' > /dev/null
testdb=# select shared_blks_hit,shared_blks_read from pg_stat_statements where query like '%select%from%medtable%';
 shared_blks_hit | shared_blks_read
-----------------+------------------
               0 |              541
(1 row)

testdb=#

Now let’s perform the select * once more and then look again in the contents of pg_stat_statements for this query:

postgres@achix-dell:~$ psql testdb -c 'select * from medtable' > /dev/null
postgres@achix-dell:~$ psql testdb
psql (9.6.7)
Type "help" for help.

testdb=# select shared_blks_hit,shared_blks_read from pg_stat_statements where query like '%select%from%medtable%';
 shared_blks_hit | shared_blks_read
-----------------+------------------
             541 |              541
(1 row)

So, the second time the select statement finds all the required blocks in the PostgreSQL shared buffers, and pg_stat_statements reports this via shared_blks_hit. pg_stat_statements provides info about the total number of calls of a statement, the total_time, min_time, max_time and mean_time, which can be extremely helpful when trying to analyze the workload of your system. A slow query that is run very frequently should require immediate attention. Similarly, consistently low hit rates may signify the need to review the shared_buffers setting.

pg_stat_replication provides info on the current status of replication for each wal_sender. Let’s suppose we have setup a simple replication topology with our primary and one hot standby, then we may query pg_stat_replication on the primary (doing the same on the standby will yield no results unless we have setup cascading replication and this specific standby serves as an upstream to other downstream standbys) to see the current status of replication:

testdb=# select * from pg_stat_replication ;
-[ RECORD 1 ]----+------------------------------
pid              | 1317
usesysid         | 10
usename          | postgres
application_name | walreceiver
client_addr      | 10.0.2.2
client_hostname  |
client_port      | 48192
backend_start    | 2018-03-03 11:59:21.315524+00
backend_xmin     |
state            | streaming
sent_lsn         | 0/3029DB8
write_lsn        | 0/3029DB8
flush_lsn        | 0/3029DB8
replay_lsn       | 0/3029DB8
write_lag        |
flush_lag        |
replay_lag       |
sync_priority    | 0
sync_state       | async

The 4 columns sent_lsn, write_lsn, flush_lsn, replay_lsn tell us the exact WAL position at each stage of the replication process at the remote standby. Then we create some heavy traffic on the primary with a command like:

testdb=# insert into foo(descr) select 'descr ' || gs from generate_series(1,10000000) gs;

And look at pg_stat_replication again:

postgres=# select * from pg_stat_replication ;
-[ RECORD 1 ]----+------------------------------
pid              | 1317
usesysid         | 10
usename          | postgres
application_name | walreceiver
client_addr      | 10.0.2.2
client_hostname  |
client_port      | 48192
backend_start    | 2018-03-03 11:59:21.315524+00
backend_xmin     |
state            | streaming
sent_lsn         | 0/D5E0000
write_lsn        | 0/D560000
flush_lsn        | 0/D4E0000
replay_lsn       | 0/C5FF0A0
write_lag        | 00:00:04.166639
flush_lag        | 00:00:04.180333
replay_lag       | 00:00:04.614416
sync_priority    | 0
sync_state       | async

Now we see that we have a delay between the primary and the standby depicted in the sent_lsn, write_lsn, flush_lsn, replay_lsn values. Since PgSQL 10.0 the pg_stat_replication also shows the lag between a recently locally flushed WAL and the time it took to be remotely written, flushed and replayed respectively. Seeing nulls in those 3 columns means that the primary and the standby are in sync.

The equivalent of pg_stat_replication on the standby side is called: pg_stat_wal_receiver:

testdb=# select * from pg_stat_wal_receiver ;
-[ RECORD 1 ]---------+----------------------------------------------------------------------------------------------------------------------------------------------------------------------------------------------------
pid                   | 17867
status                | streaming
receive_start_lsn     | 0/F000000
receive_start_tli     | 1
received_lsn          | 0/3163F210
received_tli          | 1
last_msg_send_time    | 2018-03-03 13:32:42.516551+00
last_msg_receipt_time | 2018-03-03 13:33:28.644394+00
latest_end_lsn        | 0/3163F210
latest_end_time       | 2018-03-03 13:32:42.516551+00
slot_name             | fbsdclone
conninfo              | user=postgres passfile=/usr/local/var/lib/pgsql/.pgpass dbname=replication host=10.0.2.2 port=20432 fallback_application_name=walreceiver sslmode=disable sslcompression=1 target_session_attrs=any

testdb=#

When there is no activity, and the standby has replayed everything then latest_end_lsn must be equal to sent_lsn on the primary (and all intermediate log sequence numbers).

Similarly to physical replication, in the case of logical replication, where the role of the primary is taken by the publisher, and the role of the standby is taken by the subscriber, naturally the role of pg_stat_wal_receiver is taken by pg_stat_subscription. We can query pg_stat_subscription as follows:

testdb=# select * from pg_stat_subscription ;
-[ RECORD 1 ]---------+------------------------------
subid                 | 24615
subname               | alltables_sub
pid                   | 1132
relid                 |
received_lsn          | 0/33005498
last_msg_send_time    | 2018-03-03 17:05:36.004545+00
last_msg_receipt_time | 2018-03-03 17:05:35.990659+00
latest_end_lsn        | 0/33005498
latest_end_time       | 2018-03-03 17:05:36.004545+00

Note that on the publisher side, the corresponding view is the same as in the case of physical replication: pg_stat_replication.

Collected Statistics Views

pg_stat_archiver view has one row which gives info about the wal archiver. Keeping a snapshot of this row at regular intervals lets you calculate the size of the WAL traffic between those intervals. Also it gives info about failures while archiving WAL files.

pg_stat_bgwriter view gives very important information on the behavior of:

  • The checkpointer
  • The background writer
  • The (client serving) backends

Since this view gives accumulative data since the last reset It is very useful to create another timestamped table with periodic snapshots of pg_stat_bgwriter, so that it will be easy to get an incremental perspective between two snapshots. Tuning is a science (or magic), and it requires extensive logging and monitoring as well as a clear understanding of the underlying concepts and PostgreSQL internals in order to have good results, and this view is where to start, looking for things such as:

  • Are the checkpoints_timed the vast majority of the total checkpoints? If not then actions must be taken, results measured, and iterate the whole process until no improvements are found.
  • Are the buffers_checkpoint a good majority over the other two kinds (buffers_clean but most importantly buffers_backend) ? If buffers_backend are high, then again, certain configurations parameters must be changed, new measurements to be taken and reassessed.

Pg_stat_[user|sys|all]_tables

The most basic usage of those views is to verify that our vacuum strategy works as expected. Large values of dead tuples relative to live tuples signifies inefficient vacuuming. Those views also provide info on seq vs index scans and fetches, info about num of rows inserted, updated, deleted as well as HOT updates. You should try to keep the number of HOT updates as high as possible in order to improve performance.

Pg_stat_[user|sys|all]_indexes

Here the system stores and shows info on individual index usage. One thing to keep in mind is that idx_tup_read is more accurate than idx_tup_fetch. Non PK/ non unique Indexes with low idx_scan should be considered for removal, since they only hinder HOT updates. As mentioned in the previous blog, over-indexing should be avoided, indexing comes at a cost.

Pg_statio_[user|sys|all]_tables

In those views we can find info on the performance of the cache regarding table heap reads, index reads and TOAST reads. A simple query to count for the percentage of hits, and the distribution of the hits across tables would be:

with statioqry as (select relid,heap_blks_hit,heap_blks_read,row_number() OVER (ORDER BY 100.0*heap_blks_hit::numeric/(heap_blks_hit+heap_blks_read) DESC),COUNT(*) OVER () from pg_statio_user_tables where heap_blks_hit+heap_blks_read >0)
select relid,row_number,100.0*heap_blks_hit::float8/(heap_blks_hit+heap_blks_read) as "heap block hits %", 100.0 * row_number::real/count as "In top %" from statioqry order by row_number;
   relid   | row_number | heap block hits % |     In top %      
-----------+------------+-------------------+-------------------
     16599 |          1 |  99.9993058404502 | 0.373134328358209
     18353 |          2 |  99.9992251425738 | 0.746268656716418
     18338 |          3 |    99.99917566565 |  1.11940298507463
     17269 |          4 |  99.9990617323798 |  1.49253731343284
     18062 |          5 |  99.9988021889522 |  1.86567164179104
     18075 |          6 |  99.9985334109273 |  2.23880597014925
     18365 |          7 |  99.9968070500335 |  2.61194029850746
………..
     18904 |        127 |  97.2972972972973 |  47.3880597014925
     18801 |        128 |  97.1631205673759 |  47.7611940298507
     16851 |        129 |  97.1428571428571 |   48.134328358209
     17321 |        130 |  97.0043198249512 |  48.5074626865672
     17136 |        131 |                97 |  48.8805970149254
     17719 |        132 |  96.9791612263018 |  49.2537313432836
     17688 |        133 |   96.969696969697 |  49.6268656716418
     18872 |        134 |  96.9333333333333 |                50
     17312 |        135 |  96.8181818181818 |  50.3731343283582
……………..
     17829 |        220 |  60.2721026527734 |   82.089552238806
     17332 |        221 |  60.0276625172891 |  82.4626865671642
     18493 |        222 |                60 |  82.8358208955224
     17757 |        223 |  59.7222222222222 |  83.2089552238806
     17586 |        224 |  59.4827586206897 |  83.5820895522388

This tells us that at least 50% of the tables have hit rates larger than 96.93%, and 83.5% of the tables have a hit rate better than 59.4%

Pg_statio_[user|sys|all]_indexes

This view contains block read/hit information for indexes.

Pg_stat_database

This view contains one row per database. It shows some of the info of the preceding views aggregated to the whole database (blocks read, blocks hit, info on tups), some information relevant to the whole database (total xactions, temp files, conflicts, deadclocks, read/write time), and finally number of current backends.

Things to look for here are the ratio of blks_hit/(blks_hit + blks_read): the higher the value the better for the system’s I/O. However misses should not necessarily be accounted for disk reads as they may have very well been served by the OS’s filesys cache.

Similarly to other collected statistics views mentioned above, one should create a timestamped version of the pg_stat_database view and have a view at the differences between two consecutive snapshots:

  • Are the number of rollbacks increasing?
  • Or the number of committed xactions?
  • Are we getting way more conflicts than yesterday (this applies to standbys)?
  • Do we have abnormally high numbers of deadlocks?

All those are very important data. The first two might mean some change in some usage pattern, that must be explained. High number of conflicts might mean replication needs some tuning. High number of deadlocks is bad for many reasons. Not only performance is low because transactions get rolled back, but also if an application suffers from deadlocks in a single master topology, the problems will only get amplified if we move to multi-master. In this case, the software engineering department must rewrite the pieces of the code that cause the deadlocks.

Locks

Locking is a very important topic in PostgreSQL and deserves its own blog(s). Nevertheless basic locks monitoring has to be done in the same fashion as the other aspects of monitoring presented above. pg_locks view provides real time information on the current locks in the system. We may catch long waiting locks by setting log_lock_waits, then information on long waiting waits will be logged in the PgSQL log. If we notice unusual high locking which results in long waits then again, as in the case with the deadlocks mentioned above, the software engineers must review any pieces of code that might cause long held locks, e.g. explicit locking in the application (LOCK TABLE or SELECT … FOR UPDATE).

Similarly to the case of deadlocks, a system with short locks will move easier to a multi-master setup.

Craig Kerstiens: Fun with SQL: generate_series in Postgres

$
0
0

There are times within Postgres where you may want to generate sample data or some consistent series of records to join in order for reporting. Enter the simple but handy set returning function of Postgres: generate_series. generate_series as the name implies allows you to generate a set of data starting at some point, ending at another point, and optionally set the incrementing value. generate_series works on two datatypes:

  • integers
  • timestamps

Let’s get started with the most basic example:

SELECT*FROMgenerate_series(1,5);generate_series-----------------12345(5rows)

So generate_series pretty straight-forward, but what interesting ways can it be used?

Generating fake data

By putting our generate_series inside a CTE we can easily now generate a set of numbers and then perform some operation against each value. If we want to generate some fake number we can use random() which generates a random number between 0.0 and 1.0.

WITHnumbersAS(SELECT*FROMgenerate_series(1,5))SELECTgenerate_series*random()FROMnumbers;?column?-------------------0.877643386833370.3451251294463872.103178546763960.9378988035023211.72822773223743(5rows)

Pretty weekly reporting with joins

Aggregating across some time dimension is a fairly common report. A good example might be new users per week. The simplest way to get this would be by leveraging Postgres date_trunc function:

SELECTdate_trunc('week',created_at)count(*)FROMusersGROUPBY1ORDERBY1;

The issue with the above query arises when two cases are true, first you’re charting your data over time and then two you have a week with no sign-ups. In the case of no sign-ups in a week you’d simply miss the 0 on your graph leaving a misleading impression. To smooth this out we go back to generate series and do an outer join on the week:

WITHrange_valuesAS(SELECTdate_trunc('week',min(created_at))asminval,date_trunc('week',max(created_at))asmaxvalFROMusers),week_rangeAS(SELECTgenerate_series(minval,maxval,'1 week'::interval)asweekFROMrange_values),weekly_countsAS(SELECTdate_trunc('week',created_at)asweek,count(*)asctFROMusersGROUPBY1)SELECTweek_range.week,weekly_counts.ctFROMweek_rangeLEFTOUTERJOINweekly_countsonweek_range.week=weekly_counts.week;

What other uses do you have for generate_series

Postgres is has a wealth of hidden gems within it. generate_series is one just one of the handy built-in features of Postgres. If you know of other novel uses for it we’d love to hear about it @citusdata.

Craig Ringer: Dev Corner: error context stack corruption

$
0
0

PostgreSQL uses error context callbacks to allow code paths to annotate errors with additional information. For example, pl/pgsql uses them to add a CONTEXT message reporting the procedure that was executing at the time of the error.

But if you get it wrong when you use one in an extension or a patch to core, it can be quite hard to debug. I’d like to share some hints here for people involved in PostgreSQL’s C core and extensions.

Intro to error contexts

(If you know the postgres backend code, skip to the next heading).

Say you have a function like the following utterly contrived example:

void
my_func(bool do_it)
{
    if (!do_it)
    {
        elog(WARNING, "not doing it!");
        return;
    }

    do_the_thing();
}

and you want to report on errors that occur anywhere in it, even in code called by do_the_thing() that may be far away in different modules of PostgreSQL. So that you know that you reached that code via my_func() and what the value of do_it was.

You can add an error context callback, which pushes a function pointer + optional argument onto the head of a linked list of callbacks. The head is in a global error_context_stack. Typically the entries are stack-allocated, e.g.

struct my_func_ctx_arg
{
    bool do_it;
};
 
static void
my_func_ctx_callback(void *arg)
{
    struct my_func_ctx_arg *ctx_arg = arg;
    errcontext("during my_func(do_it=%d)", ctx_arg->do_it);
}

void
my_func(bool do_it)
{
    ErrorContextCallback myerrcontext;
    struct my_func_ctx_arg ctxinfo;

    ctxinfo.do_it = do_it;
    myerrcontext.callback = my_func_ctx_callback;
    myerrcontext.arg = &ctxinfo
    myerrcontext.previous = error_context_stack;
    error_context_stack = &myerrcontext

    if (!do_it)
    {
        elog(WARNING, "not doing it!");
        return;
    }

    do_the_thing();

    Assert(error_context_stack == &myerrcontext);
    error_context_stack = myerrcontext.previous;
}

It’s a bit verbose, but it gives you much more useful messages in important cases. For example

ERROR: relcache lookup for 2132 failed

isn’t that informative. But something like:

ERROR: relcache lookup for 2132 failed
CONTEXT: in my_extension_func(...) with user_callback_fn="user_func"

gives you a lot more of a hint about where to look.

There’s a bug

Fry from Futurama ponders: "Not sure if I should *facepalm* or *headdesk*"
A day in the life of a developer
OK, so we know what errcontext callbacks are. But when we added the above code, suddenly our postgres starts crashing… sometimes. Backtraces show that the crashes are usually in errfinish(), but in random and unpredictable places.

#0  0x0000000000000014 in ??
#1  0x000000000084bb88 in errfinish (dummy=) at elog.c:439
... some unrelated stack that doesn't mention my_func here ...

Much head scratching occurs. Valgrind is brought to bear, and maybe it complains about an invalid access in elog.c just before the crash, but says the pointed-to memory was not recently allocated or freed, and can’t really tell you anything more than the crash backtrace did.

You can see that the error context stack is mangled in gdb:

(gdb) set print pretty on
(gdb) p * error_context_stack
$4 = {
  previous = 0x4d430004, 
  callback = 0x4d430004, 
  arg = 0x18
}
(gdb) p *error_context_stack->previous
Cannot access memory at address 0x4d430004
(gdb)

but not why. The contents seem to vary randomly and are often null. Printing the memory around the pointer to error_context_stack doesn’t tend to reveal anything that jumps out at you. (Or didn’t to me, anyway; if you did more low level work and asm you might recognise it.)

When I present it like this, you can probably guess why. The problem is in my_func even though it doesn’t appear in any of the crashes, valgrind won’t report on it, etc. And it’s not directly in the new code, so in a larger or more complex function it might be harder to spot.

    if (!do_it)
        return; /*  <--------------------- HERE */

See, on this path we failed to pop the error context stack. So error_context_stack still points inside the now-popped stack frame of myfunc, at myerrcontext. It doesn't point at the code address of myfunc so gdb won't give you a hint like myfunc+12, it's just some random stack space.

If we call ereport or elog now, they'll still work fine because the popped stack's contents aren't immediately overwritten. They'll access released stack frame contents, but valgrind doesn't check for that and won't care or complain.

If at some later stage we make calls that use up that stack space again, we may (or may not, depending on layout details, what the calls are, etc) overwrite the pointed-to memory with something else. At which point if we call ereport or elog we might crash. Or hey, we might not, if whatever's pointed to doesn't fault when treated as instructions.

Especially in an optimised binary, the crash can be unpredictable and come much later than the creation of the problem.

gcc's -fstack-protector-all won't help you either, since there's no stack-overwrite happening. Just a pointer to invalid stack frame contents.

So I thought I'd make this a bit more google-able to save the next person some hassle.
I'm sure this would be blindingly obvious to many people. But in a decent sized code base with a fair few changes across multiple modules, it gets more challenging.

The fix

The fix is trivial once you know where the problem is: pop the error context stack or, preferably, restructure the function to have a single non-error exit path, e.g.


    if (do_it)
        do_the_thing();
    else
        elog(WARNING, "not doing it!");

Yeah, in this contrived example it's hard to imagine why you'd write it any other way in the first place. But single-return isn't always worth the code contortions in more complex logic. And in some places in Pg return may be masked by macros.

Plus, I'm sure you're not the one who wrote the problem code anyway? Right?

git blame buggy_file.c

.... dammit. Yes, you were, you just forgot. Past-me, you write terrible code and your breath smells of onions.

Prevention

I wonder if a static checker could be taught to detect this issue by looking for return-paths? Or, in fact, already does? Hints welcomed, especially for something that won't spew false positives.

Debugging

I edited src/include/pg_config_manual.h to enable USE_VALGRIND. Added this to elog.h:

extern void verify_errcontext_stack(void)

and this to elog.c:

void
verify_errcontext_stack(void)
{
    ErrorContextCallback *econtext;
    for (econtext = error_context_stack;
         econtext != NULL;
         econtext = econtext->previous)
    {
        Assert(econtext != NULL);
#ifdef USE_VALGRIND
        VALGRIND_CHECK_VALUE_IS_DEFINED(econtext);
        Assert(VALGRIND_CHECK_MEM_IS_ADDRESSABLE(econtext, sizeof(ErrorContextCallback)) == 0);
        VALGRIND_CHECK_VALUE_IS_DEFINED(econtext->previous);
        if (econtext->previous != NULL)
        {
            VALGRIND_CHECK_MEM_IS_ADDRESSABLE(econtext->previous, sizeof(ErrorContextCallback));
            VALGRIND_CHECK_VALUE_IS_DEFINED(econtext->previous->callback);
            VALGRIND_CHECK_VALUE_IS_DEFINED(econtext->previous->previous);
        }
#endif
        Assert(econtext->previous == NULL
               || econtext->previous->callback != NULL);
    }
}

then scattered calls to it around elog.c.

This helped detect the fault earlier. It proved important to also build with optimisation entirely disabled:

CFLAGS="-O0 -ggdb -g3" ./configure --prefix=/home/craig/pg/10 --enable-cassert --enable-debug --enable-tap-tests

With these two changes, crashes occurred much closer to the actual callsite, relatively shortly after the problem. If you scatter calls around, particularly before and after calls to any function that sets up an error context, it'll help you narrow things down quickly.

Laurenz Albe: New features for sequences: gains and pitfalls

$
0
0

About sequences

Sequences are used to generate artificial numeric primary key columns for tables.
A sequence provides a “new ID” that is guaranteed to be unique, even if many database sessions are using the sequence at the same time.

Sequences are not transaction safe, because they are not supposed to block the caller. That is not a shortcoming, but intentional.

As a consequence, a transaction that requests a new value from the sequence and then rolls back will leave a “gap” in the values committed to the database. In the rare case that you really need a “gap-less” series of values, a sequence is not the right solution for you.

PostgreSQL’s traditional way of using sequences (nextval('my_seq')) differs from the SQL standard, which uses NEXT VALUE FOR <sequence generator name>.

New developments in PostgreSQL v10

Identity columns

PostgreSQL v10 has introduced the standard SQL way of defining a table with an automatically generated unique value:

GENERATED { ALWAYS | BY DEFAULT } AS IDENTITY [ ( sequence_options ) ]

Here is an example:

CREATE TABLE my_tab (
   id bigint GENERATED BY DEFAULT AS IDENTITY PRIMARY KEY,
   ...
);

Behind the scenes, this uses a sequence, and it is roughly equivalent to the traditional

CREATE TABLE my_tab (
   id bigserial PRIMARY KEY,
   ...
);

which is a shorthand for

CREATE SEQUENCE my_tab_id_seq;

CREATE TABLE my_tab (
   id bigint PRIMARY KEY DEFAULT nextval('my_tab_id_seq'::regclass),
   ...
);

ALTER SEQUENCE my_tab_id_seq OWNED BY my_tab.id;

The problem with such a primary key column is that the generated value is a default value, so if the user explicitly inserts a different value into this column, it will override the generated one.

This is usually not what you want, because it will lead to a constraint violation error as soon as the sequence counter reaches the same value. Rather, you want the explicit insertion to fail, since it is probably a mistake.

For this you use GENERATED ALWAYS:

CREATE TABLE my_tab (
   id bigint GENERATED ALWAYS AS IDENTITY PRIMARY KEY,
   ...
);

You can still override the generated value, but you’ll have to use the OVERRIDING SYSTEM VALUE clause for that, which makes it much harder for such an INSERT to happen by mistake:

INSERT INTO my_tab (id) OVERRIDING SYSTEM VALUE VALUES (42);

New system catalog pg_sequence

Before PostgreSQL v10, a sequence’s metadata (starting value, increment and others) were stored in the sequence itself.

This information is now stored in a new catalog table pg_sequence.

The only data that remain in the sequence are the data changed by the sequence manipulation functions nextval, currval, lastval and setval.

Transactional DDL for sequences

A sequence in PostgreSQL is a “special table” with a single row.

In “normal tables”, an UPDATE does not modify the existing row, but writes a new version of it and marks the old version as obsolete. Since sequence operations should be fast and are never rolled back, PostgreSQL can be more efficient by just modifying the single row of a sequence in place whenever its values change.

Since prior to PostgreSQL v10 all metadata of a sequence were kept in the sequence (as explained in the previous section), this had the down side that ALTER SEQUENCE, which also modified the single row of a sequence, could not be rolled back.

Since PostgreSQL v10 has given us pg_sequence, and catalog modifications are transaction safe in PostgreSQL, this limitation could be removed with the latest release.

Performance regression with ALTER SEQUENCE

When I said above that ALTER SEQUENCE has become transaction safe just by introducing a new catalog table, I cheated a little. There is one variant of ALTER SEQUENCE that modifies the values stored in a sequence:

ALTER SEQUENCE my_tab_id_seq RESTART;

If only some variants of ALTER SEQUENCE were transaction safe and others weren’t, this would lead to surprising and buggy behavior.

That problem was fixed with this commit:

commit 3d79013b970d4cc336c06eb77ed526b44308c03e
Author: Andres Freund <andres@anarazel.de>
Date:   Wed May 31 16:39:27 2017 -0700

    Make ALTER SEQUENCE, including RESTART, fully transactional.
    
    Previously the changes to the "data" part of the sequence, i.e. the
    one containing the current value, were not transactional, whereas the
    definition, including minimum and maximum value were.  That leads to
    odd behaviour if a schema change is rolled back, with the potential
    that out-of-bound sequence values can be returned.
    
    To avoid the issue create a new relfilenode fork whenever ALTER
    SEQUENCE is executed, similar to how TRUNCATE ... RESTART IDENTITY
    already is already handled.
    
    This commit also makes ALTER SEQUENCE RESTART transactional, as it
    seems to be too confusing to have some forms of ALTER SEQUENCE behave
    transactionally, some forms not.  This way setval() and nextval() are
    not transactional, but DDL is, which seems to make sense.
    
    This commit also rolls back parts of the changes made in 3d092fe540
    and f8dc1985f as they're now not needed anymore.
    
    Author: Andres Freund
    Discussion: https://postgr.es/m/20170522154227.nvafbsm62sjpbxvd@alap3.anarazel.de
    Backpatch: Bug is in master/v10 only

This means that every ALTER SEQUENCE statement will now create a new data file for the sequence; the old one gets deleted during COMMIT. This is similar to the way TRUNCATE, CLUSTER, VACUUM (FULL) and some ALTER TABLE statements are implemented.

Of course this makes ALTER TABLE much slower in PostgreSQL v10 than in previous releases, but you can expect this statement to be rare enough that it should not cause a performance problem.

However, there is this old blog post by depesz that recommends the following function to efficiently get a gap-less block of sequence values:

CREATE OR REPLACE FUNCTION multi_nextval(
   use_seqname text,
   use_increment integer
) RETURNS bigint AS $$
DECLARE
   reply bigint;
BEGIN
   PERFORM pg_advisory_lock(123);
   EXECUTE 'ALTER SEQUENCE ' || quote_ident(use_seqname)
           || ' INCREMENT BY ' || use_increment::text;
   reply := nextval(use_seqname);
   EXECUTE 'ALTER SEQUENCE ' || quote_ident(use_seqname)
           || ' INCREMENT BY 1';
   PERFORM pg_advisory_unlock(123);
   RETURN reply;
END;
$$ LANGUAGE 'plpgsql';

Since this function calls ALTER SEQUENCE not only once but twice, you can imagine that every application that uses it a lot will experience quite a performance hit when upgrading to PostgreSQL v10.

Fortunately you can achieve the save thing with the normal sequence manipulation functions, so you can have a version of the function that will continue performing well in PostgreSQL v10:

CREATE OR REPLACE FUNCTION multi_nextval(
   use_seqname regclass,
   use_increment integer
) RETURNS bigint AS $$
DECLARE
   reply bigint;
   bigint lock_id := (use_seqname::bigint - 2147483648)::integer;
BEGIN
   PERFORM pg_advisory_lock(lock_id);
   reply := nextval(use_seqname);
   PERFORM setval(use_seqname, reply + use_increment - 1, TRUE);
   PERFORM pg_advisory_unlock(lock_id);
   RETURN reply;
END;
$$ LANGUAGE plpgsql;

The post New features for sequences: gains and pitfalls appeared first on Cybertec.


Vasilis Ventirozos: Postgres10 in RDS, first impressions

$
0
0
As a firm believer of Postgres, and someone who runs Postgres 10 in production and runs RDS in production, I've been waiting for Postgres 10 on RDS to be announced ever since the release last fall. Well, today was not that day, but I was surprised to see that RDS is now sporting a "postgres10" instance you can spin up. I'm not sure if thats there on purpose, but you can be sure I jumped at the chance to get a first look at what the new Postgres 10 RDS world might look like; here is what I found..

The first thing that i wanted to test was logical replication. By default it was disabled with rds.logical_replication being set to 0. AWS console allowed me to change this, which also changed wal_level to logical so i started creating a simple table to replicate. I created a publication that included my table but thats where the party stopped. I can't create a role with replication privilege and i can't grant replication to any user :

mydb=> SELECT SESSION_USER, CURRENT_USER;
 session_user | current_user
--------------+---------------
 testuser      | rds_superuser
(1 row)

Time: 143.554 ms
omniti=> alter role testuser with replication;
ERROR:  must be superuser to alter replication users
Time: 163.823 ms

On top of that, create subscription requires superuser. Basically logical replication is there but i don't see how anyone could actually use it. It's well known that RDS replicas can't exist outside RDS. I was hoping that postgres 10 and logical replication would add more flexibility on replicating methods. I don't think this will change anytime soon but maybe they will add functionality in console menus that will control logical replication in their own terms using their rdsadmin user, who knows..

Next thing i wanted to check was parallelism. Remember how I said we run Postgres 10 in production? One thing we found is that there are significant bugs around parallel query, and the only safe way to work around them at this point is to disable.
I was surprised to not only see it enabled, but in fact they are only running 10.1, which does not include a bunch of fixes that we need in our prod instances (not to mention upcoming fixes in 10.3). Presumably they will fix this once it becomes officially released, hopefully on 10.3. For now, please be nice and don't crash their servers just because you can.

I tried a bunch of other features and it sure looked like Postgres 10. The new partitioning syntax is there and it works, as well as scram-sha-256 . Obviously this is super new and they still have work to do, but I'm really excited about the chance to get a sneak peek and looking forward to seeing this get an official release date, maybe at pgconfus later this year?

Thanks for reading
Vasilis Ventirozos

Joshua Drake: People, Postgres, Data

$
0
0

People, Postgres, Data is not just an advocacy term. It is the mission of PostgresConf.Org. It is our rule of thumb, our mantra, and our purpose. When we determine which presentations to approve, which workshops to support, which individuals to receive scholarships, which events to organize, and any task big or small, it must follow: People, Postgres, Data. It is our belief that this mantra allows us to maintain our growth and continue to advocate for the Postgres community and ecosystem in a positive and productive way.

When you attend PostgresConf the first thing you will notice is the diversity of the supported ecosystem; whether you want to discuss the finer points of contribution with the major PostgreSQL.Org sponsors such as 2ndQuadrant or EnterpriseDB, or you want to embrace the Postgres ecosystem with the Greenplum Summit or TimeScaleDB.

The following is a small sampling of content that will be presented April 16 - 20 at the Westin Jersey City Newport:

Learn to Administer Postgres with this comprehensive training opportunity:

Understand the risks of securing your data during this Regulated Industry Summit presentation:

Struggle with time management? We have professional development training such as:

Educate yourself on how to contribute back to the PostgreSQL community:

We are a community driven and volunteer organized ecosystem conference. We want to help the community become stronger, increase education about Postgres, and offer career opportunities and knowledge about the entire ecosystem. Please join us in April!

Pavel Stehule: Release 1.0.0 of tabular data optimized pager - pspg

$
0
0
I released version 1.0.0 of pspg pager. It supports psql, mysql, vertica, pgcli output formats, and can be used with these databases.

Sebastian Insausti: Top PG Clustering HA Solutions for PostgreSQL

$
0
0

If your system relies on PostgreSQL databases and you are looking for clustering solutions for HA, we want to let you know in advance that it is a complex task, but not impossible to achieve.

We are going to discuss some solutions, from which you will be able to choose taking into account your requirements on fault tolerance.

PostgreSQL does not natively support any multi-master clustering solution, like MySQL or Oracle do. Nevertheless, there are many commercial and community products that offer this implementation, along with others such as replication or load balancing for PostgreSQL.

For a start, let's review some basic concepts:

What is High Availability?

It is the amount of time that a service is available, and is usually defined by the business.

Redundancy is the basis for high availability; in the event of an incident, we can continue to operate without problems.

Continuous Recovery

If and when an incident occurs, we have to restore a backup and then apply the wal logs; The recovery time would be very high and we would not be talking about high availability.

However, if we have the backups and the logs archived in a contingency server, we can apply the logs as they arrive.

If the logs are sent and applied every 1 minute, the contingency base would be in a continuous recovery, and would have an outdated state to the production of at most 1 minute.

Standby databases

The idea of a standby database is to keep a copy of a production database that always has the same data, and that is ready to be used in case of an incident.

There are several ways to classify a standby database:

By the nature of the replication:

  • Physical standbys: Disk blocks are copied.
  • Logical standbys: Streaming of the data changes.

By the synchronicity of the transactions:

  • Asynchronous: There is possibility of data loss.
  • Synchronous: There is no possibility of data loss; The commits in the master wait for the response of the standby.

By the usage:

  • Warm standbys: They do not support connections.
  • Hot standbys: Support read-only connections.

Clusters

A cluster is a group of hosts working together and seen as one.

This provides a way to achieve horizontal scalability and the ability to process more work by adding servers.

It can resist the failure of a node and continue to work transparently.

There are two models depending on what is shared:

  • Shared-storage: All nodes access the same storage with the same information.
  • Shared-nothing: Each node has its own storage, which may or may not have the same information as the other nodes, depending on the structure of our system.

Let's now review some of the clustering options we have in PostgreSQL.

Distributed Replicated Block Device

DRBD is a Linux kernel module that implements synchronous block replication using the network. It actually does not implement a cluster, and does not handle failover or monitoring. You need complementary software for that, for example Corosync + Pacemaker + DRBD.

Example:

  • Corosync: Handles messages between hosts.
  • Pacemaker: Starts and stops services, making sure they are running only on one host.
  • DRBD: Synchronizes the data at the level of block devices.

ClusterControl

ClusterControl is an agentless management and automation software for database clusters. It helps deploy, monitor, manage and scale your database server/cluster directly from its user interface.

ClusterControl is able to handle most of the administration tasks required to maintain database servers or clusters.

With ClusterControl you can:

  • Deploy standalone, replicated or clustered databases on the technology stack of your choice.
  • Automate failovers, recovery and day to day tasks uniformly across polyglot databases and dynamic infrastructures.
  • You can create full or incremental backups and schedule them.
  • Do unified and comprehensive real time monitoring of your entire database and server infrastructure.
  • Easily add or remove a node with a single action.

On PostgreSQL, if you have an incident, your slave can be promoted to master status automatically.

It is a very complete tool, that comes with a free community version (which also includes free enterprise trial).

Node Stats View
Node Stats View
Cluster Nodes View
Cluster Nodes View
ClusterControl
Single Console for Your Entire Database Infrastructure
Find out what else is new in ClusterControl

Rubyrep

Solution of asynchronous, multimaster, multiplatform replication (implemented in Ruby or JRuby) and multi-DBMS (MySQL or PostgreSQL).

Based on triggers, it does not support DDL, users or grants.

The simplicity of use and administration is its main objective.

Some features:

  • Simple configuration
  • Simple installation
  • Platform independent, table design independent.

Pgpool II

It is a middleware that works between PostgreSQL servers and a PostgreSQL database client.

Some features:

  • Connection pool
  • Replication
  • Load balancing
  • Automatic failover
  • Parallel queries

It can be configured on top of streaming replication.

Bucardo

Asynchronous cascading master-slave replication, row-based, using triggers and queueing in the database and asynchronous master-master replication, row-based, using triggers and customized conflict resolution.

Bucardo requires a dedicated database and runs as a Perl daemon that communicates with this database and all other databases involved in the replication. It can run as multimaster or multislave.

Master-slave replication involves one or more sources going to one or more targets. The source must be PostgreSQL, but the targets can be PostgreSQL, MySQL, Redis, Oracle, MariaDB, SQLite, or MongoDB.

Some features:

  • Load balancing
  • Slaves are not constrained and can be written
  • Partial replication
  • Replication on demand (changes can be pushed automatically or when desired)
  • Slaves can be "pre-warmed" for quick setup

Drawbacks:

  • Cannot handle DDL
  • Cannot handle large objects
  • Cannot incrementally replicate tables without a unique key
  • Will not work on versions older than Postgres 8

Postgres-XC

Postgres-XC is an open source project to provide a write-scalable, synchronous, symmetric and transparent PostgreSQL cluster solution. It is a collection of tightly coupled database components which can be installed in more than one hardware or virtual machines.

Write-scalable means Postgres-XC can be configured with as many database servers as you want and handle many more writes (updating SQL statements) compared to what a single database server can do.

You can have more than one database server that clients connect to which provides a single, consistent cluster-wide view of the database.

Any database update from any database server is immediately visible to any other transactions running on different masters.

Transparent means you do not have to worry about how your data is stored in more than one database server internally.

You can configure Postgres-XC to run on multiple servers. Your data is stored in a distributed way, that is, partitioned or replicated, as chosen by you for each table. When you issue queries, Postgres-XC determines where the target data is stored and issues corresponding queries to servers containing the target data.

Citus

Citus is a drop-in replacement for PostgreSQL with built-in high availability features such as auto-sharding and replication. Citus shards your database and replicates multiple copies of each shard across the cluster of commodity nodes. If any node in the cluster becomes unavailable, Citus transparently redirects any writes or queries to one of the other nodes which houses a copy of the impacted shard.

Some features:

  • Automatic logical sharding
  • Built-in replication
  • Data-center aware replication for disaster recovery
  • Mid-query fault tolerance with advanced load balancing

You can increase the uptime of your real-time applications powered by PostgreSQL and minimize the impact of hardware failures on performance. You can achieve this with built-in high availability tools minimizing costly and error-prone manual intervention.

PostgresXL

It is a shared nothing, multimaster clustering solution which can transparently distribute a table on a set of nodes and execute queries in parallel of those nodes. It has an additional component called Global Transaction Manager (GTM) for providing globally consistent view of the cluster. The project is based on the 9.5 release of PostgreSQL. Some companies, such as 2ndQuadrant, provide commercial support for the product.

PostgresXL is a horizontally scalable open source SQL database cluster, flexible enough to handle varying database workloads:

  • OLTP write-intensive workloads
  • Business Intelligence requiring MPP parallelism
  • Operational data store
  • Key-value store
  • GIS Geospatial
  • Mixed-workload environments
  • Multi-tenant provider hosted environments

Components:

  • Global Transaction Monitor (GTM): The Global Transaction Monitor ensures cluster-wide transaction consistency.
  • Coordinator: The Coordinator manages the user sessions and interacts with GTM and the data nodes.
  • Data Node: The Data Node is where the actual data is stored.

Conclusion

There are many more products to create our high availability environment for PostgreSQL, but you have to be careful with:

  • New products, not sufficiently tested
  • Discontinued projects
  • Limitations
  • Licensing costs
  • Very complex implementations
  • Unsafe solutions

You must also take into account your infrastructure. If you have only one application server, no matter how much you have configured the high availability of the databases, if the application server fails, you are inaccessible. You must analyze the single points of failure in the infrastructure well and try to solve them.

Taking these points into account, you can find a solution that adapts to your needs and requirements, without generating headaches and being able to implement your high availability cluster solution. Go ahead and good luck!

Severalnines Writers: Tips & Tricks for Navigating the PostgreSQL Community

$
0
0

This blog is about the PostgreSQL community, how it works and how best to navigate it. Note that this is merely an overview ... there is a lot of existing documentation.

Overview of the Community, How Development Works

PostgreSQL is developed and maintained by a globally-dispersed network of highly skilled volunteers passionate about relational database computing referred to as the PostgreSQL Global Development Group. A handful of core team members together handle special responsibilities like coordinating release activities, special internal communications, policy announcements, overseeing commit privileges and the hosting infrastructure, disciplinary and other leadership issues as well as individual responsibility for specialty coding, development, and maintenance contribution areas. About forty additional individuals are considered major contributors who have, as the name implies, undertaken comprehensive development or maintenance activities for significant codebase features or closely related projects. And several dozen more individuals are actively making various other contributions. Aside from the active contributors, a long list of past contributors are recognized for work on the project. It is the skill and high standards of this team that has resulted in the rich and robust feature set of PostgreSQL.

Many of the contributors have full-time jobs that relate directly to PostgreSQL or other Open Source software, and the enthusiastic support of their employers makes their enduring engagement with the PostgreSQL community feasible.

Contributing individuals coordinate using collaboration tools such as Internet Relay Chat (irc://irc.freenode.net/PostgreSQL) and PostgreSQL community mailing lists (https://www.PostgreSQL.org/community/lists). If you are new to IRC or mailing lists, then make an effort specifically to read up on etiquette and protocols (one good article appears at https://fedoramagazine.org/beginners-guide-irc/), and after you join, spend some time just listening to on-going conversations and search the archives for previous similar questions before jumping in with your own issues.

Note that the team is not static: Anyone can become a contributor by, well, contributing … but your contribution will be expected to meet those same high standards!

The team maintains a Wiki page (https://wiki.postgresql.org/) that, amongst a lot of very detailed and helpful information like articles, tutorials, code snippets and more, presents a TODO list of PostgreSQL bugs and feature requests and other areas where effort might be needed. If you want to be part of the team, this is a good place to browse. Items are added only after thorough discussion on the developer mailing list.

The community follows a process, visualized as the steps in Figure 1.

Figure 1. Conceptualized outline of the PostgreSQL development process.

That is, the value of any non-trivial new code implementation is expected to be first discussed and deemed (by consensus) desirable. Then investment is made in design: design of the interface, syntax, semantics and behaviors, and consideration of backward compatibility issues. You want to get buy-in from the developer community on what is the problem to be solved and what this implementation will accomplish. You definitely do NOT want to go off and develop something in a vacuum on your own. There’s literally decades worth of very high quality collective experience embodied in the team, and you want, and they expect, to have ideas vetted early.

The PostgreSQL source code is stored and managed using the Git version control system, so a local copy can be checked out from https://git.postgresql.org/ to commence implementation. Note that for durable maintainability, patches must blend in with surrounding code and follow the established coding conventions (http://developer.postgresql.org/pgdocs/postgres/source.html), so it is a good idea to study any similar code sections to learn and emulate the conventions. Generally, the standard format BSD style is used. Also, be sure to update documentation as appropriate.

Testing involves first making sure existing regression tests succeed and that there are no compiler warnings, but also adding corresponding new tests to exercise the newly-implemented feature(s).

When the new functionality implementation in your local repository is complete, use the Git diff functionality to create a patch. Patches are submitted via email to the pgsql-hackers mailing list for review and comments, but you don’t have to wait until your work is complete … smart practise would be to ask for feedback incrementally. The Wiki page describes expectations as to format and helpful explanatory context and how to show respect for code reviewer’s time.

The core developers periodically schedule commit fests, during which all accumulated unapplied patches are added to the source code repository by authorized committers. As a contributor, your code will have undergone rigorous review and likely your own developer skills will be the better for it. To return the favor, there is an expectation that you will devote time to reviewing patches from others.

ClusterControl
Single Console for Your Entire Database Infrastructure
Find out what else is new in ClusterControl

Top Websites to Get Information or Learn PostgreSQL

Community Website - this is the main launching place into life with PostgreSQLhttps://www.postgresql.org/
Wiki - Wide-ranging topics related to PostgreSQLhttps://wiki.postgresql.org/
IRC Channel - Developers are active participants hereirc://irc.freenode.net/PostgreSQL
Source code repositoryhttps://git.postgresql.org/
pgAdmin GUI clienthttps://www.pgadmin.org/
Biographies of significant community membershttps://www.postgresql.org/community/contributors/
Eric Raymond’s famous post on smart questionshttp://www.catb.org/esr/faqs/smart-questions.html
Database schema change controlhttp://sqitch.org/
Database unit testinghttp://pgtap.org/

The Few Tools You Can’t Live Without

The fundamental command line tools for working with a PostgreSQL database are part of the normal distribution. The workhorse is the psql command line utility, which provides an interactive interface with lots of functionality for querying, displaying, and modifying database metadata, as well as executing data definition (DDL) and data manipulation (DML) statements.

Other included utilities of note include pg_basebackup for establishing a baseline for replication-based backup, pg_dump for extracting a database into a script file or other archive file, pg_restore for restoring a from a pg_dump archive, and others. All of these tools have excellent manual pages as well as being detailed in the standard documentation and numerous on-line tutorials.

pgAdmin is a very popular graphical user interface tool that provides similar functionality as the psql command line utility, but with point-and-click convenience. Figure 2 shows a screenshot of pgAdmin III. On the left is a panel showing all the database objects in the cluster on the attached-to host server. You can drill down into the structure to list all databases, schemas, tables, views, functions, etc, and even open tables and views to examine the contained data. For each object, the tool will create the SQL DML for dropping and re-creating the object, too, as shown on the lower right panel. This is a convenient way to make modifications during database development.

Figure 2. The pgAdmin III utility.

A couple of my favorites tools for application developer teams are Sqitch (http://sqitch.org/), for database change control, and pgTAP (http://pgtap.org/). Sqitch enables stand-alone change management and iterative development by means of scripts written in the SQL dialect native to your implementation, not just PostgreSQL. For each database design change, you write three scripts: one to deploy the change, one to undo the change in case reverting to a previous version is necessary, and one to verify or test the change. The scripts and related files can be maintained in your revision control system right alongside your application code. PgTAP is a testing framework that includes a suite of functionality for verifying integrity of the database. All the pgTAP scripts are similarly plain text files compliant with normal revision management and change control processes. Once I started using these two tools, I found it hard to imagine ever again doing database work without.

Tips and Tricks

The PostgreSQL general mailing list is the most active of the various community lists and is the main community interface for free support to users. A pretty broad range of questions appear on this list, sometimes generating lengthy back-and-forth, but most often getting quick, informative, and to-the-point responses.

When posting a question related to using PostgreSQL, you generally want to always include background information including the version of PostgreSQL you are using (listed by the psql command line tool with “psql --version”), the operating system on which the server is running, and then maybe a description of the operating environment, such as whether it may be predominately read heavy or write heavy, typical number of users and concurrency concerns, changes you have made from the default server configuration (i.e., the pg_hba.conf and postgresql.conf files), etc. Oftentimes, a description of what you are trying to accomplish is valuable, rather than some obtuse analogy, as you may well get suggestions for improvement that you had not even thought of on your own. Also, you will get the best response if you include actual DDL, DML, and sample data illustrating the problem and facilitating others to recreate what you are seeing -- yes, people will actually run your sample code and work with you.

Additionally, if you are asking about improving query performance, you will want to provide the query plan, i.e., the EXPLAIN output. This is generated by running your query unaltered except for prefixing it literally with the word “EXPLAIN”, as shown in Figure 3 in the pgAdmin tool or the psql command line utility.

Figure 3. Producing a query plan with EXPLAIN.

Under EXPLAIN, instead of actually running the query, the server returns the query plan, which lists detailed output of how the query will be executed, including which indexes will be used to optimize data access, where table scans might happen, and estimates of the cost and amount of data involved with each step. The kind of help you will get from the experienced practitioners monitoring the mailing list may pinpoint issues and help to suggest possible new indexes or changes to the filtering or join criteria.

Lastly, when participating in mailing list discussions there are two important things you want to keep in mind.

First, the mail list server is set up to send messages configured so that when you reply, by default your email software will reply only to the original message author. To be sure your message goes to the list, you must use your mail software “reply-all” feature, which will then include both the message author and the list address.

Second, the convention on the PostgreSQL mailing lists is to reply in-line and to NOT TOP POST. This last point is a long-standing convention in this community, and for many newcomers seems unusual enough that gentle admonishments are very common. Opinions vary on how much of the original message to retain for context in your reply. Some people chafe at the sometimes unwieldy growth in size of the message when the entire original message is retained in lots of back-and-forth discussion. Me personally, I like to delete anything that is not relevant to what specifically I am replying to so as to keep the message terse and focussed. Just bear in mind that there is decades of mailing list history retained on-line for historical documentation and future research, so retaining context and flow IS considered very important.

This article gets you started, now go forth, and dive in!

Viewing all 9816 articles
Browse latest View live


<script src="https://jsc.adskeeper.com/r/s/rssing.com.1596347.js" async> </script>