Quantcast
Channel: Planet PostgreSQL
Viewing all 9665 articles
Browse latest View live

Shaun M. Thomas: [Video] Data Integration with PostgreSQL

$
0
0

Just in case you missed the live broadcast, the video of my presentation below covers various topics around integration of PostgreSQL with other data sources and database technologies.

This presentation covers the following topics:

  • What is a Foreign Data Wrapper?
  • How to query MySQL, a Flat file, a Python script, a REST interface and a different Postgres Node
  • Perform all of the above simultaneously
  • Take snapshots of this data for fast access
  • Tweak remote systems for better performance
  • Package as an API for distribution
  • Stream to Kafka
  • Write data to… MongoDB!?
  • What does all of this have in common?

It’s an exciting topic, and I hope more developers and admins begin to see Postgres as the global integration system it really is.


Sebastian Insausti: How to Monitor PostgreSQL using Nagios

$
0
0

Introduction

Regardless of database technology, it is necessary to have a monitoring setup,both to detect problems and take action, or simply to know the current state of our systems.

For this purpose there are several tools, paid and free. In this blog we will focus on one in particular: Nagios Core.

What is Nagios Core?

Nagios Core is an Open Source system for monitoring hosts, networks and services. It allows to configure alerts and has different states for them. It allows the implementation of plugins, developed by the community, or even allows us to configure our own monitoring scripts.

How to Install Nagios?

The official documentation shows us how to install Nagios Core on CentOS or Ubuntu systems.

Let's see an example of the necessary steps for the installation on CentOS 7.

Packages required

[root@Nagios ~]# yum install -y wget httpd php gcc glibc glibc-common gd gd-devel make net-snmp unzip

Download Nagios Core, Nagios Plugins and NRPE

[root@Nagios ~]# wget https://assets.nagios.com/downloads/nagioscore/releases/nagios-4.4.2.tar.gz
[root@Nagios ~]# wget http://nagios-plugins.org/download/nagios-plugins-2.2.1.tar.gz
[root@Nagios ~]# wget https://github.com/NagiosEnterprises/nrpe/releases/download/nrpe-3.2.1/nrpe-3.2.1.tar.gz

Add Nagios User and Group

[root@Nagios ~]# useradd nagios
[root@Nagios ~]# groupadd nagcmd
[root@Nagios ~]# usermod -a -G nagcmd nagios
[root@Nagios ~]# usermod -a -G nagios,nagcmd apache

Nagios Installation

[root@Nagios ~]# tar zxvf nagios-4.4.2.tar.gz
[root@Nagios ~]# cd nagios-4.4.2
[root@Nagios nagios-4.4.2]# ./configure --with-command-group=nagcmd
[root@Nagios nagios-4.4.2]# make all
[root@Nagios nagios-4.4.2]# make install
[root@Nagios nagios-4.4.2]# make install-init
[root@Nagios nagios-4.4.2]# make install-config
[root@Nagios nagios-4.4.2]# make install-commandmode
[root@Nagios nagios-4.4.2]# make install-webconf
[root@Nagios nagios-4.4.2]# cp -R contrib/eventhandlers/ /usr/local/nagios/libexec/
[root@Nagios nagios-4.4.2]# chown -R nagios:nagios /usr/local/nagios/libexec/eventhandlers
[root@Nagios nagios-4.4.2]# /usr/local/nagios/bin/nagios -v /usr/local/nagios/etc/nagios.cfg

Nagios Plugin and NRPE Installation

[root@Nagios ~]# tar zxvf nagios-plugins-2.2.1.tar.gz
[root@Nagios ~]# cd nagios-plugins-2.2.1
[root@Nagios nagios-plugins-2.2.1]# ./configure --with-nagios-user=nagios --with-nagios-group=nagios
[root@Nagios nagios-plugins-2.2.1]# make
[root@Nagios nagios-plugins-2.2.1]# make install
[root@Nagios ~]# yum install epel-release
[root@Nagios ~]# yum install nagios-plugins-nrpe
[root@Nagios ~]# tar zxvf nrpe-3.2.1.tar.gz
[root@Nagios ~]# cd nrpe-3.2.1
[root@Nagios nrpe-3.2.1]# ./configure --disable-ssl --enable-command-args
[root@Nagios nrpe-3.2.1]# make all
[root@Nagios nrpe-3.2.1]# make install-plugin

We add the following line to the end of our file /usr/local/nagios/etc/objects/command.cfg to use NRPE when checking our servers:

define command{
    command_name           check_nrpe
    command_line           /usr/local/nagios/libexec/check_nrpe -H $HOSTADDRESS$ -c $ARG1$
}

Nagios starts

[root@Nagios nagios-4.4.2]# systemctl start nagios
[root@Nagios nagios-4.4.2]# systemctl start httpd
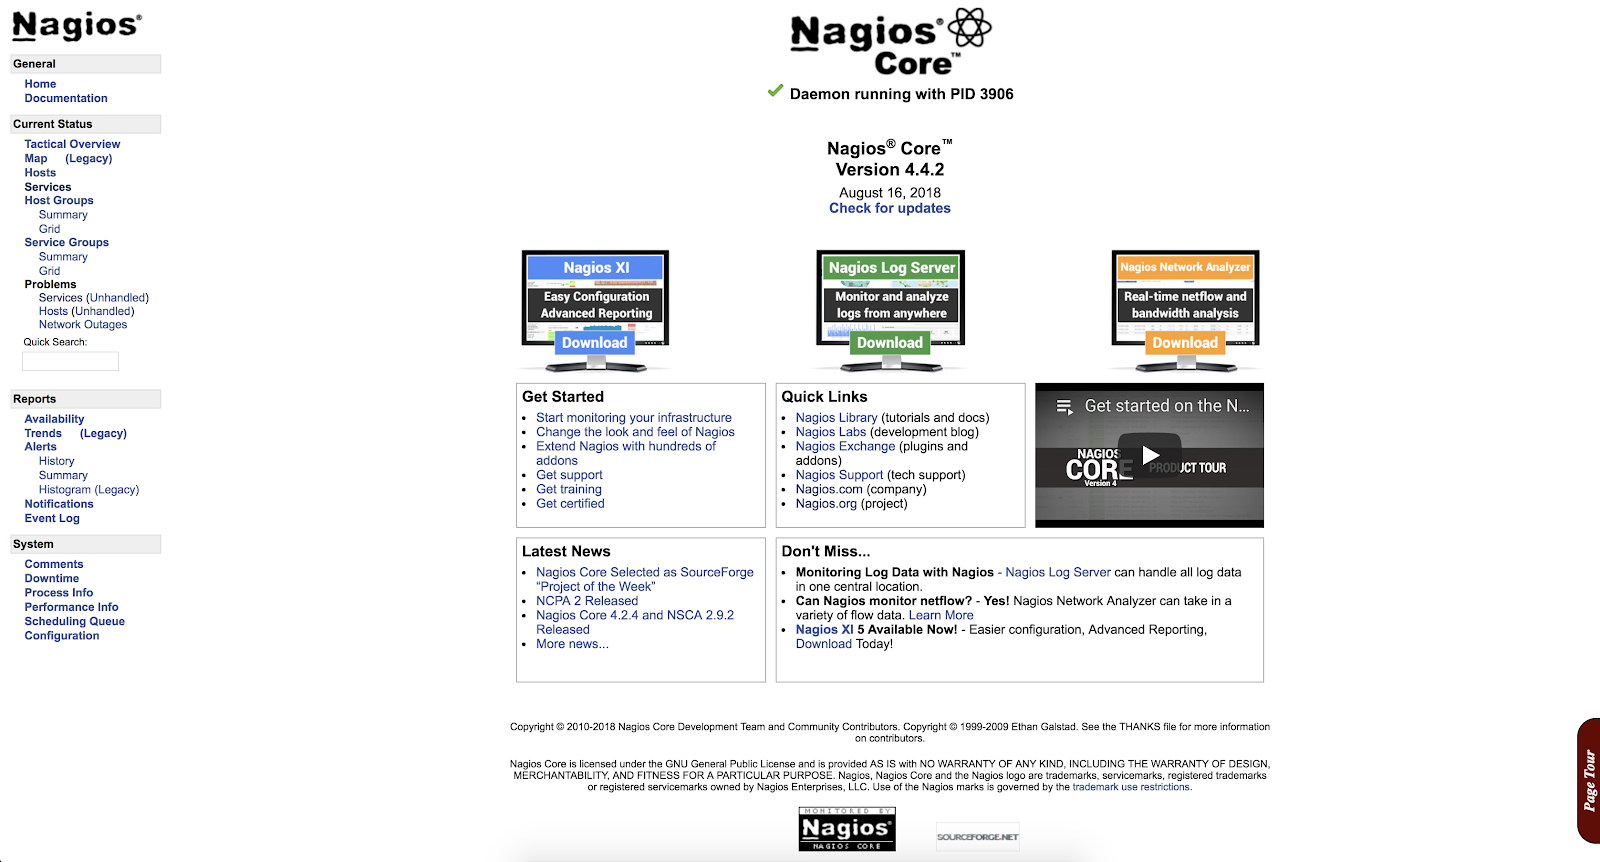
Web access

We create the user to access the web interface and we can enter the site.

[root@Nagios nagios-4.4.2]# htpasswd -c /usr/local/nagios/etc/htpasswd.users nagiosadmin

http://IP_Address/nagios/

Nagios Web Access
Nagios Web Access

How to Configure Nagios?

Now that we have our Nagios installed, we can continue with the configuration. For this we must go to the location corresponding to our installation, in our example /usr/local/nagios/etc.

There are several different configuration files that you're going to need to create or edit before you start monitoring anything.

[root@Nagios etc]# ls /usr/local/nagios/etc
cgi.cfg  htpasswd.users  nagios.cfg  objects  resource.cfg
  • cgi.cfg: The CGI configuration file contains a number of directives that affect the operation of the CGIs. It also contains a reference to the main configuration file, so the CGIs know how you've configured Nagios and where your object definitions are stored.
  • htpasswd.users: This file contains the users created for accessing the Nagios web interface.
  • nagios.cfg: The main configuration file contains a number of directives that affect how the Nagios Core daemon operates.
  • objects: When you install Nagios, several sample object configuration files are placed here. You can use these sample files to see how object inheritance works, and learn how to define your own object definitions. Objects are all the elements that are involved in the monitoring and notification logic.
  • resource.cfg: This is used to specify an optional resource file that can contain macro definitions. Macros allow you to reference the information of hosts, services and other sources in your commands.

Within objects, we can find templates, which can be used when creating new objects. For example, we can see that in our file /usr/local/nagios/etc/objects/templates.cfg, there is a template called linux-server, which will be used to add our servers.

define host {
    name                            linux-server            ; The name of this host template
    use                             generic-host            ; This template inherits other values from the generic-host template
    check_period                    24x7                    ; By default, Linux hosts are checked round the clock
    check_interval                  5                       ; Actively check the host every 5 minutes
    retry_interval                  1                       ; Schedule host check retries at 1 minute intervals
    max_check_attempts              10                      ; Check each Linux host 10 times (max)
    check_command                   check-host-alive        ; Default command to check Linux hosts
    notification_period             workhours               ; Linux admins hate to be woken up, so we only notify during the day
                                                           ; Note that the notification_period variable is being overridden from
                                                           ; the value that is inherited from the generic-host template!
    notification_interval           120                     ; Resend notifications every 2 hours
    notification_options            d,u,r                   ; Only send notifications for specific host states
    contact_groups                  admins                  ; Notifications get sent to the admins by default
    register                        0                       ; DON'T REGISTER THIS DEFINITION - ITS NOT A REAL HOST, JUST A TEMPLATE!
}

Using this template, our hosts will inherit the configuration without having to specify them one by one on each server that we add.

We also have predefined commands, contacts and timeperiods.

The commands will be used by Nagios for its checks, and that is what we add within the configuration file of each server to monitor it. For example, PING:

define command {
    command_name    check_ping
    command_line    $USER1$/check_ping -H $HOSTADDRESS$ -w $ARG1$ -c $ARG2$ -p 5
}

We have the possibility to create contacts or groups, and specify which alerts I want to reach which person or group.

define contact {
    contact_name            nagiosadmin             ; Short name of user
    use                     generic-contact         ; Inherit default values from generic-contact template (defined above)
    alias                   Nagios Admin            ; Full name of user
    email                   nagios@localhost ; <<***** CHANGE THIS TO YOUR EMAIL ADDRESS ******
}

For our checks and alerts, we can configure in what hours and days we want to receive them. If we have a service that is not critical, we probably do not want to wake up at dawn, so it would be good to alert only in work hours to avoid this.

define timeperiod {
    name                    workhours
    timeperiod_name         workhours
    alias                   Normal Work Hours
    monday                  09:00-17:00
    tuesday                 09:00-17:00
    wednesday               09:00-17:00
    thursday                09:00-17:00
    friday                  09:00-17:00
}

Let's see now how to add alerts to our Nagios.

We are going to monitor our PostgreSQL servers, so we first add them as hosts in our objects directory. We will create 3 new files:

[root@Nagios ~]# cd /usr/local/nagios/etc/objects/
[root@Nagios objects]# vi postgres1.cfg
define host {
    use        linux-server      ; Name of host template to use
    host_name    postgres1        ; Hostname
    alias        PostgreSQL1        ; Alias
    address    192.168.100.123    ; IP Address
}
[root@Nagios objects]# vi postgres2.cfg
define host {
    use        linux-server      ; Name of host template to use
    host_name    postgres2        ; Hostname
    alias        PostgreSQL2        ; Alias
    address    192.168.100.124    ; IP Address
}
[root@Nagios objects]# vi postgres3.cfg
define host {
    use        linux-server      ; Name of host template to use
    host_name    postgres3        ; Hostname
    alias        PostgreSQL3        ; Alias
    address    192.168.100.125    ; IP Address
}

Then we must add them to the file nagios.cfg and here we have 2 options.

Add our hosts (cfg files) one by one using the cfg_file variable (default option) or add all the cfg files that we have inside a directory using the cfg_dir variable.

We will add the files one by one following the default strategy.

cfg_file=/usr/local/nagios/etc/objects/postgres1.cfg
cfg_file=/usr/local/nagios/etc/objects/postgres2.cfg
cfg_file=/usr/local/nagios/etc/objects/postgres3.cfg

With this we have our hosts monitored. Now we just have to add what services we want to monitor. For this we will use some already defined checks (check_ssh and check_ping), and we will add some basic checks of the operating system such as load and disk space, among others, using NRPE.

Download the Whitepaper Today
 
PostgreSQL Management & Automation with ClusterControl
Learn about what you need to know to deploy, monitor, manage and scale PostgreSQL

What is NRPE?

Nagios Remote Plugin Executor. This tool allow us to execute Nagios plugins on a remote host in as transparent a manner as possible.

In order to use it, we must install the server in each node that we want to monitor, and our Nagios will connect as a client to each one of them, executing the corresponding plugin (s).

How to install NRPE?

[root@PostgreSQL1 ~]# wget https://github.com/NagiosEnterprises/nrpe/releases/download/nrpe-3.2.1/nrpe-3.2.1.tar.gz
[root@PostgreSQL1 ~]# wget http://nagios-plugins.org/download/nagios-plugins-2.2.1.tar.gz
[root@PostgreSQL1 ~]# tar zxvf nagios-plugins-2.2.1.tar.gz
[root@PostgreSQL1 ~]# tar zxvf nrpe-3.2.1.tar.gz
[root@PostgreSQL1 ~]# cd nrpe-3.2.1
[root@PostgreSQL1 nrpe-3.2.1]# ./configure --disable-ssl --enable-command-args
[root@PostgreSQL1 nrpe-3.2.1]# make all
[root@PostgreSQL1 nrpe-3.2.1]# make install-groups-users
[root@PostgreSQL1 nrpe-3.2.1]# make install
[root@PostgreSQL1 nrpe-3.2.1]# make install-config
[root@PostgreSQL1 nrpe-3.2.1]# make install-init
[root@PostgreSQL1 ~]# cd nagios-plugins-2.2.1
[root@PostgreSQL1 nagios-plugins-2.2.1]# ./configure --with-nagios-user=nagios --with-nagios-group=nagios
[root@PostgreSQL1 nagios-plugins-2.2.1]# make
[root@PostgreSQL1 nagios-plugins-2.2.1]# make install
[root@PostgreSQL1 nagios-plugins-2.2.1]# systemctl enable nrpe

Then we edit the configuration file /usr/local/nagios/etc/nrpe.cfg

server_address=<Local IP Address>
allowed_hosts=127.0.0.1,<Nagios Server IP Address>

And we restart the NRPE service:

[root@PostgreSQL1 ~]# systemctl restart nrpe

We can test the connection by running the following from our Nagios server:

[root@Nagios ~]# /usr/local/nagios/libexec/check_nrpe -H <Node IP Address>
NRPE v3.2.1

How to monitor PostgreSQL?

When monitoring PostgreSQL, there are two main areas to take into account: operating system and databases.

For the operating system, NRPE has some basic checks configured such as disk space and load, among others. These checks can be enabled very easily in the following way.

In our nodes we edit the file /usr/local/nagios/etc/nrpe.cfg and go to where the following lines are:

command[check_users]=/usr/local/nagios/libexec/check_users -w 5 -c 10
command[check_load]=/usr/local/nagios/libexec/check_load -r -w 15,10,05 -c 30,25,20
command[check_disk]=/usr/local/nagios/libexec/check_disk -w 20% -c 10% -p /
command[check_zombie_procs]=/usr/local/nagios/libexec/check_procs -w 5 -c 10 -s Z
command[check_total_procs]=/usr/local/nagios/libexec/check_procs -w 150 -c 200

The names highlighted in bold are those that we will use in our Nagios server to enable these checks.

In our Nagios, we edit the files of the 3 nodes:

/usr/local/nagios/etc/objects/postgres1.cfg
/usr/local/nagios/etc/objects/postgres2.cfg
/usr/local/nagios/etc/objects/postgres3.cfg

We add these checks that we saw previously, leaving our files as follows:

define host {
    use                     linux-server
    host_name               postgres1
    alias                   PostgreSQL1
    address                 192.168.100.123
}
define service {
    use                     generic-service
    host_name               postgres1
    service_description     PING
    check_command           check_ping!100.0,20%!500.0,60%
}
define service {
    use                     generic-service
    host_name               postgres1
    service_description     SSH
    check_command           check_ssh
}
define service {
    use                     generic-service
    host_name               postgres1
    service_description     Root Partition
    check_command        check_nrpe!check_disk
}
define service {
    use                     generic-service
    host_name               postgres1
    service_description     Total Processes zombie
    check_command           check_nrpe!check_zombie_procs
}
define service {
    use                     generic-service
    host_name               postgres1
    service_description     Total Processes
    check_command           check_nrpe!check_total_procs
}
define service {
    use                     generic-service
    host_name               postgres1
    service_description     Current Load
    check_command           check_nrpe!check_load
}
define service {
    use                     generic-service
    host_name               postgres1
    service_description     Current Users
    check_command           check_nrpe!check_users
}

And we restart the nagios service:

[root@Nagios ~]# systemctl start nagios

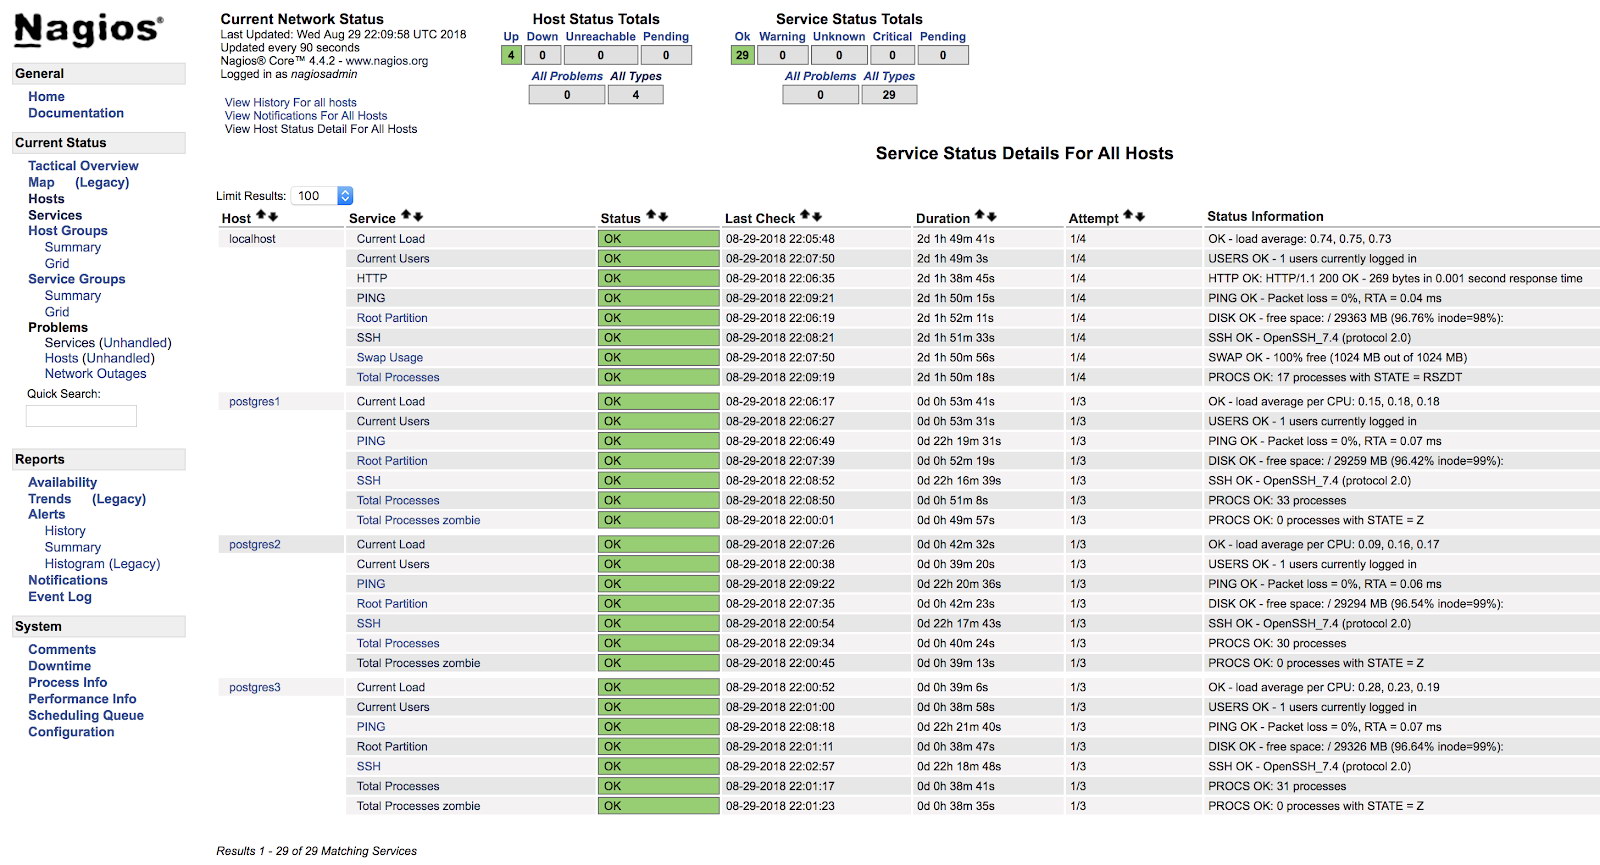
At this point, if we go to the services section in the web interface of our Nagios, we should have something like the following:

Nagios Host Alerts
Nagios Host Alerts

In this way we will be covering the basic checks of our server at the operating system level.

We have many more checks that we can add and we can even create our own checks (we'll see an example later).

Now let's see how to monitor our PostgreSQL database engine using two of the main plugins designed for this task.

Check_postgres

One of the most popular plugins for checking PostgreSQL is check_postgres from Bucardo.

Let's see how to install it and how to use it with our PostgreSQL database.

Packages required

[root@PostgreSQL1 ~]# yum install perl-devel

Installation

[root@PostgreSQL1 ~]#  wget http://bucardo.org/downloads/check_postgres.tar.gz
[root@PostgreSQL1 ~]#  tar zxvf check_postgres.tar.gz
[root@PostgreSQL1 ~]#  cp check_postgres-2.23.0/check_postgres.pl /usr/local/nagios/libexec/
[root@PostgreSQL1 ~]# chown nagios.nagios /usr/local/nagios/libexec/check_postgres.pl
[root@PostgreSQL1 ~]# cd /usr/local/nagios/libexec/
[root@PostgreSQL1 libexec]# perl /usr/local/nagios/libexec/check_postgres.pl  --symlinks

This last command creates the links to use all the functions of this check, such as check_postgres_connection, check_postgres_last_vacuum or check_postgres_replication_slots among others.

[root@PostgreSQL1 libexec]# ls |grep postgres
check_postgres.pl
check_postgres_archive_ready
check_postgres_autovac_freeze
check_postgres_backends
check_postgres_bloat
check_postgres_checkpoint
check_postgres_cluster_id
check_postgres_commitratio
check_postgres_connection
check_postgres_custom_query
check_postgres_database_size
check_postgres_dbstats
check_postgres_disabled_triggers
check_postgres_disk_space
…

We add in our NRPE configuration file (/usr/local/nagios/etc/nrpe.cfg) the line to execute the check we want to use:

command[check_postgres_locks]=/usr/local/nagios/libexec/check_postgres_locks -w 2 -c 3
command[check_postgres_bloat]=/usr/local/nagios/libexec/check_postgres_bloat -w='100 M' -c='200 M'
command[check_postgres_connection]=/usr/local/nagios/libexec/check_postgres_connection --db=postgres
command[check_postgres_backends]=/usr/local/nagios/libexec/check_postgres_backends -w=70 -c=100

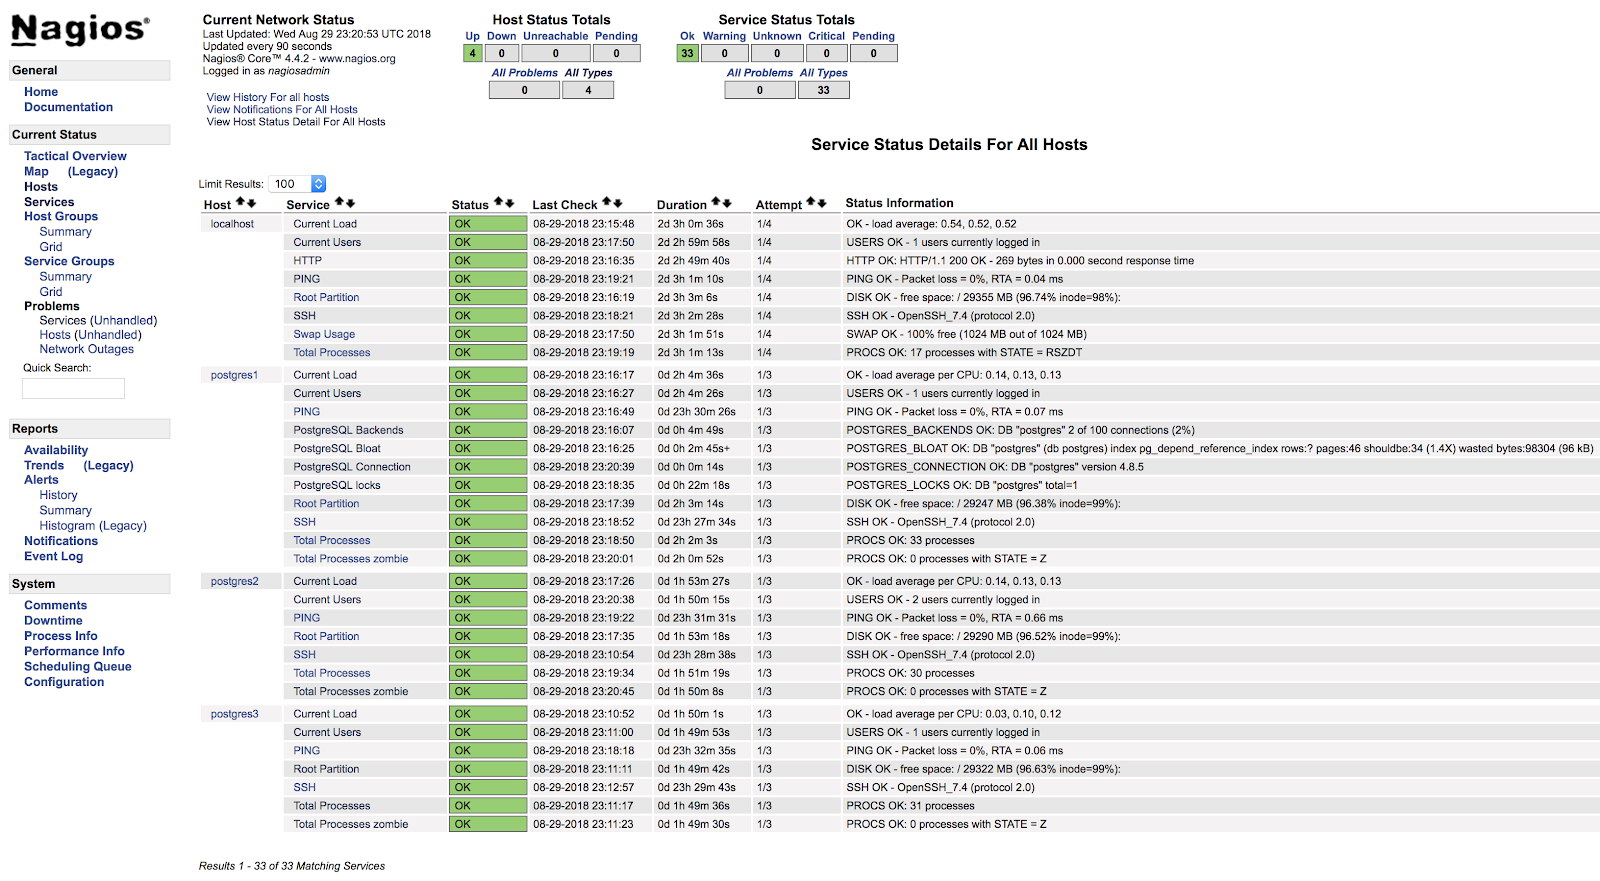
In our example we added 4 basic checks for PostgreSQL. We will monitor Locks, Bloat, Connection and Backends.

In the file corresponding to our database in the Nagios server (/usr/local/nagios/etc/objects/postgres1.cfg), we add the following entries:

define service {
      use                    generic-service
      host_name              postgres1
      service_description    PostgreSQL locks
      check_command          check_nrpe!check_postgres_locks
}
define service {
      use                    generic-service
      host_name              postgres1
      service_description    PostgreSQL Bloat
      check_command          check_nrpe!check_postgres_bloat
}
define service {
      use                    generic-service
      host_name              postgres1
      service_description    PostgreSQL Connection
      check_command          check_nrpe!check_postgres_connection
}
define service {
      use                    generic-service
      host_name              postgres1
      service_description    PostgreSQL Backends
      check_command          check_nrpe!check_postgres_backends
}

And after restarting both services (NRPE and Nagios) on both servers, we can see our alerts configured.

Nagios check_postgres Alerts

In the official documentation of the check_postgres plugin, you can find information on what else to monitor and how to do it.

Check_pgactivity

Now it's the turn for check_pgactivity, also popular for monitoring our PostgreSQL database.

Installation

[root@PostgreSQL2 ~]# wget https://github.com/OPMDG/check_pgactivity/releases/download/REL2_3/check_pgactivity-2.3.tgz
[root@PostgreSQL2 ~]# tar zxvf check_pgactivity-2.3.tgz
[root@PostgreSQL2 ~]# cp check_pgactivity-2.3check_pgactivity /usr/local/nagios/libexec/check_pgactivity
[root@PostgreSQL2 ~]# chown nagios.nagios /usr/local/nagios/libexec/check_pgactivity

We add in our NRPE configuration file (/usr/local/nagios/etc/nrpe.cfg) the line to execute the check we want to use:

command[check_pgactivity_backends]=/usr/local/nagios/libexec/check_pgactivity -h localhost -s backends -w 70 -c 100
command[check_pgactivity_connection]=/usr/local/nagios/libexec/check_pgactivity -h localhost -s connection
command[check_pgactivity_indexes]=/usr/local/nagios/libexec/check_pgactivity -h localhost -s invalid_indexes
command[check_pgactivity_locks]=/usr/local/nagios/libexec/check_pgactivity -h localhost -s locks -w 5 -c 10

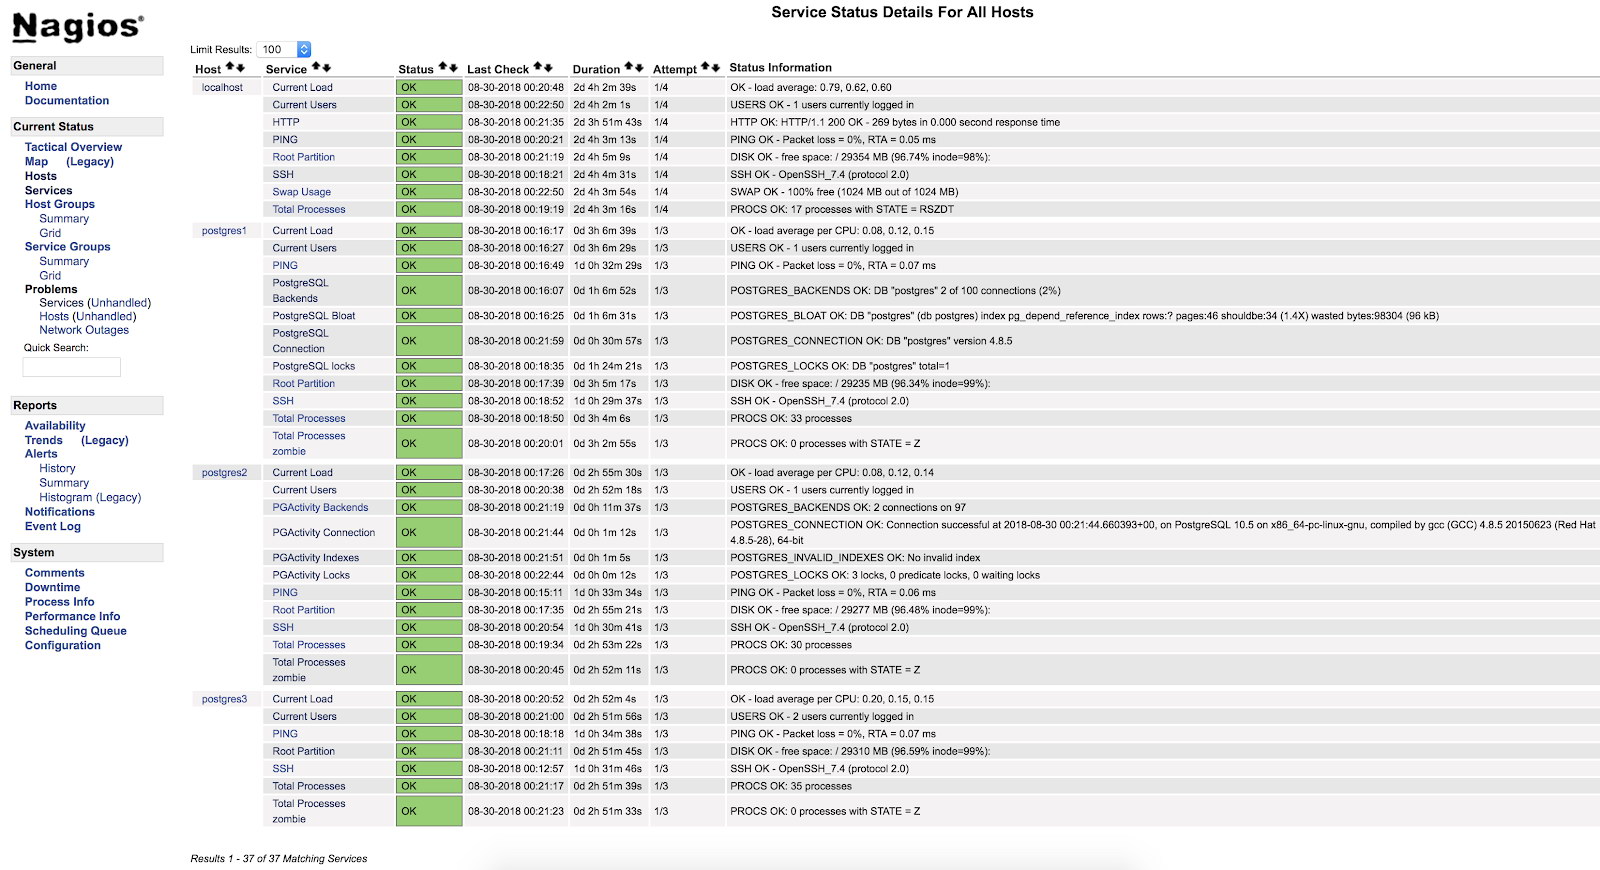
In our example we will add 4 basic checks for PostgreSQL. We will monitor Backends, Connection, Invalid Indexes and locks.

In the file corresponding to our database in the Nagios server (/usr/local/nagios/etc/objects/postgres2.cfg), we add the following entries:

define service {
    use                     generic-service           ; Name of service template to use
    host_name               postgres2
    service_description     PGActivity Backends
    check_command           check_nrpe!check_pgactivity_backends
}
define service {
    use                     generic-service           ; Name of service template to use
    host_name               postgres2
    service_description     PGActivity Connection
    check_command           check_nrpe!check_pgactivity_connection
}
define service {
    use                     generic-service           ; Name of service template to use
    host_name               postgres2
    service_description     PGActivity Indexes
    check_command           check_nrpe!check_pgactivity_indexes
}
define service {
    use                     generic-service           ; Name of service template to use
    host_name               postgres2
    service_description     PGActivity Locks
    check_command           check_nrpe!check_pgactivity_locks
}

And after restarting both services (NRPE and Nagios) on both servers, we can see our alerts configured.

Nagios check_pgactivity Alerts

Check Error Log

One of the most important checks, or the most important one, is to check our error log.

Here we can find different types of errors such as FATAL or deadlock, and it is a good starting point to analyze any problem we have in our database.

To check our error log, we will create our own monitoring script and integrate it into our Nagios (this is just an example, this script will be basic and has plenty of room for improvement).

Script

We will create the file /usr/local/nagios/libexec/check_postgres_log.sh on our PostgreSQL3 server.

[root@PostgreSQL3 ~]# vi /usr/local/nagios/libexec/check_postgres_log.sh
#!/bin/bash
#Variables
LOG="/var/log/postgresql-$(date +%a).log"
CURRENT_DATE=$(date +'%Y-%m-%d %H')
ERROR=$(grep "$CURRENT_DATE" $LOG | grep "FATAL" | wc -l)
#States
STATE_CRITICAL=2
STATE_OK=0
#Check
if [ $ERROR -ne 0 ]; then
       echo "CRITICAL - Check PostgreSQL Log File - $ERROR Error Found"
       exit $STATE_CRITICAL
else
       echo "OK - PostgreSQL without errors"
       exit $STATE_OK
fi

The important thing of the script is to correctly create the outputs corresponding to each state. These outputs are read by Nagios and each number corresponds to a state:

0=OK
1=WARNING
2=CRITICAL
3=UNKNOWN

In our example we will only use 2 states, OK and CRITICAL, since we are only interested in knowing if there are errors of the FATAL type in our error log in the current hour.

The text that we use before our exit will be shown by the web interface of our Nagios, so it should be as clear as possible to use this as a guide to the problem.

Once we have finished our monitoring script, we will proceed to give it execution permissions, assign it to the user nagios and add it to our database server NRPE as well as to our Nagios:

[root@PostgreSQL3 ~]# chmod +x /usr/local/nagios/libexec/check_postgres_log.sh
[root@PostgreSQL3 ~]# chown nagios.nagios /usr/local/nagios/libexec/check_postgres_log.sh

[root@PostgreSQL3 ~]# vi /usr/local/nagios/etc/nrpe.cfg
command[check_postgres_log]=/usr/local/nagios/libexec/check_postgres_log.sh

[root@Nagios ~]# vi /usr/local/nagios/etc/objects/postgres3.cfg
define service {
    use                     generic-service           ; Name of service template to use
    host_name               postgres3
    service_description     PostgreSQL LOG
    check_command           check_nrpe!check_postgres_log
}

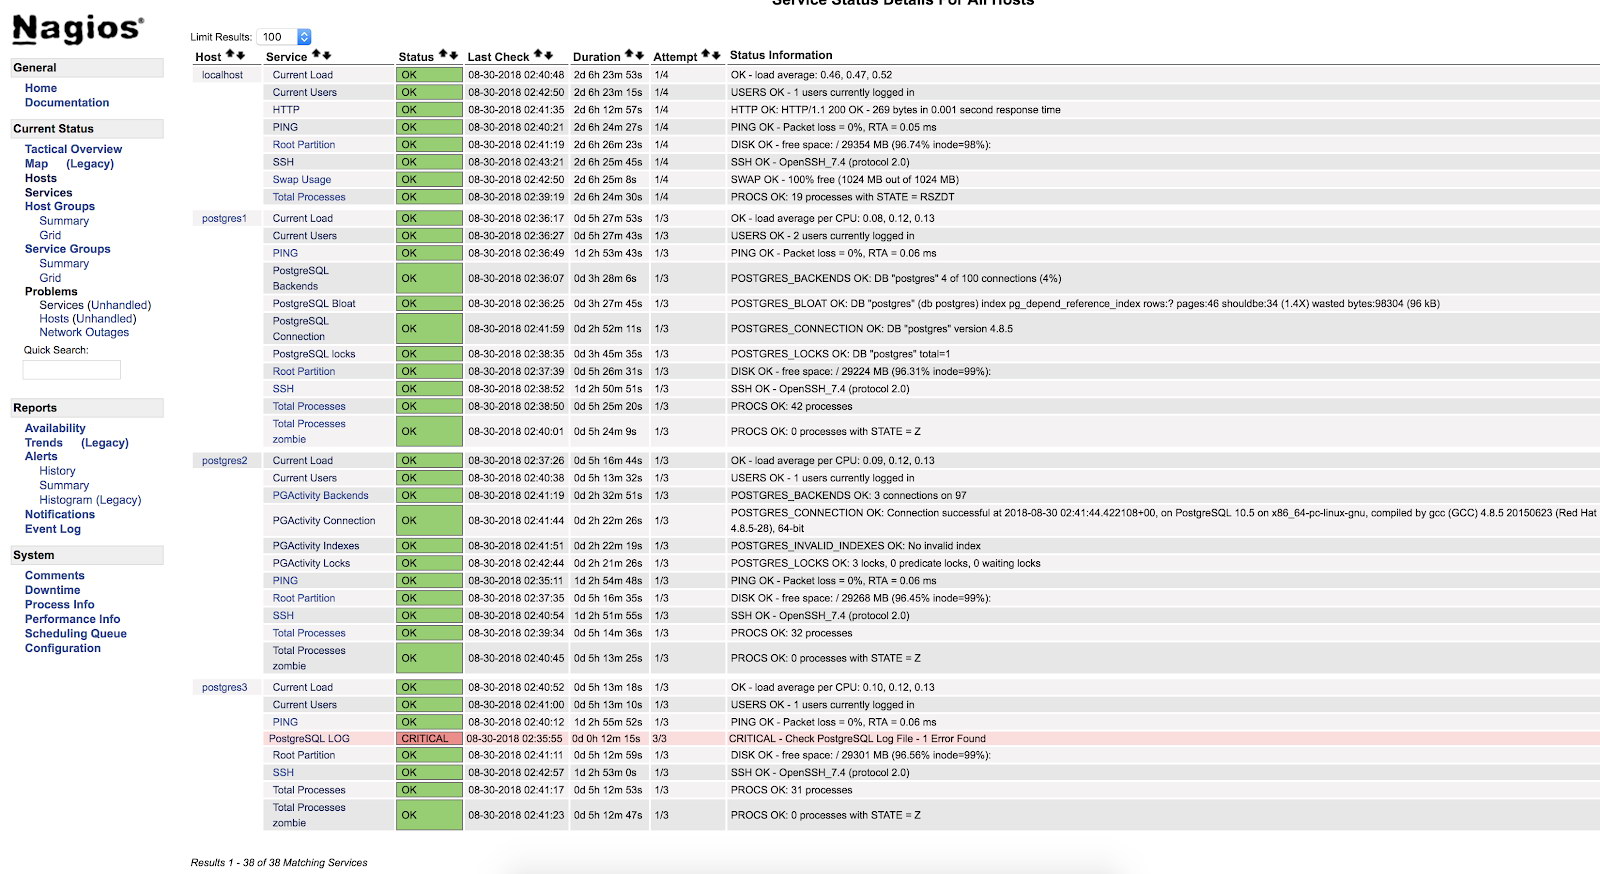
Restart NRPE and Nagios. Then we can see our check in the Nagios interface:

Nagios Script Alerts

As we can see it is in a CRITICAL state, so if we go to the log, we can see the following:

2018-08-30 02:29:49.531 UTC [22162] FATAL:  Peer authentication failed for user "postgres"
2018-08-30 02:29:49.531 UTC [22162] DETAIL:  Connection matched pg_hba.conf line 83: "local   all             all                                     peer"

For more information about what we can monitor in our PostgreSQL database, I recommend you check our performance and monitoring blogs or this Postgres Performance webinar.

Safety and Performance

When configuring any monitoring, either using plugins or our own script, we must be very careful with 2 very important things - safety and performance.

When we assign the necessary permissions for monitoring, we must be as restrictive as possible, limiting access only locally or from our monitoring server, using secure keys, encrypting traffic, allowing the connection to the minimum necessary for monitoring to work.

With respect to performance, monitoring is necessary, but it is also necessary to use it safely for our systems.

We must be careful not to generate unreasonably high disk access, or run queries that negatively affect the performance of our database.

If we have many transactions per second generating gigabytes of logs, and we keep looking for errors continuously, it is probably not the best for our database. So we must keep a balance between what we monitor, how often and the impact on performance.

Conclusion

There are multiple ways to implement monitoring, or to configure it. We can get to do it as complex or as simple as we want. The objective of this blog was to introduce you in the monitoring of PostgreSQL using one of the most used open source tools. We have also seen that the configuration is very flexible and can be tailored to different needs.

And do not forget that we can always rely on the community, so I leave some links that could be of great help.

Support forum: https://support.nagios.com/forum/

Known issues: https://github.com/NagiosEnterprises/nagioscore/issues

Nagios Plugins: https://exchange.nagios.org/directory/Plugins

Nagios Plugin for ClusterControl: https://severalnines.com/blog/nagios-plugin-clustercontrol

Ibrar Ahmed: Tuning PostgreSQL Database Parameters to Optimize Performance

$
0
0
PostgreSQL parameters for database performance tuning

Out of the box, the default PostgreSQL configuration is not tuned for any particular workload. Default values are set to ensure that PostgreSQL runs everywhere, with the least resources it can consume and so that it doesn’t cause any vulnerabilities. It has default settings for all of the database parameters. It is primarily the responsibility of the database administrator or developer to tune PostgreSQL according to their system’s workload. In this blog, we will establish basic guidelines for setting PostgreSQL database parameters to improve database performance according to workload.

Bear in mind that while optimizing PostgreSQL server configuration improves performance, a database developer must also be diligent when writing queries for the application. If queries perform full table scans where an index could be used or perform heavy joins or expensive aggregate operations, then the system can still perform poorly even if the database parameters are tuned. It is important to pay attention to performance when writing database queries.

Nevertheless, database parameters are very important too, so let’s take a look at the eight that have the greatest potential to improve performance

PostgreSQL’s Tuneable Parameters

shared_buffer

PostgreSQL uses its own buffer and also uses kernel buffered IO. That means data is stored in memory twice, first in PostgreSQL buffer and then kernel buffer. Unlike other databases, PostgreSQL does not provide direct IO. This is called double buffering. The PostgreSQL buffer is called shared_buffer which is the most effective tunable parameter for most operating systems. This parameter sets how much dedicated memory will be used by PostgreSQL for cache.

The default value of shared_buffer is set very low and you will not get much benefit from that. It’s low because certain machines and operating systems do not support higher values. But in most modern machines, you need to increase this value for optimal performance.

The recommended value is 25% of your total machine RAM. You should try some lower and higher values because in some cases we achieve good performance with a setting over 25%. The configuration really depends on your machine and the working data set. If your working set of data can easily fit into your RAM, then you might want to increase the shared_buffer value to contain your entire database, so that the whole working set of data can reside in cache. That said, you obviously do not want to reserve all RAM for PostgreSQL.

In production environments, it is observed that a large value for shared_buffer gives really good performance, though you should always benchmark to find the right balance.

testdb=# SHOW shared_buffers;
shared_buffers
----------------
128MB
(1 row)

Note: Be careful as some kernels do not allow a bigger value, specifically in Windows there is no use of higher value.

wal_buffers

PostgreSQL writes its WAL (write ahead log) record into the buffers and then these buffers are flushed to disk. The default size of the buffer, defined by wal_buffers, is 16MB, but if you have a lot of concurrent connections then a higher value can give better performance.

effective_cache_size

The effective_cache_size provides an estimate of the memory available for disk caching. It is just a guideline, not the exact allocated memory or cache size. It does not allocate actual memory but tells the optimizer the amount of cache available in the kernel. If the value of this is set too low the query planner can decide not to use some indexes, even if they’d be helpful. Therefore, setting a large value is always beneficial.

work_mem

This configuration is used for complex sorting. If you have to do complex sorting then increase the value of work_mem for good results. In-memory sorts are much faster than sorts spilling to disk. Setting a very high value can cause a memory bottleneck for your deployment environment because this parameter is per user sort operation. Therefore, if you have many users trying to execute sort operations, then the system will allocate

work_mem * total sort operations
  for all users. Setting this parameter globally can cause very high memory usage. So it is highly recommended to modify this at the session level.
testdb=# SET work_mem TO "2MB";
testdb=# EXPLAIN SELECT * FROM bar ORDER BY bar.b;
                                    QUERY PLAN                                     
-----------------------------------------------------------------------------------
Gather Merge  (cost=509181.84..1706542.14 rows=10000116 width=24)
   Workers Planned: 4
   ->  Sort  (cost=508181.79..514431.86 rows=2500029 width=24)
         Sort Key: b
         ->  Parallel Seq Scan on bar  (cost=0.00..88695.29 rows=2500029 width=24)
(5 rows)

The initial query’s sort node has an estimated cost of 514431.86. Cost is an arbitrary unit of computation. For the above query, we have a work_mem of only 2MB. For testing purposes, let’s increase this to 256MB and see if there is any impact on cost.

testdb=# SET work_mem TO "256MB";
testdb=# EXPLAIN SELECT * FROM bar ORDER BY bar.b;
                                    QUERY PLAN                                     
-----------------------------------------------------------------------------------
Gather Merge  (cost=355367.34..1552727.64 rows=10000116 width=24)
   Workers Planned: 4
   ->  Sort  (cost=354367.29..360617.36 rows=2500029 width=24)
         Sort Key: b
         ->  Parallel Seq Scan on bar  (cost=0.00..88695.29 rows=2500029 width=24)

The query cost is reduced to 360617.36 from 514431.86 — a 30% reduction.

maintenance_work_mem

maintenance_work_mem is a memory setting used for maintenance tasks. The default value is 64MB. Setting a large value helps in tasks like VACUUM, RESTORE, CREATE INDEX, ADD FOREIGN KEY and ALTER TABLE.

postgres=# CHECKPOINT;
postgres=# SET maintenance_work_mem to '10MB';
postgres=# CREATE INDEX foo_idx ON foo (c);
CREATE INDEX
Time: 170091.371 ms (02:50.091)

postgres=# CHECKPOINT;
postgres=# set maintenance_work_mem to '256MB';
postgres=# CREATE INDEX foo_idx ON foo (c);
CREATE INDEX
Time: 111274.903 ms (01:51.275)

The index creation time is 170091.371ms when maintenance_work_mem is set to only 10MB, but that is reduced to 111274.903 ms when we increase maintenance_work_mem setting to 256MB.

synchronous_commit

This is used to enforce that commit will wait for WAL to be written on disk before returning a success status to the client. This is a trade-off between performance and reliability. If your application is designed such that performance is more important than the reliability, then turn off synchronous_commit. This means that there will be a time gap between the success status and a guaranteed write to disk. In the case of a server crash, data might be lost even though the client received a success message on commit. In this case, a transaction commits very quickly because it will not wait for a WAL file to be flushed, but reliability is compromised.

checkpoint_timeout, checkpoint_completion_target

PostgreSQL writes changes into WAL. The checkpoint process flushes the data into the data files. This activity is done when CHECKPOINT occurs. This is an expensive operation and can cause a huge amount of IO. This whole process involves expensive disk read/write operations. Users can always issue CHECKPOINT whenever it seems necessary or automate the system by PostgreSQL’s parameters checkpoint_timeout and checkpoint_completion_target.

The checkpoint_timeout parameter is used to set time between WAL checkpoints. Setting this too low decreases crash recovery time, as more data is written to disk, but it hurts performance too since every checkpoint ends up consuming valuable system resources. The checkpoint_completion_target is the fraction of time between checkpoints for checkpoint completion. A high frequency of checkpoints can impact performance. For smooth checkpointing, checkpoint_timeout must be a low value. Otherwise the OS will accumulate all the dirty pages until the ratio is met and then go for a big flush.

Conclusion

There are more parameters that can be tuned to gain better performance but those have less impact than the ones highlighted here. In the end, we must always keep in mind that not all parameters are relevant for all applications types. Some applications perform better by tuning a parameter and some don’t. Database parameters must be tuned for the specific needs of an application and the OS it runs on.

Related posts

You can read my post about tuning Linux parameters for PostgreSQL database performance

Plus another recent post on benchmarks:

Tuning PostgreSQL for sysbench-tpcc

The post Tuning PostgreSQL Database Parameters to Optimize Performance appeared first on Percona Database Performance Blog.

Bruce Momjian: Cryptographically Authenticated Rows

$
0
0

When storing data in the database, there is an assumption that you have to trust the database administrator to not modify data in the database. While this is generally true, it is possible to detect changes (but not removal) of database rows.

To illustrate this, let's first create a table:

CREATE TABLE secure_demo (
        id SERIAL, car_type TEXT, license TEXT, activity TEXT, 
        event_timestamp TIMESTAMP WITH TIME ZONE, username NAME, hmac BYTEA);

Continue Reading »

Hans-Juergen Schoenig: PostgreSQL: Parallel CREATE INDEX for better performance

$
0
0

PostgreSQL will shortly be released and it is therefore time to take a look at one of the most important new features provided by PostgreSQL 11: The ability to create indexes in parallel. For many years various commercial database vendors have already offered this feature and we are glad that PostgreSQL has become part of this elite club, which offers multi-core index creation, which will dramatically improve the usability of large database deployments in the future.

Creating large tables in PostgreSQL

Since version 11 PostgreSQL supports classical “stored procedures”. The beauty is that a procedure can run more than one transaction, which is ideal if you want to generate huge amounts of random data. When you call generate_series to generate 1 million rows, PostgreSQL has to keep this data in memory and therefore generating hundreds of millions of random rows using more than 1 transactions can be really useful to reduce the memory footprint. Here is how it works:

CREATE TABLE t_demo (data numeric);

CREATE OR REPLACE PROCEDURE insert_data(buckets integer)
LANGUAGE plpgsql
AS $$
   DECLARE
      i int;
   BEGIN
      i := 0;
      WHILE i < buckets
      LOOP
         INSERT INTO t_demo SELECT random()
            FROM generate_series(1, 1000000);
         i := i + 1;
         RAISE NOTICE 'inserted % buckets', i;
         COMMIT;
      END LOOP;
      RETURN;
   END;
$$;

CALL insert_data(500);

This tiny bit of code loads 500 million random numeric values, which should be enough to demonstrate, how CREATE INDEX can be improved in PostgreSQL 11. In our example 500 million rows translate to roughly 21 GB of data:

test=# \d+
 List of relations
 Schema | Name   | Type  | Owner | Size  | Description
--------+--------+-------+-------+-------+-------------
 public | t_demo | table | hs    | 21 GB |
(1 row)

The reason why I went for numeric is that numeric causes the most overhead of all number data types. Creating a numeric index is a lot more costly than indexing, say, int4 or int8. The goal is to see, how much CPU time we can save by building a large index on a fairly expensive field.

CREATE INDEX: Using just 1 CPU core

In PostgreSQL 11 parallel index creation is on by default. The parameter in charge for this issue is called max_parallel_maintenance_workers, which can be set in postgresql.conf:

test=# SHOW max_parallel_maintenance_workers;
 max_parallel_maintenance_workers
----------------------------------
 2
(1 row)

The default value here tells PostgreSQL that if the table is sufficiently large, it can launch two workers to help with index creation. To compare a “traditional” way to create the index with the new settings, I have set max_parallel_maintenance_workers to 0. This will ensure that no multicore indexing is available:

test=# SET max_parallel_maintenance_workers TO 0;
SET

The consequence is that indexing will take forever. When running the CREATE INDEX statement we will see a lot of I/O and a lot of CPU. To make things worse I left all memory parameters at their default value, which means that the index creation has to work with only 4 MB of memory, which is nothing given the size of the table.

Here are the results on my “Intel(R) Core(TM) i5-4460 CPU @ 3.20GHz”:

test=# CREATE INDEX idx1 ON t_demo (data);
CREATE INDEX
Time: 1031650.658 ms (17:11.651)

17 minutes, not too bad. Remember, we are talking about 500 million of really nasty lines of data.

Using more than just one core

Let us run the same type of indexing on 2 cores:

test=# SET max_parallel_maintenance_workers TO 2;
SET

test=# CREATE INDEX idx2 ON t_demo (data);
CREATE INDEX
Time: 660672.867 ms (11:00.673)

Wow, we are down to 11 minutes. Of course the operation is not completely linear because we have to keep in mind that those partial results have to be merged together and all that. But, there is a catch: If set max_parallel_maintenance_workers to 2 and what we saw is 2 cores, right? What if we set the value to 4? In my case 4 is the number of physical cores in the machine so it makes no sense to use any higher values. What you will see is that PostgreSQL still uses only two cores.

How can we change that? The answer can be found in the next listing: ALTER TABLE … SET … allows us to lift this restriction and use more workers:

test=# ALTER TABLE t_demo SET (parallel_workers = 4);
ALTER TABLE

test=# SET max_parallel_maintenance_workers TO 4;
SET

In this case both, max_parallel_workers and the table parameter are set to 4. What we will see now is that PostgreSQL will utilize 5 processes. Why does that happen? What you will see is one main process and 4 processes helping with index creation. That might not be totally obvious but it makes sense when you think about it.

Of course we cannot add an infinite amount of workers and expect performance to grow linearly. At this stage our (single) SSD will also start to run into performance limitations and we won’t see a two times increase anymore:

test=# CREATE INDEX idx3 ON t_demo (data);
CREATE INDEX
Time: 534775.040 ms (08:54.775)

Everybody is doing the same thing pretty much at the same time so we will see wild swings in our I/O curve, which naturally makes the entire thing a bit slower and not linear. Still, we managed to speed up our index creation from 17 minutes to close to 9 minutes by simply adding more cores to the system.

Using more memory for CREATE INDEX

CPU cores are not the only limiting factor during index creation. Memory is also of significant importance. By default maintenance_work_mem is set to a really low value (64 MB), which greatly limits the amount of data, which can be sorted in memory. Therefore the next logical step is to increase this parameter and set it to a higher value creating the new index:

test=# SET maintenance_work_mem TO '4 GB';
SET

In my case I decided to pump the value to 4 GB. My server has 32 GB of memory and we have to keep in mind that we are not the only ones, which might create an index so 4 GB x 5 cores might already be a really aggressive value in a real world scenario.

What we will see while creating the index is a lot more parallelism going on in the first phase of the index creation, which is exactly what we are supposed to see and what we expected. You can also see quite clearly that towards the end CPU usage is pretty low and PostgreSQL is waiting on the disk to do its job. The entire system has been set up with default values so writes have not been optimized yet and are therefore going to be an issue.

However, we will still see a nice improvement:

test=# CREATE INDEX idx4 ON t_demo (data);
CREATE INDEX
Time: 448498.535 ms (07:28.499)

7 minutes and 28 seconds. That is already very nice. But let us see if we can do even better. What we have seen so far is that checkpoints and I/O have started to become a limiting factor. Therefore we will try to improve on that by telling PostgreSQL to use larger checkpoint distances. In this example I have decided to change postgresql.conf to the following values:

checkpoint_timeout = 120min
max_wal_size = 50GB
min_wal_size = 80MB

Those settings can easily be activated by reloading the config file:

test=# SELECT pg_reload_conf();
 pg_reload_conf
----------------
 t
(1 row)

Let us create a new index using those larger checkpoint distances.

When looking at the process table while building the index you can notice that PostgreSQL spent quite a lot of time on writing the WAL to disk. As long as we stick to a single SSD there is not much more we can do about it. However, what will happen if we play our next trump card? Additional hardware. What if we created all our temporary data on one disk, send the WAL to the main disk and create the index on a third SSD? This way we could split the amount of I/O needed quite nicely and see what happens.

Using tablespaces in PostgreSQL to speed up indexing

As already stated adding more hardware by using tablespaces might be a good idea. I am well aware that this might not be possible in a modern cloud environment. However, on my test server I still got the luxury items: A couple of real physical SSD drives.

So let us give them a try and create two tablespaces, which can store the data. On top of that I will tell PostgreSQL to use those tablespaces for sorting and to store the new index:

test=# CREATE TABLESPACE indexspace LOCATION '/ssd1/tabspace1';
CREATE TABLESPACE

test=# CREATE TABLESPACE sortspace LOCATION '/ssd2/tabspace2';
CREATE TABLESPACE

Then we can tell PostgreSQL where to put temporary data:

test=# SET temp_tablespaces TO sortspace;
SET

In the next step the index creation can start:

test=# CREATE INDEX idx6 ON t_demo (data) TABLESPACE indexspace;
CREATE INDEX
Time: 408508.976 ms (06:48.509)

What we see here during the index creation is that our throughput peaks at higher values than before because more than one SSD can work at the same time. Instead of 500 MB / sec peak our throughput goes up to as much as 900 MB / sec at times. The overall speed has improved as well. We are already below 7 minutes, which is really nice.

If you add more hardware to the box it might be worth considering to create one filesystem using all disks at once. I did not have time to test this options but I assume that it might similar and maybe even better results then what I was able to come up with in this first test.

PostgreSQL, CREATE INDEX on many CPUs
Multicore index creation in PostgreSQL. CREATE INDEX can use more than one CPU


TIP: Don’t underestimate the importance of the data type in use. If we did the same test using normal integer values, we could create the index in 3 min 51 seconds. In other words: The data type is of significant importance.

In this post you have seen that creating indexes can be improved. However, keep in mind that new indexes are not always beneficial. Pointless indexes can even slow down things. To figure out, which indexes might not be needed, consider reading a post written by Laurenz Albe, who explains, how to tackle this kind of problem.

The post PostgreSQL: Parallel CREATE INDEX for better performance appeared first on Cybertec.

Pavel Stehule: New features for pspg

$
0
0
I wrote some (I useful) features for pspg

  • possibility to show/hide row numbers
  • possibility to hide/show row cursor

Load from GitHub 1.6.0 release.

Pavel Trukhanov: PostgreSQL: why and how WAL bloats

$
0
0

Today’s post is about real life of PG’s Write-Ahead log.

WAL. An almost short introduction

Any changes to a Postgresql database first of all are saved in Write-Ahead log, so they will never get lost. Only after that actual changes are made to the data in memory pages (in so called buffer cache) and these pages are marked dirty — meaning they need to be synced to disk later.

For that there’s a Checkpoint process, ran periodically, that dumps all the ‘dirty’ pages to disk. It also saves the position in WAL (called REDO point), up to which all changes are synchronized.

So in case of a Postgres DB crashes, it will restore its state by sequentially replaying the WAL records from REDO point. So all the WAL records before this point are useless for recovery, but still might be needed for replication purposes or for Point In Time Recovery.

From this description a Super-Engineer might’ve figured out all the ways it will go wrong in real life :-) But in reality usually one will do this in a reactive way: one need to stumble upon a problem first.

WAL bloats #1

Our monitoring agent for every instance of Postgres will find WAL files and collect their number and total size.

Here’s a case of some strange x6 growth of WAL size and segment count:

What could that be?

WAL is considered unneeded and to be removed after a Checkpoint is made. This is why we check it first. Postgres has a special system view called pg_stat_bgwriter that has info on checkpoints:

  • checkpoints_timed — is a counter of checkpoints triggered due that the time elapsed from the previous checkpoint is more than pg setting checkpoint_timeout. These are so called scheduled checkpoints.
  • checkpoints_req — is a counter of checkpoints ran due to uncheckpointed WAL size grew to more than max_wal_size setting — requested checkpoints.

So let’s see:

We see that after 21 Aug checkpoints ceased to run. Though we would love to know the exact reason it’s so, we can’t ¯\_(ツ)_/¯

But as one might remember, Postgres is known to be prone to unexpected behavior due to long lasting transactions. Let’s see:

Yeah, it definitely might be the case.

So what can we do about it?

  • Kill it. Try pg_cancel_backend
  • Try to figure out reasons of it halting.
  • Wait, but check and monitor free disk space.

There’s an additional quirk here: all this leads to WAL bloat on all of replicas too

Using this as a chance to remind — replica is not a backup.

WAL archiving

Good backup is the one that will allow you to restore at any point in the past.

So if “someone” (not you of course) executes this on primary database:

DELETE FROM very_important_tbl;

You better have a way to restore your DB state right before this transaction. It’s called Point-In-Time-Recovery, or just short — PITR.

And in Postgres you would do this as a periodical full backup + WAL segments archives. For that there’s a special setting — archive_command and ran a special postgres: archiver process. It periodically runs this command of your choose and, if it returns no error, deletes corresponding WAL segment file. But if there’s an error in archiving WAL file, which became more common with wide use of cloud infrastructure (yes, I’m looking at you, AWS S3), it will retry and retry, until success. And this can lead to massive amount of WAL files residing on disk and eating up its space.

So here’s a chart of a broken for a while WAL archiving:

You can get these counters from pg_stat_archiver system view.

Any monitoring systems collects different metrics on server infrastructure. And it’s not only charts, but also you can alert on them and use them to improve your infrastructure to be more resilient.

The thing is that most of widely used software is not designed with goal of having deep observability capabilities. That’s why it’s so hard to have your monitoring set up in such way, so it will show you everything you need in time.

The most crucial metrics are hard to collect. It’s usually not presented by some system view, so you can just SELECT supa_useful_stat FROM cool_stat_view. While developing our monitoring agent we dig deep for meaningful and detailed metrics, so you’ll just have them when there’s need.

That is true for WAL and archiving as well — we not only collect fails from pg_stat_archiver and WAL size on disks, but with okmeter.io you’ll have a metric that shows the amount of WAL residing on disks for the sole purpose of archiving. And here’s how it looks when your archival storage fails:

Our monitoring system — okmeter.io — will not only automatically collect such metrics but also we’ll alert you whenever archiving fails.

Replication

Postgres is well known for its Streaming Replication, that works via continuous transfer and replay of WAL segment files to/on a replica server.

For the case when some replica were unable to get all needed WAL segments instantly, there’s a stash of WAL files on the primary server. Special setting wal_keep_segments controls how many files will be kept by primary. But if a said replica will hang and lag behind for more than that, files will be removed silently. Which will result in that this replica won’t be able to connect to primary and continue it’s streaming replication, drawing it unusable. To turn it back on, one would need to recreate the whole thing from a base backup.

For further controlling and mitigating that, Postgres, since version 9.4, has a special mechanism of Replication slots.

Replication slots

When those are used when setting up replication, and a slot has got a connection from a replica at least once (you can think of it as “was initiated”). Then in case of replica falling behind, Primary server will keep all the needed WAL segments until said replica will connect and catch up with current state.

Or, if replica is forever gone, Primary will keep these segments forever, causing all the disk space to be used for that.

A forgotten (one without monitoring) replication slot cause not only WAL bloat but a possible database downtime.

Fortunately it’s really easy to monitor it through pg_replication_slots system view.

We, at okmeter, suggest that you not only monitor for replication stots statuses, but also track WAL size retained for that, as we do, for example, here:

It not only shows total bloat of WAL, but in detailed view you can see which slot causes that in particular:

When we see which is it, we can decide what to do about it. Either trying to fix those replicas, or, if it’s not needed anymore, delete the slot.

These are most common causes of WAL bloat, though I’m sure there are some others. It’s crucial to monitor it, for database’s uninterruptible service.

Our monitoring service — okmeter.io will help you stay on-top of everything happening with you Postgresql, RDS and other infrastructure services.


PostgreSQL: why and how WAL bloats was originally published in okmeter.io blog on Medium, where people are continuing the conversation by highlighting and responding to this story.

Kaarel Moppel: Next feature release for the pgwatch2 monitoring tool

$
0
0

With summer fading away it’s time to get busy again – last couple of weeks I’ve taken time to work on our Open Source PostgreSQL monitoring tool pgwatch2 and partly on request from a couple of bigger organizations using the tool on a larger scale, added another batch of useful management / scaling features and some more minor enhancements from the Github queue as well. By the way, this is already the 4th “Feature Pack” in one and a half years, so after having implemented the below features we’re considering the software now “ripe”, with no important features missing. Also we’re glad that quite some people have given their feedback recently, helping to improve the software even further and thus hopefully helping to provide more value to the PostgreSQL community. But read on for a more detailed overview on the most important features from this v1.4.0 update.

Getting friendly with Ansible & Co

Similar to the last update we have tried to make pgwatch2 easier to deploy on a larger scale. This time nothing new on the containerization front though, but we’ve added the possibility to make repeatable, configuration based deployments possible! Meaning – one can add a config file(s) with connect strings, metric selections / intervals and the metric definitions themselves to some version control / configuration management / application deployment system and deploy the metrics collector easily to each required DB node, pushing metrics directly to InfluxDB or Graphite. This works better also for firewalled environments.

Performance

The previously supported centrally managed metrics gatherer / configuration database apporach works as before, but for the case when the amount of servers gets too large (hundreds and above) to be handeled by one central gatherer without lag, one can now add a logical grouping label to the monitored hosts and then deploy separate gatherers for subset(s) of hosts based on that label. There are also other performance changes like batching of metric storage requests and connection pooling, helping to increase throughput.

Metrics / Dashboards

As usually there are also a couple of new pre-defined metrics, most notably “psutil” based system statistics (CPU, RAM, disk information), also 2 “preset configs” (the “unprivileged” one for regular login user / developers might be the most useful) and new dashboards to go along with those metrics. As as reminder – one doesn’t need to work with the provided dashboards “as is”, but they can just be used as templates or inspiration source for user modifications.
Some other dashboards (e.g. DB overview) got also some minor changes to make them more beginner-friendly.

Ad-hoc monitoring of a single DB

For those quick troubleshooting sessions for a shorter period, where you really don’t want to spend too much time on setting up something temporary, we’ve added a flag / env. variable to start monitoring based on a standard JDBC connect string input. This works especially well for superusers as all needed “helper functions” will be then created automatically. NB! Unprivileged users might also want to add the PW2_ADHOC_CONFIG=unprivileged env. variable to below sample and also start with the according “DB overview – Unprivileged” dashboard. See here for more.

docker run --rm -p 3000:3000 --name pw2 \
    -e PW2_ADHOC_CONN_STR="postgresql://pgwatch2@localhost/pgwatch2" \
    cybertec/pgwatch2

Most important changes for v1.4.0

NB! For the full changelog see – here.
Any feedback highly appreciated as always! Project Github link – here.

  • File based mode

No central config DB strictly required anymore.

  • Ad-hoc mode

“Single command launch” based on JDBC connect string for temporary monitoring sessions.

  • A new “group” label for logical grouping / sharding

For cases where the amount of monitored DBs grows too big for one gatherer daemon to handle or there are different criticality requirements.

  • Continuous discovery of new DBs

The gatherer daemon can now periodically scan for new DBs on the cluster and start monitoring them automatically.

  • Custom tags

Now users can add any fixed labels / tags (e.g. env/app names) to be stored for all gathered metric points on a specific DB.

  • A stats/health interface for the gatherer daemon

Dumps out JSON on metrics gathering progress.

  • New dashboard – DB overview Developer / Unprivileged

Uses data only from metrics that are visible to all Postgres users who able to connect to a DB, with only “pg_stat_statements” additionally available.

  • New dashboard – System Stats

Python “psutil” package + “PL/Python” required on the monitored DB host. Provides detailed CPU / Memory / Disk information with the help of according helpers / metrics.

  • New dashboard – Checkpointer/Bgwriter/Block IO Stats

To visualize checkpoint frequencies, background writer and block IO based on Postgres internal metrics.

  • Gatherer daemon now supports < 1s gathering intervals
  • Connection pooling on monitored Dbs

Big improvement for very small gathering intervals.

  • Batching of InfluxDB metric storage requests

Improves metrics arrival lag manyfold when latency to InfluxDB is considerable.

Screenshots of new Dashboards

DB overview Unprivileged / Developer
System Stats (“psutil” based)
System Stats
Checkpointer / Bgwriter / Block IO Stats

The post Next feature release for the pgwatch2 monitoring tool appeared first on Cybertec.


Paul Ramsey: Moving on to CrunchyData

$
0
0

Today is my first day with my new employer Crunchy Data. Haven’t heard of them? I’m not surprised: outside of the world of PostgreSQL, they are not particularly well known, yet.

Moving on to CrunchyData

I’m leaving behind a pretty awesome gig at CARTO, and some fabulous co-workers. Why do such a thing?

While CARTO is turning in constant growth and finding good traction with some core spatial intelligence use cases, the path to success is leading them into solving problems of increasing specificity. Logistics optimization, siting, market evaluation.

Moving to Crunchy Data means transitioning from being the database guy (boring!) in a geospatial intelligence company, to being the geospatial guy (super cool!) in a database company. Without changing anything about myself, I get to be the most interesting guy in the room! What could be better than that?

Crunchy Data has quietly assembled an exceptionally deep team of PostgreSQL community members: Tom Lane, Stephen Frost, Ed Conway, Peter Geoghegan, Dave Cramer, David Steele, and Jonathan Katz are all names that will be familiar to followers of the PostgreSQL mailing lists.

They’ve also quietly assembled expertise in key areas of interest to large enterprises: security deployment details (STIGs, RLS, Common Criteria); Kubernetes and PaaS deployments; and now (ta da!) geospatial.

Why does this matter? Because the database world is at a technological inflection point.

Core enterprise systems change very infrequently, and only under pressure from multiple sources. The last major inflection point was around the early 2000s, when the fleet of enterprise proprietary UNIX systems came under pressure from multiple sources:

  • The RISC architecture began to fall noticeably behind x86 and particular x86-64.
  • Pricing on RISC systems began to diverge sharply from x86 systems.
  • A compatible UNIX operating system (Linux) was available on the alternative architecture.
  • A credible support company (Red Hat) was available and speaking the language of the enterprise.

The timeline of the Linux tidal wave was (extremely roughly):

  • 90s - Linux becomes the choice of the tech cognoscenti.
  • 00s - Linux becomes the choice of everyone for greenfield applications.
  • 10s - Linux becomes the choice of everyone for all things.

By my reckoning, PostgreSQL is on the verge of a Linux-like tidal wave that washes away much of the enterprise proprietary database market (aka Oracle DBMS). Bear in mind, these things pan out over 30 year timelines, but:

  • Oracle DBMS offers no important feature differentiation for most workloads.
  • Oracle DBMS price hikes are driving customers to distraction.
  • Server-in-the-cold-room architectures are being replaced with the cloud.
  • PostgreSQL in the cloud, deployed as PaaS or otherwise, is mature.
  • A credible support industry (including Crunchy Data) is at hand to support migrators.

I’d say we’re about half way through the evolution of PostgreSQL from “that cool database” to “the database”, but the next decade of change is going to be the one people notice. People didn’t notice Linux until it was already running practically everything, from web servers to airplane seatback entertainment systems. The same thing will obtain in database land; people won’t recognize the inevitability of PostgreSQL as the “default database” until the game is long over.

Having a chance to be a part of that change, and to promote geospatial as a key technology while it happens, is exciting to me, so I’m looking forward to my new role at Crunchy Data a great deal!

Meanwhile, I’m going to be staying on as a strategic advisor to CARTO on geospatial and database affairs, so I get to have a front seat on their continued growth too. Thanks to CARTO for three great years, I enjoyed them immensely!

Joshua Drake: PostgresConf Silicon Valley: Schedule now available

$
0
0
PostgresConf Silicon Valley is being held October 15th-16th at the Hilton San Jose and the schedule is now available.

The two day event received over 80 submissions! A lot of the usual and legendary speakers are present but we were pleasantly surprised to find that so many new (to the conference) speakers submitted. It shows that the mission of People, Postgres, Data is growing at an amplified rate. The presentations are all of the "best-in-class quality" our attendees have come to expect from PostgresConf events.


Whether your needs are Big Data, Google Cloud, AWS RDS, GPDR Compliance, or you just have a burning desire to learn more about Kubernetes, PostgresConf Silicon Valley has you covered!

We also have two fantastic training opportunities which are the first of their kind:


Craig Kerstiens: 12 Factor: Dev/prod parity for your database

$
0
0

The twelve-factor app changed the way we build SaaS applications. Explicit dependency management, separating config from code, scaling out your app concurrently—these design principles took us from giant J2EE apps to apps that scale predictably on the web. One of these 12 factors has long stood out as a challenge when it comes to databases: dev/prod parity. Sure, you can run the exact same version of your database, and have a sandbox copy, but testing and staging with production data… that’s a different story.

Dev/Prod parity is easy until it’s not

Running the same version of your database in development as in production should be a no brainer. Just do it. If you use Postgres 10 in production, make sure to use the same version of Postgres in dev. For Postgres at least, you’re usually pretty safe on point releases so between 10.1 and say 10.3 you may not have to worry too much, but at least keep the same major version of the database the same between dev and prod.

Now that we have the easy part out of the way, the complexity starts to come with the data. The version of your database is one piece, but how your data interacts is equally as key. If your perfectly pristine data set for development doesn’t attempt to create hotspots in your data, violate constraints, or in general push the boundaries of what’s allowed then there is a good chance you run into issues when you deploy to production.

Remember that time that you added an index to speed things up… Everything tested fine on your local dev box. Even in staging against the 10 GB, the sample DB worked fine. You deployed, and the index ran as part of your deploy script, and 30 minutes in you were madly figuring out how to cancel things as so many people showed up at your desk asking why the system is down?

Let’s start with database migrations, and indexes

We’re going to come back to dev/prod parity in a minute and how you can safely test operations against a production dataset. But first, let’s tackle two practices that you should put in place immediately to save you some heartache later on:

  1. Safe migrations for large datasets
  2. Concurrent index creation

Safer migrations for large datasets

Postgres is pretty good and fast when you add a new column. The caveat comes if you set a default value on a non-nullable column for that table. The result is that your database has to read all the records and rewrite a new copy of the table with the default value set. If you were following along earlier, in staging on a 1 GB table this might take a few seconds, maybe a minute. In production against a 100 GB table, you could be waiting up to an hour. Even worse, while the table is being read and rewritten an exclusive lock is taken which means new writes will have to wait until the operation is completed. There is a safer approach to your migrations though:

  1. Add your column allowing nulls, but with a default value
  2. Backfill for all nulls in a background job
  3. Add your not null constraint

Following this process you can reliable have migrations whether Rails, Django, or any framework that won’t risk downtime to your application.

Note: In Postgres 11 this becomes a non-issue.

Indexes for performance, but proceed with care

Indexes make your reads faster, we’ve talked about it before. A combination of pgstatstatements and landlord can be extremely powerful for getting insights on what to optimize. And we’ve talked about how Postgres has a robust set of index types.

One best practice is to add your indexes concurrently—regardless of whether you’re optimizing for tenant performance (say, with a multi-tenant app) or whether you’re trying to improve things across the board. When you add concurrently to the create index command, the index is built in the background and doesn’t hold the same exclusive lock that is typically taken when you add an index. The downside is that CREATE INDEX CONCURRENTLY can’t be run within a transaction, the positive though is you don’t have to wait hours for an index to be added on 1 TB table.

Back to dev/prod parity

Running your index creations, your migrations, everything against staging prior to running it against production is key to safer deploys. But as we’ve seen highlighted above you need your staging dataset to also imitate production. When production is small at 10 GB of data this isn’t too bad to do a dump/restore. As your production grows a dump/restore across 100 GB or say 1 TB can take hours to maybe even days, not to mention introduce heavy load on your database. With an ever changing dataset how then do you test things? Enter the ability to Fork your database.

You can think of a forking your database just like forking a git repo. A fork is a copy of the database as it exists as of some point in time. If you fork production to staging, you as of that moment you fork you’ll get all the data in that state. Any changes that happen from them on to production are not replicated to staging. Database forks work by leveraging underlying Postgres base backups and then replaying the underlying WAL (write-ahead-log) to that point in time. By leveraging already existing disaster recovery tooling it means that forking your database doesn’t introduce load onto production.

Have you been burned by any of the issues discussed earlier? If so you likely didn’t have dev/prod parity for your database. Forking your database gives you a safe way to test risky operations in staging, consider leveraging database forks if you’re not already today.

Christophe Pettus: CHAR: What is it good for?

$
0
0

In addition to the familiar text types VARCHAR and TEXT, PostgreSQL has a type CHAR. It’s little used… and that’s for a reason. It has some very unusual behaviors, which can be quite a surprise if you are not expecting them.

First, CHAR is a fixed-width type. When character data is stored in it, it’s padded out with spaces if it is not full length:

xof=# create table chars (c char(20));
CREATE TABLE
xof=# insert into chars values('x');
INSERT 0 1
xof=# select * from chars;
          c           
----------------------
 x                   
(1 row)

OK, that’s reasonable, right? But what is going on here?

xof=# select length(c) from chars;
 length 
--------
      1
(1 row)

xof=# select substring(c from 8 for 1) = ' '::char(1) from chars;
 ?column? 
----------
 t
(1 row)

xof=# select substring(c from 8 for 1) = ' '::varchar(1) from chars;
 ?column? 
----------
 f
(1 row)

xof=# select length(substring(c from 8 for 1)) from chars;
 length 
--------
      0
(1 row)

xof=# select c || 'y' from chars;
 ?column? 
----------
 xy
(1 row)

CHAR, when actually used, first trims off all trailing spaces, then applies the operation. It is trying to simulate a variable-length type, for historic reasons. This can be quite surprising, since a supposedly fixed-length type suddenly starts behaving as if it were variable. Unless you are terribly nostalgic for punched cards, CHAR is generally not what you want.

Is there ever a time to use CHAR? Not really. If you have a single-character enumeration that can never be either ” or ‘ ‘ (a single space), it might be more logical to store it as CHAR(1) rather than VARCHAR, but any space savings will be minimal and highly dependent on the alignment of the surrounding items.

And for n > 1, just use VARCHAR… or TEXT. (Remember that in PostgreSQL, VARCHAR and TEXT are stored the same way.)

Dave Page: Why do we install as root?

$
0
0
A couple of common questions I hear from customers (usually long-time users of a particular database from Redwood) via our guys in the field is “why do we install our software as root?” And “why do we run services as postgres?”. The simple, TLDR; answer is “for security”. For a detailed explanation, read on…

A basic principle when securing a software installation is “install with maximum privilege requirements and run with minimal”. In practice this equates to having software being installed and binaries/executables etc. owned by the root user, whilst the services themselves are actually run under a minimally privileged (and ideally dedicated) service user account, typically postgres in a PostgreSQL installation. Data files, and any other files that need to be modified by the software in normal operation are also owned by the service user account.

Let’s look at the running software first. Postgres (which will in fact refuse to run as root), is a server process which is often running on a network port that is accessible from other nodes on the network. Of course, we should limit access as much as possible to only those nodes that need access using both a firewall (even simple iptables rules will work), and Postgres’ pg_hba.conf access control file, but even with those measures in place, it’s possible that a determined attacker (let’s call him Zero Cool) can still gain access to the port the database server is running on.

Once our arch-nemesis Zero Cool has access to the database server port, he needs a way to escalate his attack. This may involve exploiting an unknown security issue in Postgres itself (as with any software, we hope there are none but we’re kidding ourselves if we think it’s totally secure), or it may be that he’s used other techniques such as social engineering to learn a users credentials.

If Zero gains “regular” access to Postgres, then he will be subject to any security measures (access control lists, RLS policies etc) that limit the scope of what the user account he’s used can access/delete/update/whatever. If the user account has superuser privileges or access to un-trusted procedural languages, or if Zero gained access using a lower-level exploit that allows him to execute arbitrary code in other ways, then he will be able to wreak chaos at a lower level in the system, such as overwriting files on disk.

However - and this is the important bit - assuming there are no exploits in the Operating System that he can leverage to gain further privileges, his chaos will be restricted to things that the service account under which Postgres is running can do. In a well secured system where an unprivileged account like postgres is used, that will be limited to damage to the Postgres data files and other files (or processes etc) that user can modify or control. If Postgres were running under a privileged account like root, Zero would have pwned (in script-kiddie parlance) the entire system at this point!

Now consider the case where the Postgres software files were also owned by the postgres user. Zero would not only be able to affect files and processes owned by the service account, but would also be able to modify the software itself, allowing him the opportunity to add backdoors for future access or other malware such as spyware etc. In the case of software that is started as root (even that which later drops those privileges or switches to another user account for normal operation), this could be exploited to gain even easier privileged access at a later time.

This is why we want our software to be installed and owned by a high privilege user such as root and run as a low privileged user such as postgres. Doing so ensures that even if Zero manages to crack his way into Postgres and potentially access or modify data, he cannot modify the software or other aspects of the host system and thus has a much harder time further escalating his attack.

Bruce Momjian: Client Row Access Control

$
0
0

Usually the database administrator controls who can access database data. However, it is possible for clients to completely control who can access data they add to the database, with the help of openssl.

First, let's create RSA keys for three users from the command line. We first create an RSA public/private key pair for each user in their home subdirectory and then make a copy of their RSA public key in the shared directory /u/postgres/keys:

# # must be run as the root user
# cd /u/postgres/keys
# for USER in user1 user2 user3
> do    mkdir ~"$USER"/.pgkey
>       chown -R "$USER" ~"$USER"/.pgkey
>       chmod 0700 ~"$USER"/.pgkey
>       openssl genpkey -algorithm RSA -out ~"$USER"/.pgkey/rsa.key
>       chmod 0600 ~"$USER"/.pgkey/*
>       openssl pkey -in ~"$USER"/.pgkey/rsa.key -pubout -out "$USER".pub
> done

Continue Reading »

Quinn Weaver: Locks talk this Friday, at PostgresOpen! (2018-09-07)

$
0
0
Attending PostgresOpen?

Come join me Friday for a gentle introduction to locks in PostgreSQL. My example-driven talk covers basic lock theory, tools for lock debugging, and common pitfalls and solutions. I hope to see you there!

Time and place info is on the PostgresOpen SV website.


Peter Eisentraut: Upgrading to PostgreSQL 11 with Logical Replication

$
0
0

It’s time.

About a year ago, we published PostgreSQL 10 with support for native logical replication. One of the uses of logical replication is to allow low- or no-downtime upgrading between PostgreSQL major versions. Until now, PostgreSQL 10 was the only PostgreSQL release with native logical replication, so there weren’t many opportunities for upgrading in this way. (Logical replication can also be used for moving data between instances on different operating systems or CPU architectures or with different low-level configuration settings such as block size or locale — sidegrading if you will.) Now that PostgreSQL 11 is near, there will be more reasons to make use of this functionality.

Let’s first compare the three main ways to upgrade a PostgreSQL installation:

  • pg_dump and restore
  • pg_upgrade
  • logical replication

We can compare these methods in terms of robustness, speed, required downtime, and restrictions (and more, but we have to stop somewhere for this article).

pg_dump and restore is arguably the most robust method, since it’s the most tested and has been in use for decades. It also has very few restrictions in terms of what it can handle. It is possible to construct databases that cannot be dumped and restored, mostly involving particular object dependency relationships, but those are rare and usually involve discouraged practices.

The problem with the dump and restore method is of course that it effectively requires downtime for the whole time the dump and restore operations run. While the source database is still readable and writable while the process runs, any updates to the source database after the start of the dump will be lost.

pg_upgrade improves on the pg_dump process by moving over the data files directly without having to dump them out into a logical textual form. Note that pg_upgrade still uses pg_dump internally to copy the schema, but not the data. When pg_upgrade was new, its robustness was questioned, and it did upgrade some databases incorrectly. But pg_upgrade is now quite mature and well tested, so one does not need to hesitate about using it for that reason anymore. While pg_upgrade runs, the database system is down. But one can make a choice about how long pg_upgrade runs. In the default copy mode, the total run time is composed of the time to dump and restore the schema (which is usually very fast, unless one has thousands of tables or other objects) plus the time to copy the data files, which depends on how big the database is (and the I/O system, file system, etc.).

In the optional link mode, the data files are instead hard-linked to the new data directory, so that the time is merely the time to perform a short kernel operation per file instead of copying every byte. The drawback is that if anything goes wrong with the upgrade or you need to fall back to the old installation, this operation will have destroyed your old database. (I’m working on a best-of-both-worlds solution for PostgreSQL 12 using reflinks or file clone operations on supported file systems.)

Logical replication is the newest of the bunch here, so it will probably take some time to work out the kinks. If you don’t have time to explore and investigate, this might not be the way to go right now. (Of course, people have been using other non-core logical replication solutions such as Slony, Londiste, and pglogical for upgrading PostgreSQL for many years, so there is a lot of experience with the principles, if not with the particulars.)

The advantage of using logical replication to upgrade is that the application can continue to run against the old instance while the data synchronization happens. There only needs to be a small outage while the client connections are switched over. So while an upgrade using logical replication is probably slower start to end than using pg_upgrade in copy mode (and definitely slower than using hardlink mode), it doesn’t matter very much since the actual downtime can be much shorter.

Note that logical replication currently doesn’t replicate schema changes. In this proposed upgrade procedure, the schema is still copied over via pg_dump, but subsequent schema changes are not carried over. Upgrading with logical replication also has a few other restrictions. Certain operations are not captured by logical replication: large objects, TRUNCATE, sequence changes. We will discuss workarounds for these issues later.

If you have any physical standbys (and if not, why don’t you?), there are also some differences to consider between the methods. With either method, you need to build new physical standbys for the upgraded instance. With dump and restore as well as with logical replication, they can be put in place before the upgrade starts so that the standby will be mostly ready once the restore or logical replication initial sync is complete, subject to replication delay.

With pg_upgrade, the new standbys have to be created after the upgrade of the primary is complete. (The pg_upgrade documentation describes this in further detail.) If you rely on physical standbys for high-availability, the standbys ought to be in place before you switch to the new instance, so the setup of the standbys could affect your overall timing calculations.

But back to logical replication. Here is how upgrading with logical replication can be done:

0. The old instance must be prepared for logical replication. This requires some configurations settings as described under https://www.postgresql.org/docs/10/static/logical-replication-config.html (mainly wal_level = logical. If it turns out you need to make those changes, they will require a server restart. So check this well ahead of time. Also check that pg_hba.conf on the old instance is set up to accept connections from the new instance. (Changing that only requires a reload.)

1. Install the new PostgreSQL version. You need at least the server package and the client package that contains pg_dump. Many packagings now allow installing multiple versions side by side. If you are running virtual machines or cloud instances, it’s worth considering installing the new instance on a new host.

2. Set up a new instance, that is, run initdb. The new instance can have different settings than the old one, for example locale, WAL segment size, or checksumming. (Why not use this opportunity to turn on data checksums?)

3. Before you start the new instance, you might need to change some configuration settings. If the instance runs on the same host as the old instance, you need to set a different port number. Also, carry over any custom changes you have made in postgresql.conf on your old instance, such as memory settings, max_connections, etc. Similarly, make pg_hba.conf settings appropriate to your environment. You can usually start by copying over the pg_hba.conf file from the old instance. If you want to use SSL, set that up now.

4. Start the new (empty) instance and check that it works to your satisfaction. If you set up the new instance on a new host, check at this point that you can make a database connection (using psql) from the new host to the old database instance. We will need that in the subsequent steps.

5. Copy over the schema definitions with pg_dumpall. (Or you can do it with pg_dump for each database separately, but then don’t forget global objects such as roles.)

pg_dumpall -s >schemadump.sql
psql -d postgres -f schemadump.sql

Any schema changes after this point will not be migrated. You would have to manage those yourself. In many cases, you can just apply the changing DDL on both hosts, but running commands that change the table structure during an upgrade is probably a challenge too far.

6. In each database in the source instance, create a publication that captures all tables:

CREATE PUBLICATION p_upgrade FOR ALL TABLES;

Logical replication works separately in each database, so this needs to be repeated in each database. On the other hand, you don’t have to upgrade all databases at once, so you can do this one database at a time or even not upgrade some databases.

7. In each database in the target instance, create a subscription that subscribes to the just-created publication. Be sure to match the source and target databases correctly.

CREATE SUBSCRIPTION s_upgrade CONNECTION 'host=oldhost port=oldport dbname=dbname ...' PUBLICATION p_upgrade;

Set the connection parameters as appropriate.

8. Now you wait until the subscriptions have copied over the initial data and have fully caught up with the publisher. You can check the initial sync status of each table in a subscription in the system catalog pg_subscription_rel (look for r = ready in column srsubstate). The overall status of the replication can be checked in pg_stat_replication on the sending side and pg_stat_subscription on the receiving side.

9. As mentioned above, sequence changes are not replicated. One possible workaround for this is to copy over the sequence values using pg_dump. You can get a dump of the current sequent values using something like this:

pg_dump -d dbname --data-only -t '*_seq' >seq-data.sql

(This assumes that the sequence names all match *_seq and no tables match that name. In more complicated cases you could also go the route of creating a full dump and extracing the sequence data from the dump’s table of contents.)

Since the sequences might advance as you do this, perhaps munge the seq-data.sql file to add a bit of slack to the numbers.

Then restore that file to the new database using psql.

10. Showtime: Switch the applications to the new instances. This requires some thinking ahead of time. In the simplest scenario, you stop your application programs, change the connection settings, restart. If you use a connection proxy, you can switch over the connection there. You can also switch client applications one by one, perhaps to test things out a bit or ease the load on the new system. This will work as long as the applications still pointing to the old server and those pointing to the new server don’t make conflicting writes. (In that case you would be running a multimaster system, at least for a short time, and that is another order of complexity.)

11. When the upgrade is complete, you can tear down the replication setup. In each database on the new instance, run

DROP SUBSCRIPTION s_upgrade;

If you have already shut down the old instance, this will fail because it won’t be able to reach the remote server to drop the replication slot. See the DROP SUBSCRIPTION man page for how to proceed in this situation.

You can also drop the publications on the source instance, but that is not necessary since a publication does not retain an resources.

12. Finally, remove the old instances if you don’t need them any longer.

Some additional comments on workarounds for things that logical replication does not support. If you are using large objects, you can move them over using pg_dump, of course as long as they don’t change during the upgrade process. This is a significant limitation, so if you are a heavy user of large objects, then this method might not be for you. If your application issues TRUNCATE during the upgrade process, those actions will not be replicated. Perhaps you can tweak your application to prevent it from doing that for the time of the upgrade, or you can substitute a DELETE instead. PostgreSQL 11 will support replicating TRUNCATE, but that will only work if both the source and the destination instance are PostgreSQL 11 or newer.

Some closing comments that really apply to all upgrade undertakings:

  • Applications and all database client programs should be tested against a new major PostgreSQL version before being put into production.
  • To that end, you should also test the upgrade procedure before executing it in the production environment.
  • Write things down or better script and automate as much as possible.
  • Make sure your backup setup, monitoring systems, and any maintenance tools and scripts are adjusted appropriately during the upgrade procedure. Ideally, these should be in place and verified before the switchover is done.

With that in mind, good luck and please share your experiences.

Bruce Momjian: Signing Rows

$
0
0

With the RSA keys created in my previous blog entry, we can now properly sign rows to provide integrity andnon-repudiation, which we did not have before. To show this, let's create a modified version of the previous schema by renaming the last column to signature:

CREATE TABLE secure_demo2 (
        id SERIAL, car_type TEXT, license TEXT, activity TEXT, 
        event_timestamp TIMESTAMP WITH TIME ZONE, username NAME, signature BYTEA);

Continue Reading »

REGINA OBE: pgAdmin4 now offers PostGIS geometry viewer

$
0
0

pgAdmin4 version 3.3 released this week comes with a PostGIS geometry viewer. You will be able to see the graphical output of your query directly in pgAdmin, provided you output a geometry or geography column. If your column is of SRID 4326 (WGS 84 lon/lat), pgAdmin will automatically display against an OpenStreetMap background.

We have Xuri Gong to thank for working on this as a PostGIS/pgAdmin Google Summer of Code (GSOC) project. We'd like to thank Victoria Rautenbach and Frikan Erwee for mentoring.

Continue reading "pgAdmin4 now offers PostGIS geometry viewer"

Regina Obe: PGOpen 2018 Data Loading Presentation Slides

Bruce Momjian: Monitoring Complexity

$
0
0

I have always had trouble understanding the many monitoring options available in Postgres. I was finally able to collect all popular monitoring tools into a single chart (slide 96). It shows the various levels of monitoring: OS, process, query, parser, planner, executor. It also separates instant-in-time reporting and across-time analysis options.

Viewing all 9665 articles
Browse latest View live


<script src="https://jsc.adskeeper.com/r/s/rssing.com.1596347.js" async> </script>